Abstract
Background:
The purpose of this study was to estimate the prevalence of occupational noise exposure, hearing difficulty and cardiovascular conditions within US industries and occupations, and to examine any associations of these outcomes with occupational noise exposure.
Methods:
National Health Interview Survey data from 2014 were examined. Weighted prevalence and adjusted prevalence ratios of self-reported hearing difficulty, hypertension, elevated cholesterol, and coronary heart disease or stroke were estimated by level of occupational noise exposure, industry, and occupation.
Results:
Twenty-five percent of current workers had a history of occupational noise exposure (14% exposed in the last year), 12% had hearing difficulty, 24% had hypertension, 28% had elevated cholesterol; 58%, 14%, and 9% of these cases can be attributed to occupational noise exposure, respectively.
Conclusions:
Hypertension, elevated cholesterol, and hearing difficulty are more prevalent among noise-exposed workers. Reducing workplace noise levels is critical. Workplace-based health and wellness programs should also be considered.
Keywords: cardiovascular disease, hearing loss, National Health Interview Survey, occupational noise, surveillance
1 |. INTRODUCTION/BACKGROUND
Hazardous noise is one of the most common occupational hazards in the United States with over 22 million workers exposed.1 Along with hearing difficulty, noise exposure has been linked to many health effects. Particularly concerning is its proposed link to several manifestations of cardiovascular disease, including hypertension (chronically elevated blood pressure), arteriosclerosis (abnormal thickening or hardening of the arterial walls), and ischemic or coronary heart disease (CHD).2 The pathway from noise exposure to these manifestations has been theorized to work through both the autonomic nervous system and endocrine system via a stress response that elevates many of the key biological risk factors for cardiovascular disease such as blood pressure and blood lipids (ie, cholesterol).3
The distribution of these conditions among workers have not been well-characterized in nationally representative studies by industry and occupation. A study analyzing Behavioral Risk Factor Surveillance System (BRFSS) data estimated hypertension and elevated cholesterol prevalence in current workers by occupation, but its generalizability may be limited due to being based on data from only 21 states.4 Another study estimated the prevalence of CHD or stroke among current US workers by industry using 2010 National Health Interview Survey (NHIS) data, but did not include estimates for those over age55.5 Existing hypertension and hearing difficulty prevalence estimates by industry and occupation are based on 20106 and 2007 NHIS data respectively.7 The most recent published estimates of hazardous noise exposure prevelence by industry are based on 1999–2004 National Health and Nutrition Examination Survey (NHANES) data.1 To our knowledge, there are no studies presenting the distribution of elevated cholesterol by industry, CHD or stroke by occupation, or job-related noise exposure by occupation among US workers. New and updated surveillance information is needed for targeting prevention efforts among workers and assessing progress over time.
It follows that the association between occupational noise exposure and hypertension, elevated cholesterol, CHD or stroke is of interest; especially if reducing noise exposure may also reduce the risk of developing these cardiovascular conditions [the causal relationship between noise and hearing difficulty is already well-established]. Research exploring the association between occupational noise exposure and these cardiovascular conditions has had mixed results. The available literature is consistent in finding a moderate association between occupational noise and hypertension.8–10 However, research regarding associations with other manifestations of cardiovascular disease, such as elevated cholesterol and CHD, has been less consistent, with some studies finding no association.11,12 Many studies assessing the association between occupational noise and cardiovascular conditions have suffered from small sample sizes,13 inadequate control of important covariates such as BMI or socioeconomic satus,14 or lack of generalizability due to being conducted in a single occupation or industry.15 Additionally, most studies were conducted on workers outside of the United States.10,12
Using 2014 NHIS data, the objectives of this study were to: (1) estimate the current prevalence of elevated cholesterol, CHD or stroke, hypertension, hearing difficulty, and occupational noise exposure among US workers by industry and occupation; and (2) examine any associations between occupational noise exposure and hypertension, elevated cholesterol, CHD or stroke. The adjusted risk and the proportion of cases of each outcome attributable to noise exposure, if any, were estimated.
2 |. MATERIALS AND METHODS
2.1 |. Study design and population
This study was conducted using publicly available 2014 NHIS data. The NHIS is a cross-sectional in-person household survey of the non-institutionalized US civilian population conducted by the National Center for Health Statistics (NCHS) to monitor the health of the nation. NHIS survey participants are chosen through a complex, stratified, multi-stage sampling procedure in order to achieve a nationally representative sample.16 Data are generally collected via a computer-assisted face-to-face interview in the participant’s home. The survey year 2014 was chosen as it is the most recent NHIS survey that includes questions regarding occupational noise exposure and hearing difficulty. The 2014 NHIS was approved by the Research Ethics Review Board of the National Center for Health Statistics and the US Office of Management and Budget. All 2014 NHIS participants orally consented prior to participation and the overall adult response rate for that year was 58%.
Our sample included male and female current workers aged 18 or older with valid industry and occupation codes for their most recent main job. Participants were determined to be current workers if they reported working at any time in the 12 months preceding interview. Open-ended responses were obtained from each employed sample adult respondent regarding his/her industry (employer’s type of business) and occupation (employee’s type of work), for the main job held in the past 12 months. The industry and occupation of each worker’s main job were coded based on their verbatim response. These responses were reviewed by US Census Bureau coding specialists who assigned 4-digit industry and occupation codes. The data were coded using 2011 US Census codes based on the 2007 North American Industry Classification System (NAICS) and 2010 Standard Occupational Classification (SOC) system.17,18 To allow for sufficient sample size to obtain more reliable estimates, we used less detailed 2-digit industry and occupation (I&O) recodes. The industry recodes include 21 simple categories, and the occupation recodes include 23 simple categories. The 2-digit industry recodes were also sorted into sectors similar to the NIOSH, National Occupational Research Agenda (NORA) sectors.19 The Management of Companies and Enterprises industry (NAICS 55) was excluded from industry analyses due to insufficient sample size.
2.2 |. NHIS outcome and exposure questions
The outcomes of interest in this study were hearing difficulty, hypertension, elevated cholesterol, and CHD or stroke. Hearing difficulty was assessed based on the question “Is your hearing excellent, good, a little trouble hearing, moderate trouble, a lot of trouble, or are you deaf? [without the use of hearing aids or other assistive devices]” Answers of “a little trouble hearing,” “moderate trouble,” and “a lot of trouble” were grouped together as “Yes” (has difficulty) and answers of “excellent” or “good hearing” were grouped together as “No” (does not have difficulty). Those who reported excellent hearing in one ear and deafness in the other were excluded from the analysis as this kind of hearing impairment is unlikely to be caused by occupational exposures.20 Those who reported being deaf in both ears were also excluded as this is unlikely to have been caused predominately by occupational noise, and because bilateral deafness would prevent the worker from having any potential cardiovascular effects from noise.21 Workers who reported having any level of hearing difficulty were asked about the main cause. Workers who reported that their hearing difficulty was: (1) present at birth due to the mother having an infectious disease or a genetic defect; (2) present after birth due to an infectious disease; or (3) from a brain tumor, were excluded from the analysis. These causes are definitive and verifiable, and with the exception of a brain tumor (14 cases), would likely have occurred before encountering any occupational noise.21
All of the cardiovascular conditions assessed were defined as “Yes” if the respondent reported “ever having been told by a doctor or other health professional” that they had the condition. CHD was considered present if the subject reported ever being told by a health professional that they had at least one of the following conditions: CHD, angina pectoris, or myocardial infarction.12 CHD and stroke were examined together as a single outcome due to the small numbers of respondents with these conditions; workers with these conditions usually leave the workforce.5 To examine the effect that this loss from the workforce had on the association of noise with these conditions, all analyses regarding CHD or stroke were performed on both the entire study sample and among those under age 56.22 Hypertension and elevated cholesterol were assessed only among those who reported ever having this condition checked. Thirteen percent of workers reported never having their cholesterol levels checked and 2% reported never having their blood pressure checked.
History of occupational noise exposure was assessed using the following two questions asked in order: (1) “Have you ever had a job, or combination of jobs, where you were exposed to very loud sounds or noise for four or more hours a day, several days a week? Very loud means so loud that you must SHOUT in order to be understood by someone standing three feet (arm’s length) away”; and (2) “Have you ever had a job, or combination of jobs, where you were exposed to loud sounds or noise for four or more hours a day, several days a week? Loud means so loud that you must SPEAK IN A RAISED VOICE to be heard.” Only those who answered “No” to the first question were asked the second question. Workers who answered “Yes” to the first question were categorized as having had “Very Loud” exposure; those who answered “Yes” to the second question were categorized as having had “Loud” exposure, and those who answered “No” to both questions were categorized as having had “No Exposure.” When analyzed dichotomously, workers who answered “Yes” to the first or second question were categorized as having “Very Loud or Loud” exposure. Occupational noise exposure within the last 12 months was also assessed using a follow-up question but was not the primary noise outcome.
The covariates of interest in this analysis were age, gender, race/ethnicity, education, BMI, smoking, alcohol use, and diabetes. Age was grouped into seven categories (18–25, 26–35, … 76+) for comparison with prior studies.7 Race and ethnicity were combined and workers reporting Hispanic or Spanish origin were categorized as Hispanic. Workers with American Indian, Alaska Native, race group not releasable, and multiple race were categorized as Other Race/Ethnicity. The highest education level achieved by a living member of the family was used as a proxy for SES. BMI was based on self-reported height and weight and was dichotomized into obese (≥30) and not obese (<30). Smoking was recoded into current, former, and never. Current alcohol use was regrouped into nondrinker, infrequent/light drinker and moderate/heavier drinker. Finally, diabetes was based on the participant reporting ever having been told by a doctor or other health professional that they had diabetes.
2.3 |. Statistical analysis
Weighted prevalence estimates for each outcome by level of occupational noise exposure, industry, occupation, and each covariate were estimated using the SAS surveyfreq procedure. Prevalence estimates with relative standard error (RSE) >30% and <50% are noted and estimates with RSE >50% are not reported. Weighted adjusted prevalence ratios (PRs) with 95% confidence intervals for each outcome by level of occupational noise exposure and each covariate were estimated utilizing the SUDAAN procedure rlogist. The SUDAAN rlogist procedure can produce PRs in addition to odds ratios and these can be interpreted as relative risk estimates.23 The PRs were adjusted for age, gender, race/ethnicity, education, BMI, smoking status, alcohol use, and diabetes. The adjusted PRs were used to generate the fraction of cases of each outcome attributable to each level of occupational noise exposure [(PRadjusted − 1)/PRadjusted]. Weighted adjusted PRs with 95% confidence intervals for each of the cardiovascular conditions by history of noise exposure in combination with the presence or absence of hearing difficulty were also estimated.
The reference industry assigned for the industry analyses of hearing difficulty was Finance and Insurance, as it had the lowest prevalence of noise exposure in our study sample, was designated as the reference industry in a previous analysis of NHIS data, and has been shown to have a lower risk of hearing loss.24 Business and Financial Operations was assigned as the reference occupation for the occupation analyses of hearing difficulty, as it had one of the lower prevalences of noise exposure in our study and allows for better consistency of comparison. The literature is inconsistent as to which industry or occupation has the lowest risk for the cardiovascular conditions, so the reference was designated as all other industries or occupations combined. The reference group for noise exposure was “No exposure.” Reference groups for each covariate are designated in Table 1. All analyses were performed using SAS version 9.3 (SAS Institute Inc., Cary, NC) and SUDAAN version 11 (RTI International, Research Triangle Park, NC) statistical software.
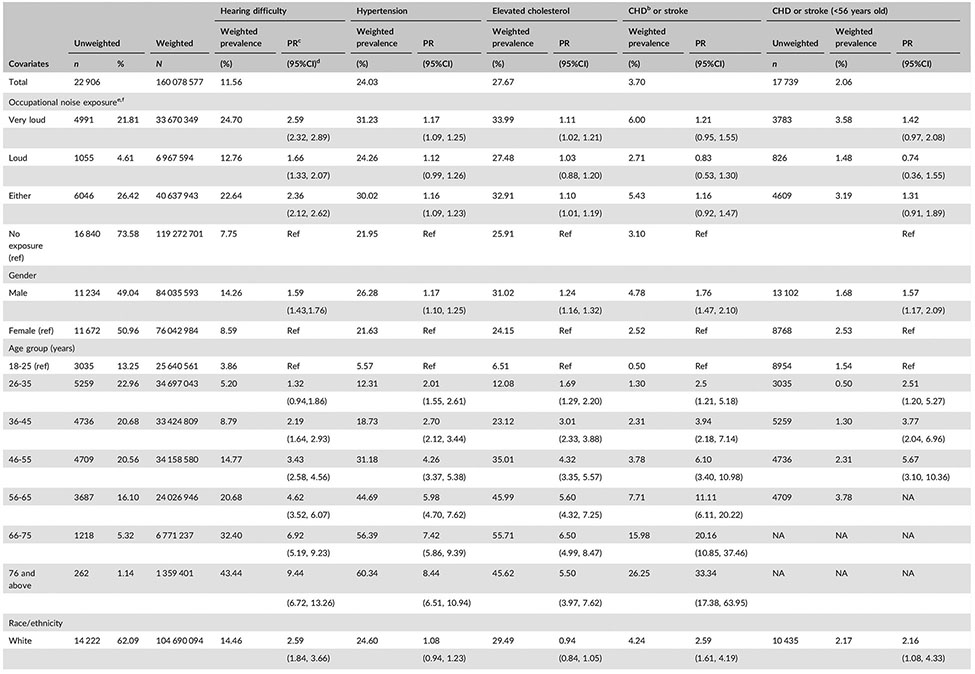
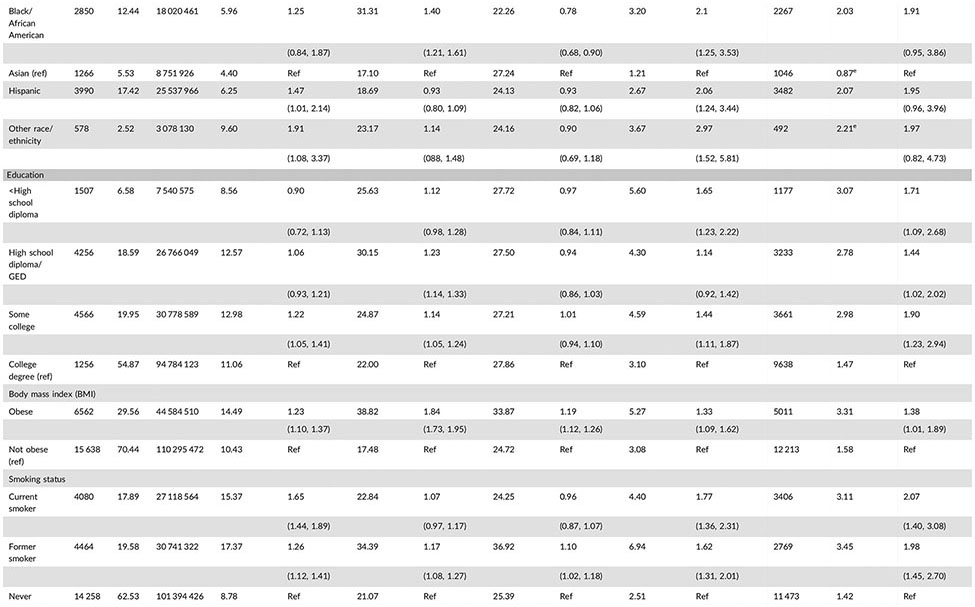
TABLE 1.
Hearing difficulty and cardiovascular conditions by level of occupational noise exposure and covariates in current US workers, 2014 (N = 22,906)a
Data are from the National Health Interview Survey, 2014 adult sample.
CHD, coronary heart disease, defined as self-reported angina pectoris, myocardial infarction, and/or coronary heart disease.
PR, prevalence ratio (adjusted for gender, age, race/ethnicity, education, BMI, smoking status, alcohol use, and diabetes).
95% confidence interval.
Self-reported noise exposure (at least 4 hr a day, several days a week) at any time period in a current worker’s job history.
The weighted prevalence of noise among US workers is 25% (21% very loud; 4% loud).
These estimates have a relative standard error ≥30% and ≤50% and should be used with caution as they do not meet the standards of reliability/precision.
3 |. RESULTS
Of the 22 906 current workers, 49% were male, 62% were white and 55% had a college degree (Table 1). The prevalence of each condition among workers was: hearing difficulty 12%, hypertension 24%, elevated cholesterol 28%, and CHD or stroke 4%. Twenty-five percent of workers self-reported ever having been exposed to occupational noise with 14% exposed in the last 12 months (data not shown). For all the conditions, risk increased with age and was significantly higher among males, former smokers, and obese and diabetic workers. Alcohol use showed more of a mixed association depending on the outcome, with: (1) no significant difference between both infrequent/light and moderate/heavier drinkers and non-drinkers for hearing difficulty or hypertension; (2) a significantly higher risk among moderate/heavy drinkers for elevated cholesterol; and (3) a significantly lower risk among all drinkers for CHD or stroke compared to nondrinkers when all age-groups were included.
3.1 |. Prevalence and risk within industries
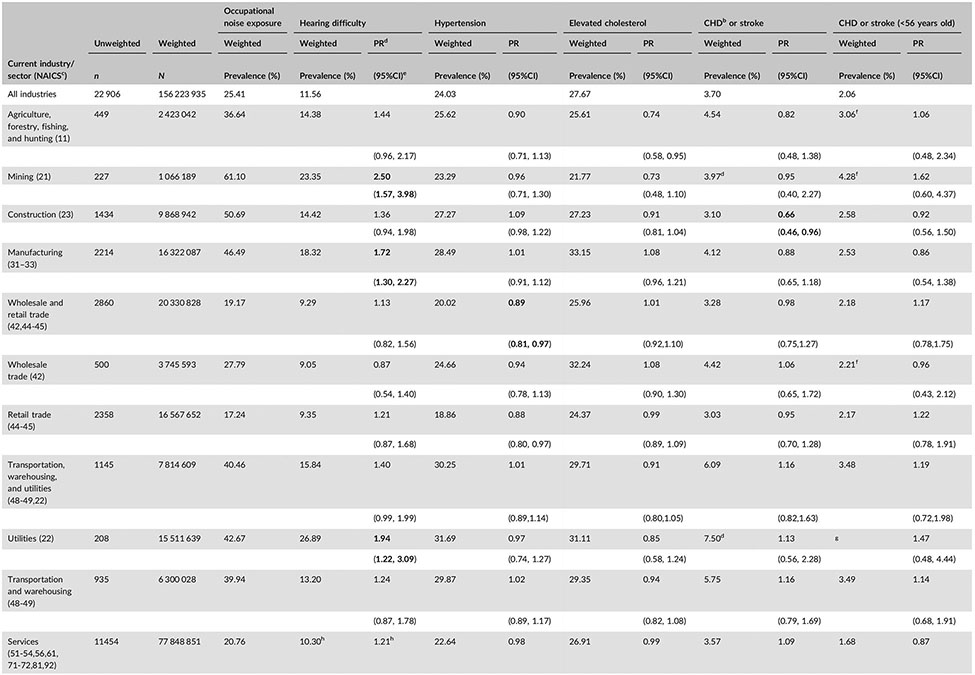
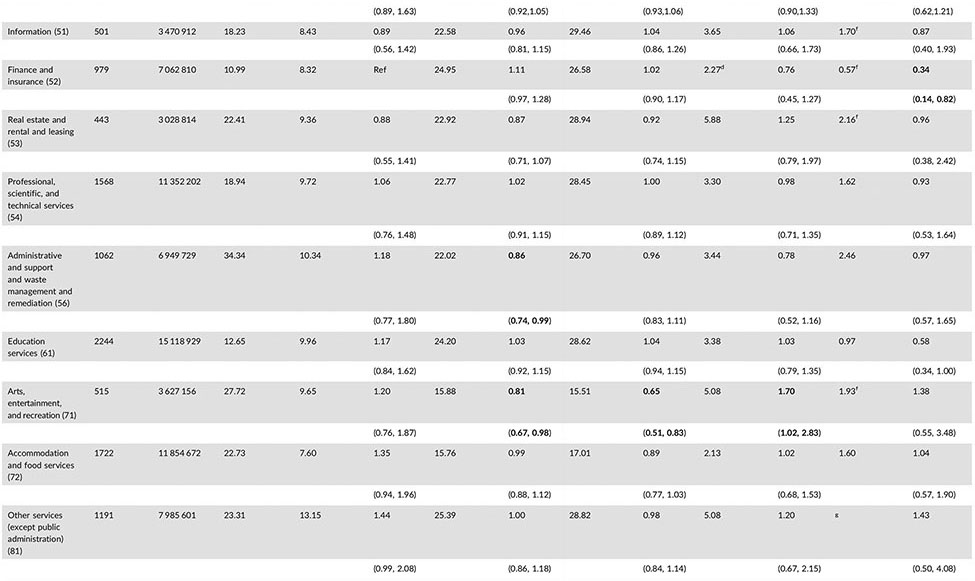
The industries with the highest prevalence of self-reported occupational noise exposure were Mining (61%), Construction (51%), Manufacturing (47%), Utilities (43%), and Transportation and Warehousing (40%) (Table 2). Workers in Mining, Utilities, and Manufacturing had significantly higher risks of hearing difficulty than workers in Finance and Insurance, with 150%, 90%, and 72% higher risks, respectively. Only a few industries had significantly higher risks for the cardiovascular conditions than all other occupations combined. Healthcare and Social Assistance had a significantly higher risk of hypertension (PR:1.10, CI:1.01–2.10) and Public Administration had a significantly higher risk of elevated cholesterol (PR:1.10, CI:1.01–2.10). Arts, Entertainment, and Recreation had a significantly higher risk of CHD or stroke (PR:1.70, CI:1.02–2.83) despite having a significantly lower risk of both hypertension and elevated cholesterol.
TABLE 2.
Prevalence of occupational noise exposure, hearing difficulty, and cardiovascular conditions by industry and sector for current US workers in 2014 (N = 22 906)a
Bold values signify <0.05.
Data are from the National Health Interview Survey, 2014 adult sample.
CHD, coronary heart disease, defined as self-reported angina pectoris, myocardial infarction, and/or coronary heart disease.
NAICS, North American Industry Classification System (2007).
PR, prevalence ratio (adjusted for gender, age, race/ethnicity, education, BMI, smoking status, alcohol use, and diabetes). Each industry sector was compared to all other industries combined.
CI, confidence interval.
These estimates have a relative standard error ≥30% and ≤50% and should be used with caution as they do not meet the standards of reliability/precision.
Estimates not shown as they have a relative standard error ≥50% and do not meet the standards of reliability/precision.
3.2 |. Prevalence and risk within occupations
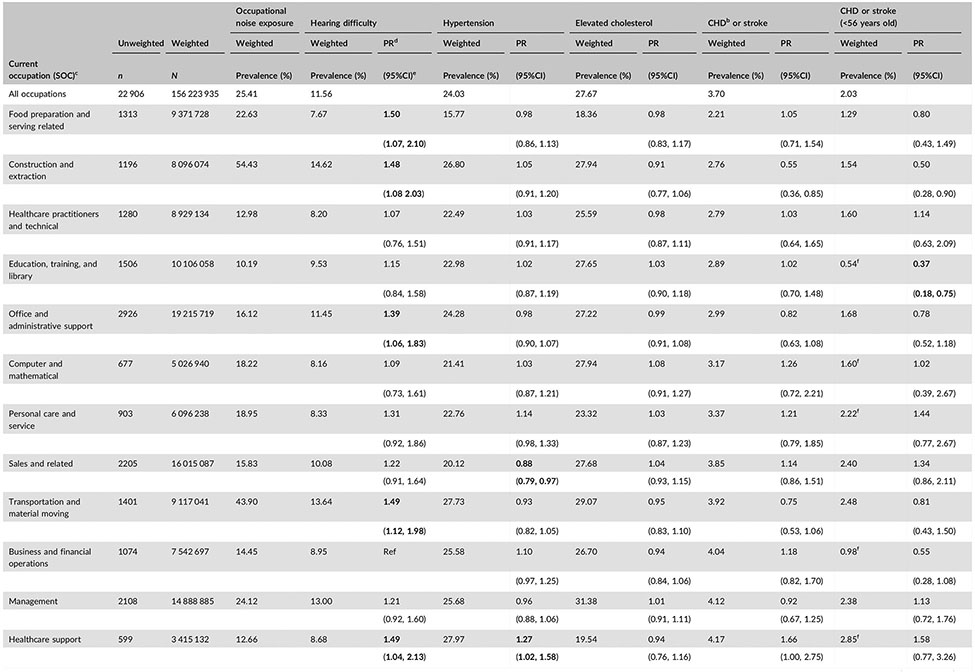
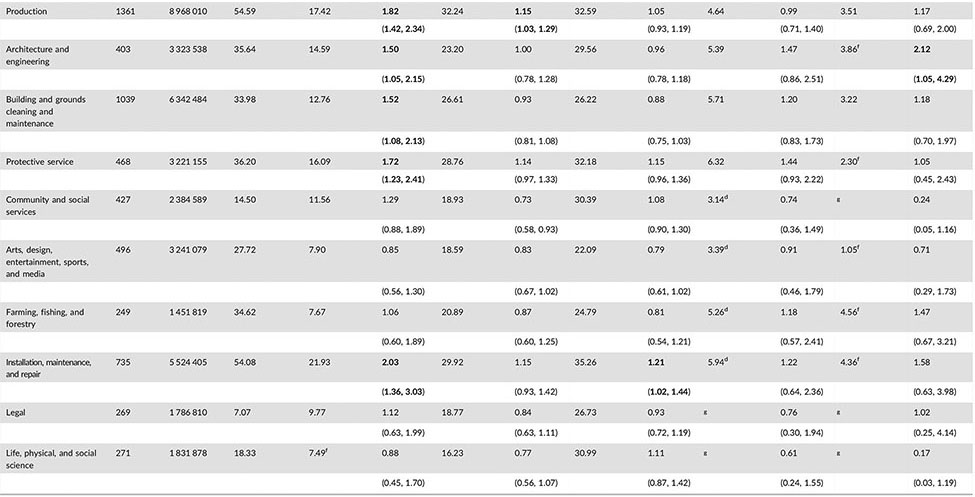
The occupations with the highest prevalence of self-reported occupational noise exposure were Production (55%), Construction and Extraction (54%), Installation, Maintenance and Repair (54%), Transportation and Material Moving (44%), and Protective Service (36%) (Table 3). About half of the occupations had significantly higher risks of hearing difficulty when compared with Business and Financial Operations. Installation, Maintenance, and Repair had the highest risk for hearing difficulty (PR: 2.03 CI: 1.36–3.03), followed by Production (PR: 1.82, CI: 1.42–2.34). Healthcare Support had the highest risk of hypertension (PR: 1.27, CI: 1.02–1.58), followed by Production (PR: 1.15, CI: 1.03–1.29). Installation, Maintenance, and Repair had an increased risk of elevated cholesterol (PR: 1.21, CI:1.02–1.44) and Architecture and Engineering had an elevated risk of CHD or stroke when assessed among just those under age 56 (PR:2.12, CI: 1.05–4.29).
TABLE 3.
Prevalence of occupational noise exposure, hearing difficulty, and cardiovascular conditions by occupation for current US workers in 2014 (N = 22 906)a
Bold values signify <0.05.
Data are from the National Health Interview Survey, 2014 adult sample.
CHD, coronary heart disease, defined as self-reported angina pectoris, myocardial infarction, and/or coronary heart disease.
Standard occupational classification system (2010).
PR, prevalence ratio (adjusted for gender, age, race/ethnicity, education, BMI, smoking status, alcohol use, and diabetes). Each occupation sector was compared to all other industries combined.
CI, confidence interval.
These estimates have a relative standard error ≥30% and ≤50% and should be used with caution as they do not meet the standards of reliability/precision.
Estimates not shown as they have a relative standard error ≥50% and do not meet the standards of reliability/precision.
3.3 |. Association between occupational noise exposure and hearing difficulty
There was a clear dose response relationship between self-reported level of occupational noise exposure and hearing difficulty, and these results are presented in the tables/figures. However, since workers can be exposed to both loud and very loud noise throughout their careers and workers who reported very loud noise exposure were not asked about their loud noise exposure, the prevalence of loud noise exposure only includes workers exposed to loud noise alone (ie, not those exposed to both very loud and loud noise). Our results and discussion will mainly focus on any occupational noise exposure (loud or very loud noise exposure).
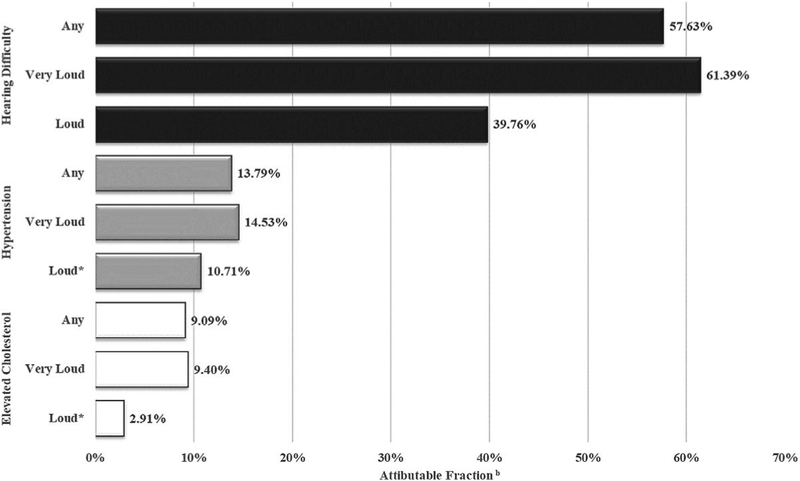
A history of occupational noise exposure led to a significantly elevated risk of both hypertension (PR: 1.16, CI: 1.09–1.23) and elevated cholesterol (PR: 1.10 CI: 1.01–1.19), but was not significantly associated with CHD or stroke even when the analysis was restricted to those under the age of 56. Based on these data, among US workers, 58% of hearing difficulty cases, 14% of hypertension cases, and 9% of elevated cholesterol cases can be attributed to exposure to occupational noise (Figure 1). Workers with hearing difficulty, regardless of noise exposure, had a significantly elevated risk of each cardiovascular condition assessed. Workers with a history of noise exposure but no reported hearing difficulty had a significantly elevated risk of hypertension and elevated cholesterol only (Table 4).
FIGURE 1.
Percent of cases of hearing difficulty and cardiovascular outcomes attributable to occupational noise exposure, 2014a. aData are from the National Health Interview Survey, 2014 adult sample. bAttributable fractions (in percents) were calculated using prevalence ratios adjusted for gender, age, race/ethnicity, education, BMI, smoking status, alcohol use, and diabetes. *Attributable Fraction is based on a non-significant prevalence ratio
TABLE 4.
Cardiovascular conditions by history of occupational noise exposure and presence of hearing difficulty (HD) in current US workers, 2014 (N = 22 906)a
Data are from the National Health Interview Survey, 2014 adult sample.
CHD, coronary heart disease, defined as self-reported angina pectoris, myocardial infarction, and/or coronary heart disease.
PR, prevalence ratio (adjusted for gender, age, race/ethnicity, education, BMI, smoking status, alcohol use, and diabetes).
95% confidence interval.
4 |. DISCUSSION
To our knowledge, this is the first study to report the prevalence of elevated cholesterol by industry, CHD or stroke by occupation, and occupational noise exposure by occupation. It is also the first study to generate the fraction of hearing difficulty, hypertension, elevated cholesterol and CHD or stroke attributable to occupational noise exposure. We will first discuss the prevalence of the outcomes among all workers and within industries and occupations, followed by a discussion of the associations with occupational noise exposure.
In this study, hypertension prevalence was similar to that found in an analysis of the 2010 NHIS data (4% higher) and the industries and occupations with the highest prevalences remained nearly the same.6 Also similar to Kaur et al,6 the Healthcare Support industry and its corresponding occupation, Healthcare and Social Assitance, showed an elevated risk of hypertension compared to all other industries combined and all other occupations combined, respectively. While this industry and occupation did not have a high prevalence of noise exposure in this study and had the lowest noise prevalence among industries in prior research,1 it is subject to shift work which has been linked to cardiovascular conditions including hypertension.25 Additionally, this elevated prevalence could be influenced by detection bias as workers in this field are more likely to regularly receive blood pressure screening. Production was the only other occupation group with an elevated risk for hypertension. This occupation group had the highest prevalence of noise exposure. Production workers also often work in shifts, leading to increased risk for cardiovascular disease.25
Although the prevalence of elevated cholesterol was recently reported by occupation, those estimates were adjusted for noted demographics and risk factors4 and thus are not directly comparable to our study results which are meant to establish the overall prevalence in each occupation. In our study, workers in Public Administration had a higher risk of elevated cholesterol compared to all other industries combined. While the noise prevalence was not high, many of these workers are employed in offices with sedentary jobs. Sedentary jobs have been shown to increase one’s risk for metabolic syndrome which includes hypertension and elevated cholesterol.26,27 Firefighters and police officers also work in this industry, and these occupations often include long segments of inactivity between fires and police actions. Police officers and firefighters also experience a number of physical and psychological stressors, such as noise and trauma, which put them at a higher risk for cardiovascular conditions like elevated cholesterol.28,29 The Installation, Maintenance, and Repair occupation group also had a significantly higher risk of elevated cholesterol. This occupation group also had one of the highest prevalences of occupational noise.
The prevalence of CHD or stroke for workers under age 56 (2%) matched a previous study (2%) which also reported prevalence by industry.5 In contrast to our industry analysis among all adult workers, when this analysis was restricted to workers under age 56 the distribution among industries and occupations better matched that of occupational noise. This might be explained by the stronger association of CHD or stroke to age than to other risk factors (eg, noise) among older adults,22 and workers transitioning to less physical and correspondingly less noisy jobs as they age.30 This effect of age may also explain why Arts, Entertainment, and Recreation workers had an increased risk for CHD or stroke when assessed among all ages, but not when analysis was restricted to those under age 56.
Associations of studied outcomes with occupational noise exposure varied. Our results confirmed the strong relationship between worker hearing difficulty and occupational noise exposure in that the majority of cases (58%) were attributable to noise. Among the cardiovascular conditions, hypertension appears to be the most strongly linked to noise exposure in our analysis and is the most consistently noise-linked condition in the literature.10 Our analysis also showed that those exposed to occupational noise had a significantly elevated prevalence of elevated cholesterol. However, this relationship has been less consistently observed the literature than hypertension. Some studies found no association at all11 and others found an association with only certain types of cholesterol, such as a lower HDL among those with bilateral high frequency hearing loss.31
Although our estimates related to the association of occupational noise to CHD or stroke failed to achieve significance, they are consistent in magnitude with the current literature10,12 and may have been influenced by the low prevalence of these conditions among current workers and the associated lack of power. While both hypertension and elevated cholesterol were found to be significantly associated with noise exposure among those who did not report hearing difficulty, the prevalence of CHD or stroke was found to be significantly elevated only among workers who had both hearing difficulty and a history of occupational noise exposure. This association was strengthened when the analysis was restricted to those under age 56. This may indicate that noise exposure needs to be of a sufficient duration to cause hearing difficulty before it begins to measurably affect the risk of CHD or stroke. Workers with hearing difficulty and no history of occupational noise also had an elevated risk of CHD or stroke. Workers who reported hearing difficulty but no occupational noise exposure were more likely to report that their hearing loss was due to aging than any other cause (35%; data not shown) and were significantly less likely to report exposure to recreational noise than those reporting both hearing difficulty and occupational noise exposure (P < 0.0001). This may be due to a reduced understanding of hazardous environmental noise levels compared to occupationally exposed workers who usually have participated in worksite hearing conservation programs and likely received at least some related safety training.
In light of the significant association between a history of occupational noise exposure and both hypertension and elevated cholesterol, the high prevalence of current workers who have ever been exposed (41 million) and, more specifically, exposed in the last 12 months (22 million) is noteworthy. A recent publication, also examining the 2014 NHIS dataset, related to noise exposures among all US adults reported similar results.32 Tak et al1 also estimated that 22 million US workers were exposed to occupational noise in the past 12 months using 1999–2004 NHANES data. This number has not improved in the subsequent 10–15 years, although the percentage exposed decreased from 17% to 14%. However, the exposure question used in the Tak et al1 paper allowed for any duration of exposure whereas our analysis required “4 or more hours a day, several days a week.” This may further indicate a lack of real improvement in reducing noise exposures in the workplace. The industries and occupations with the highest risk for exposure remained the same as in 1999–2004.1 The prevalence of hearing difficulty among US workers is nearly the same as last estimated using 2007 data (1% higher) and the industries and occupations with the greatest risk remain the same.7
There were several limitations to this study. We cannot infer causality due to the cross-sectional nature of the NHIS survey, which is prone to reverse causality. However, the causal link between noise and hearing difficulty is well-established.2 While all variables were based on self-report which can lead to biased estimates, the survey questions have been validated. The question assessing hearing difficulty was validated against audiometric threshold estimates,21 and the hyper-tension and CHD/stroke questions were validated against medical records.33 All were found to have high specificity and moderate to good sensitivity. However, the question for elevated cholesterol has been shown to be much less reliable in similar validation attempts.34 The arrangement of the noise exposure questions may have led to workers being potentially misclassified into the higher exposure level. However, recall of occupational noise exposure in general has been found to be valid when rating the level of noise.35,36 This study was unable to control for the duration of noise exposure as the relevant NHIS questions are insufficient to reconstruct lifetime dose and have yet to be validated. This may have biased estimates of association with cardiovascular disease toward the null. Additionally, there are other factors known to cause cardiovascular disease such as lack of exercise and poor diet that were not controlled for in this study. However, there are no studies linking these factors to self-reported occupational noise exposure making it unlikely that they confound this association. Finally, both hypertension and elevated cholesterol may be subject to under-reporting due to lack of screening. Those reporting not being screened were more likely to be male, a current smoker, work in a high noise prevalence industry or occupation, report occupational noise exposure, and report lower educational attainment (data not shown). Given that these are also risk factors for hypertension and elevated cholesterol, it is likely that the true prevalence and association with noise is higher than estimated in this study.
Greater than a quarter of the US workforce have been impacted by occupational noise. Its causal relationship with hearing difficulty and biological stress is well-established2 and this study provides further evidence of an association with hypertension and elevated cholesterol. Significant percentages of worker cases of hearing difficulty (58%), hypertension (14%), and elevated cholesterol (9%) were found to be attributable to occupational noise, and these percentages represent large numbers of workers. Because a causal relationship has been established between occupational noise and hearing difficulty, the attributable fraction identifies how many cases could be prevented if the noise was reduced to safer levels. Specifically, we could prevent 5 302 208 of the 9 200 430 cases of hearing difficulty among noise-exposed workers. Since causal relationships between occupational noise and both hypertension and elevated cholesterol are still under debate, the attributable fraction tells us the number of excess cases of these conditions among noise-exposed workers as compared with among non-noise-exposed workers. We can only speculate that if there was a causal relationship between these variables, then perhaps 1 682 313 cases of hypertension and 1 215 692 cases of elevated cholesterol among noise exposed workers could potentially be prevented if noise was reduced to safer levels.
Reducing workplace noise and improving strategies for protecting noise-exposed workers is critical for prevention. Worksite health and wellness programs which include screenings for hypertension and elevated cholesterol should also target noise-exposed workers. Interventions can be modest in cost, such as screening workers using portable cholesterol screening systems and portable blood pressure monitors operated by non-medical personnel. Such interventions also have been shown to have a substantial return on investment by reducing losses in productivity from disease progression and boosting morale.37 Finally, although this study makes some strides towards characterizing the association between occupational noise and cardiovascular disease, further research is needed to establish the noise level at which risk increases and the exact nature of this increase.
ACKNOWLEDGMENT
The authors wish to thank Jia Li for her expert advice related to the statistical analysis.
FUNDING
The authors report that there was no funding source for the work that resulted in the article or the preparation of the article.
Footnotes
DISCLOSURE (AUTHORS)
The authors declare no conflicts of interest.
DISCLOSURE BY AJIM EDITOR OF RECORD
Paul Landsbergis declares that he has no conflict of interest in the review and publication decision regarding this article.
ETHICS APPROVAL AND INFORMED CONSENT
Since all data came from the publically available National Health Interview Survey, no ethics review or approval occurred.
Institution at which the work was performed: NIOSH, Centers for Disease Control and Prevention, Cincinnati, OH.
Publisher's Disclaimer: DISCLAIMER
The findings and conclusions in this report are those of the author(s) and do not necessarily represent the official position of the National Institute for Occupational Safety and Health, Centers for Disease Control and Prevention.
REFERENCES
- 1.Tak S, Davis RR, Calvert GM. Exposure to hazardous workplace noise and use of hearing protection devices among US workers—NHANES, 1999–2004. Am J Ind Med. 2009;52:358–371. [DOI] [PubMed] [Google Scholar]
- 2.Themann C, Suter AH, Stephenson MR. National research agenda for the prevention of occupational hearing loss—part 1. Semin Hear. 2013;34:145–207. [Google Scholar]
- 3.Basner M, Babisch W, Davis A, et al. Auditory and non-auditory effects of noise on health. The Lancet. 2014;383:1325–1332. [DOI] [PMC free article] [PubMed] [Google Scholar]
- 4.Shockey TM. Cardiovascular health status by occupational group—21 states, 2013. MMWR Morb Mortal Wkly Rep. 2016;65:793–798. [DOI] [PubMed] [Google Scholar]
- 5.Luckhaupt SE, Calvert GM. Prevalence of coronary heart disease or stroke among workers aged <55 years—United States, 2008–2012. Morb Mortal Wkly Rep. 2014;63:645–649. [PMC free article] [PubMed] [Google Scholar]
- 6.Kaur H, Luckhaupt SE, Li J, Alterman T, Calvert GM. Workplace psychosocial factors associated with hypertension in the U.S. workforce: a cross-sectional study based on the 2010 National Health Interview Survey. Am J Ind Med. 2014;57:1011–1021. [DOI] [PubMed] [Google Scholar]
- 7.Masterson EA, Themann CL, Luckhaupt SE, Li J, Calvert GM. Hearing difficulty and tinnitus among U.S. workers and non-workers in 2007. Am J Ind Med. 2016;59:290–300. [DOI] [PubMed] [Google Scholar]
- 8.Tomei G, Fioravanti M, Cerratti D, et al. Occupational exposure to noise and the cardiovascular system: a meta-analysis. Sci Total Environ. 2010;408:681–689. [DOI] [PubMed] [Google Scholar]
- 9.de Souza TCF, Périssé ARS, Moura M. Noise exposure and hypertension: investigation of a silent relationship. BMC Public Health. 2015;15:328. [DOI] [PMC free article] [PubMed] [Google Scholar]
- 10.Skogstad M, Johannessen HA, Tynes T, Mehlum IS, Nordby K-C, Lie A. Systematic review of the cardiovascular effects of occupational noise. Occup Med. 2016;66:10–16. [DOI] [PubMed] [Google Scholar]
- 11.Arlien-Søborg MC, Schmedes AS, Stokholm ZA, et al. Ambient and at-the-ear occupational noise exposure and serum lipid levels. Int Arch Occup Environ Health. 2016;89:1087–1093. [DOI] [PubMed] [Google Scholar]
- 12.Dzhambov AM, Dimitrova DD. Occupational noise and ischemic heart disease: a systematic review. Noise Health. 2016;18:167. [DOI] [PMC free article] [PubMed] [Google Scholar]
- 13.Vangelova KK, Deyanov CE. Blood pressure and serum lipids in industrial workers under intense noise and a hot environment. Rev Environ Health. 2011;22:303–312. [DOI] [PubMed] [Google Scholar]
- 14.Rosenhall U, Sundh V. Age-related hearing loss and blood pressure. Noise Health. 2006;8:88. [DOI] [PubMed] [Google Scholar]
- 15.Liu J, Xu M, Ding L, et al. Prevalence of hypertension and noise-induced hearing loss in Chinese coal miners. J Thorac Dis. 2016;8:422–429. [DOI] [PMC free article] [PubMed] [Google Scholar]
- 16.National Center for Health Statistics. National Health Interview Survey. https://www.cdc.gov/nchs/nhis/nhis_2014_data_release.htm. Published 2014.
- 17.U.S. Bureaou of Labor Statistics. SOC Major Groups. Bureaou of Labor Statistics. https://www.bls.gov/soc/major_groups.htm. Accessed September 18, 2017.
- 18.US Census Bureau Special Projects Staff S. US Census Bureau Site North American Industry Classification System main page. https://www.census.gov/cgi-bin/sssd/naics/naicsrch?chart=2012. Accessed September 18, 2017.
- 19.NIOSH. CDC − National Occupational Research Agenda (NORA): Sectors. https://www.cdc.gov/niosh/nora/sectorapproach.html. Accessed September 18, 2017.
- 20.Arslan E, Orzan E. Audiological management of noise induced hearing loss. Scand Audiol Suppl. 1998;48:131–145. [PubMed] [Google Scholar]
- 21.Schein JD, Gentile A, Haase KW. Development and evaluation of an expanded hearing loss scale questionnaire. Vital Health Stat 2. 1970;37:1–42. [PubMed] [Google Scholar]
- 22.Gan WQ, Davies HW, Demers PA. Exposure to occupational noise and cardiovascular disease in the United States: the National Health and Nutrition Examination Survey 1999–2004. Occup Environ Med. 2010;68:183–190. [DOI] [PubMed] [Google Scholar]
- 23.Spiegelman D, Hertzmark E. Easy SAS calculations for risk or prevalence ratios and differences. Am J Epidemiol. 2005;162:199–200. [DOI] [PubMed] [Google Scholar]
- 24.Tak S, Calvert GM. Hearing difficulty attributable to employment by industry and occupation: an analysis of the National Health Interview Survey—United States, 1997 to 2003. J Occup Environ Med. 2008;50:46–56. [DOI] [PubMed] [Google Scholar]
- 25.Milia LD, Waage S, Pallesen S, Bjorvatn B. Shift work disorder in a random population sample–prevalence and comorbidities. PLoS ONE. 2013;8:e55306. [DOI] [PMC free article] [PubMed] [Google Scholar]
- 26.Mozumdar A, Liguori G. Occupational physical activity and the metabolic syndrome among working women: a Go Red North Dakota study. J Phys Act Health. 2011;8:321–331. [DOI] [PubMed] [Google Scholar]
- 27.Zhou Z, Xi Y, Zhang F, et al. Sedentary behavior predicts changes in cardiometabolic risk in professional workers: a one-year prospective study. J Occup Environ Med. 2016;58:e117. [DOI] [PubMed] [Google Scholar]
- 28.Janczura M, Bochenek G, Nowobilski R, et al. The relationship of metabolic syndrome with stress, coronary heart disease and pulmonary function-an occupational cohort-based study. PLoS ONE. 2015;10:e0133750. [DOI] [PMC free article] [PubMed] [Google Scholar]
- 29.Au CT, Lee FYF, et al. Association between leisure time physical activity, cardiopulmonary fitness, cardiovascular risk factors, and cardiovascular workload at work in firefighters. Saf Health Work. 2015;6:192–199. [DOI] [PMC free article] [PubMed] [Google Scholar]
- 30.Ruhm CJ. Bridge jobs and partial retirement. J Labor Econ. 1990;8:482–501. [Google Scholar]
- 31.Gan WQ, Moline J, Kim H, Mannino DM. Exposure to loud noise, bilateral high-frequency hearing loss and coronary heart disease. Occup Env Med. 2016;73:34–41. [DOI] [PubMed] [Google Scholar]
- 32.Bhatt JM, Lin HW, Bhattacharyya N. Epidemiology of firearm and other noise exposures in the United States. The Laryngoscope. 2017. [DOI] [PMC free article] [PubMed] [Google Scholar]
- 33.Okura Y, Urban LH, Mahoney DW, Jacobsen SJ, Rodeheffer RJ. Agreement between self-report questionnaires and medical record data was substantial for diabetes, hypertension, myocardial infarction and stroke but not for heart failure. J Clin Epidemiol. 2004;57:1096–1103. [DOI] [PubMed] [Google Scholar]
- 34.Tolonen H, Koponen P, Mindell JS, et al. Under-estimation of obesity, hypertension and high cholesterol by self-reported data: comparison of self-reported information and objective measures from health examination surveys. Eur J Public Health. 2014;24:941–948. [DOI] [PubMed] [Google Scholar]
- 35.Neitzel R, Daniell W, Sheppard L, Davies H, Seixas N. Comparison of perceived and quantitative measures of occupational noise exposure. Ann Occup Hyg. 2009;53:41–54. [DOI] [PubMed] [Google Scholar]
- 36.Reeb-Whitaker C, Seixas N, Sheppard L, Neitzel R. Accuracy of task recall for epidemiological exposure assessment to construction noise. Occup Environ Med. 2004;61:135–142. [DOI] [PMC free article] [PubMed] [Google Scholar]
- 37.Arena R, Guazzi M, Briggs PD, et al. Promoting health and wellness in the workplace: a unique opportunity to establish primary and extended secondary cardiovascular risk reduction programs. Mayo Clin Proc. 2013;88:605–617. [DOI] [PMC free article] [PubMed] [Google Scholar]


