Introduction
Fluorescence microscopy is a well-recognized technique for research in cell physiology and cell biology.1–9 Measurements of the fluorescence images of added fluorophores have been used to reveal the localization of proteins and movement of macromolecules during cellular processes, and to image the intracellular concentrations of Ca2+, CI−, and other ions.1–9 Most fluorescence microscopic measurements are performed as steady-state measurements. The steady-state fluorescence images can be difficult to interpret and quantify because there is no practical way to determine local concentrations of the probes in various regions of the sample. Moreover, most fluorophores photobleach rapidly, which further complicates the ability to use the intensity images quantitatively. As a result of these difficulties there have been extensive efforts to develop probes and imaging methods which are independent of the local intensity, such as the wavelength-ratiometric probes for Ca2+.10 In spite of extensive efforts, however, most currently useful ratiometric probes require UV excitation.11 Those probes which allow visible wavelength excitation, such as Calcium Green12 and Sodium Green13 (Molecular Probes, Eugene, OR), do not seem to display shifts of the excitation and/or emission wavelengths.
Advances in electronics, electrooptics, acoustooptics, and laser technology have now made possible a new type of imaging microscopy. Instead of fluorescence intensities, or intensity ratios, it is now possible to measure the fluorescence lifetime at each point in the image, a technique we call fluorescence lifetime imaging microscopy, or FLIM. Changes in the microenvironment, ion concentration, pH, etc., may have a drastic impact on the fluorescence lifetime even when there is only a minor influence on the optical spectra. The fluorescence lifetime (τ) is a molecular parameter defined as an inverse of the total rate of dynamic processes that cause deactivation from excited (mostly single S1) states. It is related to the fluorescence quantum yield η0 by the expression τ = η0/kr, where kr is the radiative deactivation parameter (τ = 1/kr, the radiative decay time). The radiative rate parameter kr is generally of intramolecular origin, with only a modest dependence on the local environment. The measured fluorescence lifetime τ is usually shorter than the radiative decay time,τr because of the presence of nonradiative decay rates which can also be dependent on intermolecular interactions, such as collisional quenching, energy transfer, binding to macromolecules, or binding of ions. Therefore, the fluorescence lifetime can be used as a probe of the microenvironment. Perhaps more importantly, the fluorescence lifetime is an intrinsic property of the system, in the sense that the lifetime is independent of the local probe concentration at each point in the sample. Consequently, the lifetime image should report on factors which affect the decay time (Ca2+, pH, etc.), and it should be independent of the amount of probe at each point in the image or the extent of photobleaching. Importantly, the use of lifetime imaging circumvents the needs for wavelength-ratiometric probes. Fluorophores that display a change in lifetime, regardless of whether they change in the excitation or emission spectra, are perfectly suitable for FLIM.
The advantage of eliminating the need for wavelength-ratiometric probes is best seen by the example of calcium indicators which display spectral shifts, such as Fura-2 and Indo-1, but require UV excitation. It would be desirable to image Ca2+ using longer wavelength excitation, where the laser sources are simpler and autofluorescence is less. However, the visible wavelength Ca2+ probes lz (Calcium Green, Orange, Crimson, Molecular Probes) do not display spectral shifts on binding Ca2+. In contrast, these probes do display useful changes in lifetime. 14 Hence, FLIM technology enables imaging of Ca2+ with visible wavelength light sources.
The rapid time scale of fluorescence emission imposes significant constraints on the methods for measuring the decays. The emission typically occurs on the picosecond to nanosecond time scale and can be a single-or multiexponential decay. Nanosecond fluorescence decay processes can give much insight into the nature of molecular interactions, and time-resolved measurements are widely utilized in biophysical, biochemical, and biomedical sciences.15–19 Such measurements are performed almost exclusively using ultrafast laser sources coupled with high-speed photodetectors. There are several methods available to measure excited state kinetics. The most common methods are time-correlated single-photon counting (TCSPC), which has been discussed in detail by O’Connor and Phillips, 2° and frequency-domain technique.21–23 Owing to the expense and complexity, time-resolved measurements are performed mostly as single-sample (single-pixel) measurements, Good accounts of such measurements are given elsewhere.15,16 Some parallel detection methods have been reported,24–26 but for wavelength or multifrequency rather than spatial resolution.
Since the first lifetime measurements under a microscope were carried in the early 1970s,27–29 little attention has been paid to time-resolved fluorescence microscopy (TRFM). The first techniques were developed using a flash lamp27 or nitrogen laser,28,29 and they used the pulse sampling method for time-resolved detection, Single-photon counting was used later.30–32 Advances in high-repetition lasers for pulse excitation, TCSPC, and frequency-domain methods have permitted more reliable fluorescence lifetimes to be obtained from microscopically portioned sections. Several groups have developed TRFM using argon ion-pulsed lasers,33,34 modelocked picosecond dye lasers,35–38 and the TCSPC technique. The frequency-domain technique also has been utilized for fluorescence microscopy.39,40 To increase temporal resolution as compared to the single-photon counting method, a picosecond streak camera was adopted to the microscopic system.41,42 Compared to the photon counting technique and frequency-domain methods, the streak camera exhibits the highest temporal performance; however, only a limited time range of detection can be examined.
An important point about all of these instruments is that fluorescence decays were measured more or less by conventional means on single points within a microscopic sample. Until 1991 no attempts were made to provide high-resolution images, where the contrast is determined by fluorescence decay kinetics. In some examples of time-resolved microscopy, gated detection was used to provide imaging of the intensity of the long-lived emission. It is of course possible to create fluorescence lifetime images by combining lifetime measurements and scanning techniques. For measurements of dynamic events, however, problems could arise owing to the long measurement time involved in measuring the lifetime at each pixel. Low photon counting rates result in long observation times for mapping two-dimensional (2D) samples. To increase the counting rate and reduce the measurement time, multiphoton43 and multichannel photon counting methods have been developed.44–46 However, neither technique provides the required temporal resolution to study cellular dynamics.
Several reviews on time-resolved microscopy in photobiology (not imaging) have been published.47,48 The most recent advances in TRFM with 2D imaging of fluorescence lifetimes involve high-speed 2D image detectors. Advances in image intensifier detector technology allow time gating as short as 400 psec.49 Some characteristics of available high-speed image intensifiers have been listed.50 Several different detection systems for creation of images based on the fluorescence lifetime have been already developed. A 2D microchannel plate photomultiplier with a position-sensitive resistive anode integrated with TCSPC circuitry51,52 or with a radiofrequency photon correlation system53 has been used. Another possibility of performing fluorescence lifetime imaging using pulsed methods has been shown by several groups.54–57 The basic concept of these methods are the same. The time-resolved intensity images are detected at various delay times after pulsed excitation. The lifetime images are generated using the simple ratio of two images,54 for rapid calculation, or using several time-resolved images and nonlinear least-squares analysis)55,57 The lifetime resolution has not yet been determined, but it is estimated about 1 nsec as 10% of the system response function (gate width).54,57 Fluorescence lifetime imaging using phase-modulation methods has been also developed.58–60 In this method the high-speed gated microchannel image intensifier is used as a phase-sensitive detector. The high-frequency modulation signal can be applied to the photocathode or to the microchannel plate of the image intensifier. The phase angle and modulation of fluorescence can be determined using homodyne58,59 or heterodyne techniques.60 A comprehensive review of some of currently developed FLIM techniques with respect to lifetime resolution, formation of 2D images, and measurement time has been published.50
In this chapter we describe an apparatus which allows lifetime imaging with simultaneous measurement at all positions in the image. This method uses a gain-modulated image intensifier, which converts the time-dependent image data to a steady-state “phase-sensitive” image, which is quantified using a slow-scan CCD (charge-coupled device) camera. By the use of several phase-sensitive images, collected with various electronics delays, it is possible to calculate the lifetime image of the object. This method of lifetime imaging has been evaluated using macroscopic samples where the data were compared with standard lifetime measurements.14,61–63 This method has been already proved practical by obtaining Ca2+ lifetime images of cells loaded with a fluorescent calcium indicator such as quin-2.64
Phase-Sensitive Image Detection
In our apparatus the fluorescence of the two-dimensional sample is excited by the intensity-modulated laser light at circular frequency ω and modulation degree mE:
| (1) |
The sinusoidally modulated emitted fluorescence is phase-shifted and partially demodulated relative to the excitation:
| (2) |
where F0(r), mF(r), and θF(r) are the time-averaged spatially dependent fluorescence intensity, modulation, and phase angle, respectively. The phase angle θF(r) and the fluorescence modulation degree mF(r) depend on the lifetime at each position r and on the light modulation frequency:
| (3) |
| (4) |
where τp(r) and τm(r) are apparent phase and modulation lifetimes at each position r.
For a single-exponential decay, phase and modulation lifetimes are equal and independent of modulation frequency. Generally, however, the emission kinetics are more complicated, and the intensity decays are mostly multiexponential or nonexponential, especially in polymers and biological systems. For a multiexponential decay, generally τp < τm, and both decrease with an increase of modulation frequency. The heterogeneity is considered to indicate the existence of many microscopically different environments in which the fluorophore is located. In this case resolution of the intensity decay law from the phase shift (θ) and modulation (m) data requires multifrequency measurement.65–67 In FL1M experiments the essential information is contained in the position-dependent phase and/or modulation of the emission.
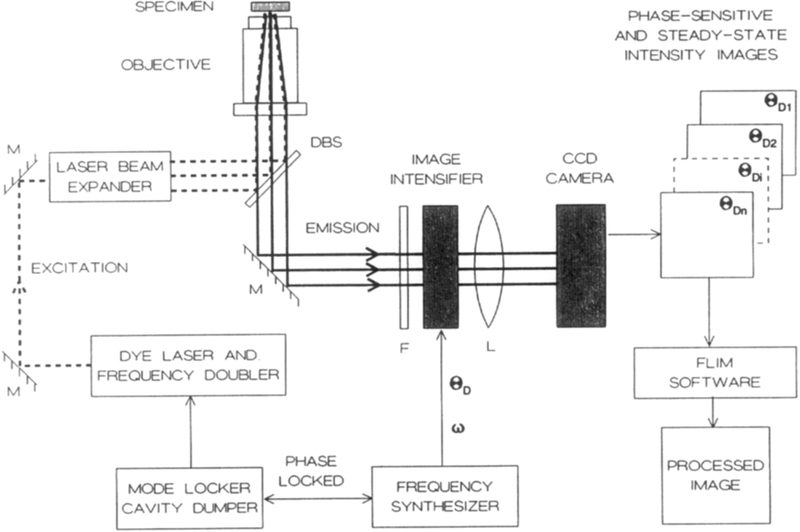
A gain-modulated high-speed gated image intensifier can be used as an optical 2D phase-sensitive detector. The fluorescence phase angle and modulation at each position r can be obtained from a series of phase-sensitive images. A schematic diagram of the instrumentation for FLIM using homodyne phase-sensitive detection is shown in Fig. 1. The photocathode of the image intensifier converts the light image to an electron image, which is intensified by the microchannel plate (MCP) and reconverted to an optical image on the phosphor screen and recorded using a slow-scan CCD camera. The voltage between the photocathode and microchannel plate input surface is varied at the desired frequency (limited by the time gate of the image intensifier). The electronic gain is varied at a modulation frequency equal to the light modulation frequency or a harmonic of the pulse rate. This gain modulation signal is applied to the photocathode of the image intensifier, resulting in a time-varying gain G(t), with
| (5) |
where mD is the gain modulation degree and θD is the detector phase angle relative to the excitation phase angle. The time-dependent photocurrent [Eq. (2)] is multiplied with the time-dependent varying gain [Eq. (5)], resulting in a dc signal and high-frequency signals. However, owing to the slow time response of the image intensifier screen (~1 msec), the high-frequency signals are averaged at the output screen. The time-averaged phase-sensitive intensity from the corresponding position r is given by
| (6) |
Fig. 1.
Instrumentation for fluorescence lifetime imaging microscopy. The excitation is presently the frequency-doubled output of a pyridine-1 dye laser, which is synchronously pumped by a mode-locked Nd:YAG (neodymium:yttrium-aluminum-garnet) laser and cavity dumped at 3.81 MHz. The excitation light is expanded by a Newport LC075 (10×) laser beam expander. A Nikon Diaphot-TMD inverted fluorescence microscope is equipped with a Nikon Fluor 40×, NA 1.3 objective and DM400 Nikon dichroic beam splitter (DBS). The gated image intensifier (Varo 510-5772-310) is positioned between the target and the CCD camera. The gain of the image intensifier is modulated using the output of a PTS 300 synthesizer with digital phase shift option. The detector is a CCD camera (Photometrics, series 200, thermoelectrically cooled PM 512 CCD).
The phase-sensitive intensity at each position r depends on the gain modulation of the detector mD, the modulated amplitude of the emission m(r), and the cosine of the phase angle difference between the gain modulation signal θD and the phase of the emission θ(r). The phase-sensitive intensity images have constant intensity at each position r, where values depend on the concentration of fluorophore c(r) and lifetime τ(r). A value of θD = 0 results in maximum intensity for a zero lifetime [θ(r) = 0], that is, scattered light. This procedure is analogous to the method of phase-sensitive or phase-resolved fluorescence.68,69 However, the earlier measurements of phase-sensitive fluoroscence were performed electronically on the heterodyne low-frequency cross-correlation signal, whereas here homodyne detection is performed electrooptically on the high-frequency modulated emission. Homodyne phase-sensitive detection of fluorescence was first reported by Veselova and co-workers.70,71
It is not possible to calculate the fluorescence phase angle θ(r) or modulation m(r) images from the single phase-sensitive image. However, the phase angle and modulation of fluorescence can be determined from a series of phase-sensitive images by varying the phase angle of the detector, θD [Eq. (6)]. This can be accomplished by a series of electronic delays61–63 or by using the digital phase shift option of the synthesizer.14,64
The phase-sensitive intensity images can be collected using a slow-scan CCD camera. There are many advantages of using slow-scan cooled CCD cameras, such as high resolution, high sensitivity, wide dynamic range, photometric accuracy, geometric stability, and capability of directly integrating the image. The properties of such CCD cameras and their applications are described elsewhere in detail.72–76
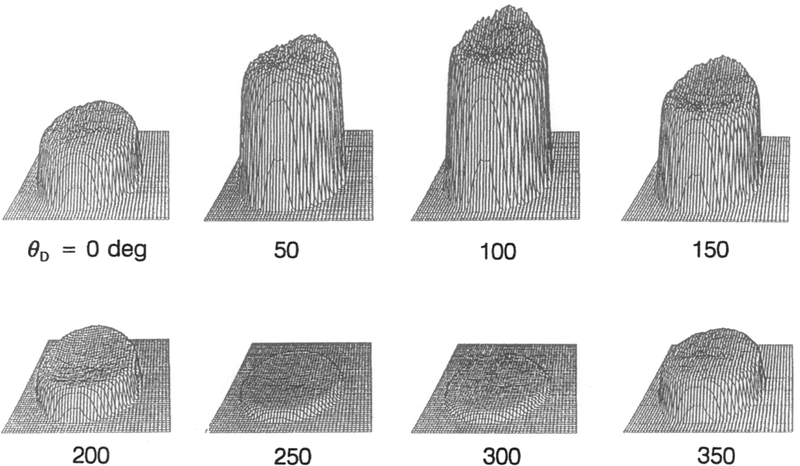
In our measurements we have collected a series of phase-sensitive intensities in which θD was varied over 360°. In Fig. 2 are shown a series of phase-sensitivity images of the standard fluorophore p-bis[2-(5-phenyloxazazolyl)]benzene (POPOP) in propylene glycol between two glass coverslips obtained using the instrumentation described in Fig. 1. Phase-sensitive images in Fig. 2 contain information about the decay time of the fluorescence at each position. In this case fluorescence decay times are similar throughout the image because a uniform sample was used. The maximum (in phase) is at about θD = 100° and the minimum (out of phase) between 250° and 300°. The fluorescence phase angle is related to the detector phase θD, which includes a constant instrumental phase shift θ1 (electronic and optical pathways). Similarly, the fluorescence modulation is affected by instrumental modulation m1. To determine the instrumental phase angle and modulation, which are need to calculate the apparent lifetimes [Eqs. (3) and (4)], a reference sample is required, either scattered light or standard fluorophore at known phase and modulation.
Fig. 2.
Phase-sensitive intensity images of the fluorescence standard POPOP obtained at a modulation frequency of 49.53 MHz using the instrumentation described in Fig. 1.
Algorithm for Calculation of Phase Angle and Amplitude Images
The data sets for FLIM are rather large (in our case, 512 × 512 pixels, resulting in about 520 kbyte storage per each image) which can result in time-consuming data storage, retrieval, and processing. To allow rapid calculation of images we developed an algorithm which uses each phase-sensitive image only one time. The task is to use a set of images taken at different detector phase angles (Fig. 2) and generate three images. The first of these desired images is of the phase of the fluorescence, θ(r) in Eq. (6). The second is an image of the modulated amplitude of the fluorescence at the particular detector modulation frequency [i.e., the ac component or m(r) in Eq. (6)]. The third is an image of the steady-state or dc component of the fluorescence.
For an ideal set of data this task would simply require a numerical Fourier transform for each of 262,144 pixels in the images. However, the statistically valid use of a numerical Fourier transform requires an odd number (>2) of images at detector modulation phase angles equally spaced within each period of the primary modulation frequency. For the numerical integration of the Fourier transform to have a reasonable precision the number of data images must be significantly larger than three. The method of inducing the detector phase shifts using electronic delays via cables precludes easily satisfying these requirements. However, such equally spaced phase shifts are now practical using the digital phase shift option of a frequency synthesizer. Because of these requirements we did not use a classic numerical Fourier transform.
We transformed the data images into the desired images by performing a least-squares fit for each of the 262,144 pixels in the images. These fits could be performed with a fitting function of the form of Eq. (6). However, use of Eq. (6) requires a significant amount of computer time since it is a nonlinear equation in the fitting parameters m(r) and θ(r). Estimating nonlinear parameters by least-squares requires an iterative solution of a system of simultaneous equations. These simultaneous equations must be reevaluated from the data images for each step of the iterative process. Thus, the use of Eq. (1) will require a large amount of computer time and memory. We therefore used an alternative form of Eq. (6):
| (7) |
The advantage of Eq. (7) is that it is a linear equation, and thus the parameter estimation process requires only a single iteration.
Once the values of a0(r), al(r), and b1(r) are determined for a particular pixel, then the corresponding values of the fluorescence phase [θA(r)] and modulated amplitude [mA(r)] are determined by
| (8) |
| (9) |
The process of evaluating a0(r), a1(r), and b1(r) for each pixel simply involves the solution of a standard matrix equation Ax = B [Eqs. (10)–(12)] for x by Cramer’s rule. In this matrix equation A is a Hessian matrix:
| (10) |
| (11) |
| (12) |
The subscript i in Eqs. (10)–(12) refers to one of the N data images at a particular detector phase shift. We find that a reasonable number of images is about 10, so that the determined parameters are almost orthogonal. Ten images is also enough to smooth out the consequences of the experimental uncertainties that are contained in the data images.
The matrix A is not dependent on the individual pixel values within the data images, rather only on the detector phase used to obtain the individual data images (if all the pixels are used, see below). Only the vector B needs to be reevaluated for each pixel to evaluate a0(r), a1(r), and b1(r) at each pixel. The a0(r), a1(r), and b1(r) images are transformed into images of the arbitrary (A) fluorescence phase [with Eq. (8), Fig. 3, middle] and modulation [with Eq. (9), Fig. 3, right]. These arbitrary phase angles and modulations are then transformed to absolute values by use of the known phase and/or modulation within the calculated image or compared to the images of the standard fluorophore (reference). The phase image is subsequently transformed into a lifetime image by Eq. (3), and a modulation lifetime image is obtained using Eq. (4).
Fig. 3.
Processed images: intensity (left), phase angle (middle), and modulation (right).
The method we have outlined is algebraically identical to a numerical Fourier transform if we have a large and odd number of data images equally spaced in time (or phase) within each period, If these requirements are not met the method that we have outlined provides the phase and amplitude images with the highest probability of being correct based on the data. If these requirements are not met, the numerical Fourier transform will not necessarily provide the images with the highest probability of being correct.
The method that we have outlined retains most of the orthogonal properties of Fourier transforms. The off-diagonal elements of the A matrix will approach zero as the number of data images increases. The off-diagonal elements of the A matrix are exactly zero when the requirements for a classic Fourier transform are satisfied. When these off-diagonal elements are zero the determined parameters are orthogonal by definition. A consequence of this near orthogonality is that the parameters can, to a first approximation, be determined independently. This means that we can correctly determine the properties of the primary Fourier component by this method without needing to consider, or evaluate, the higher order Fourier components that might be present in the data. In more recent experiments and computations we have found it desirable to eliminate low-intensity pixels from the computation, which removes some artifactual structure in the FLIM images. The procedure outlined in Eqs. (7)–(12) is still advantageous by avoiding nonlinear least-squares computations. Furthermore, if one image (or pixel) is removed, the classic Fourier transform method will not work.
Corrections of Phase and Modulation Images
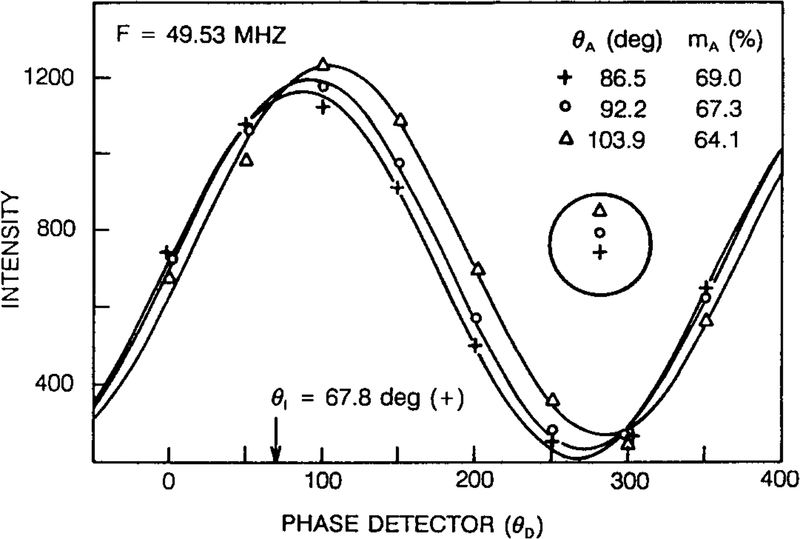
To obtain correct (true) fluorescence phase and modulation images, it is necessary to correct for a constant instrumental phase shift θ1 and modulation m1, and for the nonideal response of the image intensifier. To correct the instrumental phase shift (θI) and modulation (ml), the calculated phase angle [θA(r)] and modulation [mA(r)] images need to be compared with known values (reference). To quantify the effects of position-dependent responses of the 2D detector we subjected homogeneous solutions of the fluorescence standard (POPOP in propylene glycol) as thin layer between two glass coverslips to fluorescence microscopy (Fig. 1). The observed phase and modulation images of the fluorescence standard reveal that the response of the image intensifier depends on the position on its photocathode. This is illustrated in Fig. 4 which shows that the phase angles decrease from the periphery (103.9°) to the central region (86.5°) of the photocathode. This effect is present because the effective phase angle θD is delayed in the central region relative to the periphery of the photocathode owing to the time delay for the modulating voltage to migrate across the photocathode. This results in an “iris effect” of phase according Eq. (6). The phase “iris effect” is related to the gating time of the image intensifier and the modulation frequency applied to its photocathode.
Fig. 4.
Position dependence of the phase and modulation of the photocathode of the image intensifier. Average phase-sensitive intensities at three different positions are plotted versus the phase angle applied to the detector. The calculated values of phase angle and modulation [Eq. (6)] contain the instrumental phase angle shift θ1 and modulation ml.
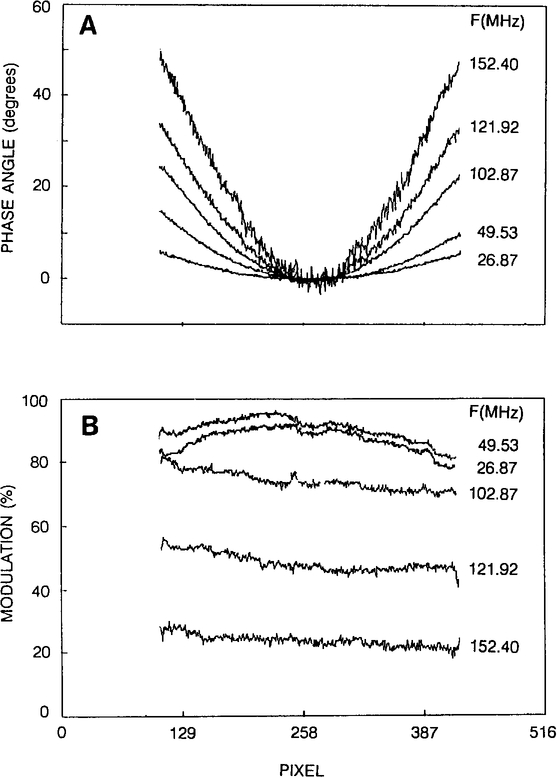
Figure 5 presents experimental data for five modulation frequencies using an image intensifier with a specified 5-nsec time gate. For clarity, only relative phase angles are presented across the photocathode (normalized to 0 at the center, Fig. 5, A). The position-dependent relative modulations (normalized to τm = 0, Fig. 5B) show slightly decreasing values from one side of photocathode to other. In this case, however, the dependence cannot be easily explained in terms of transit-time effects. It is likely that the modulation position dependence results from internal properties of the image intensifier. The modulation decreases with higher modulation frequency, which is related to the minimum value of the gating time of image intensifier. For this type of image intensifier (5-nsec time gate) the practical modulation frequencies are up to 150 MHz (m ≅ 10–20% and ~60° spatial phase difference).
Fig. 5.
Position-dependent phase (A) and modulation (B) across the photocathode of the image intensifier at various modulation frequencies.
The phase and modulation corrections (electronic and position-dependent) can be done simultaneously. The FLIM experiment requires two sets of phase-sensitive images under identical experimental conditions, typically for 8–10 images at varying θD over 360°. The first set contains the spatially lifetime homogeneous fluorescence standard (R) as a reference, and the second is for the sample (S). The phase-sensitive images should be corrected by subtraction of the background (dark) image, yielding
| (13) |
| (14) |
In Eqs. (13) and (14), IR(r) and IS(r) represent intensity profiles of the fluorescence standard and the sample, respectively. The intensity profiles depend on the concentration of fluorophores [C(r)], uniformity of illumination by excitation light, and other optical factors. The apparent modulations at each position, r, are mR(r) = B(r)/A(r) and mA(r) = b(r)/a(r). The phase and modulation images of the fluorescence standards similar to those in Fig. 3 can be used to obtain corrected phase and modulation images of the sample.
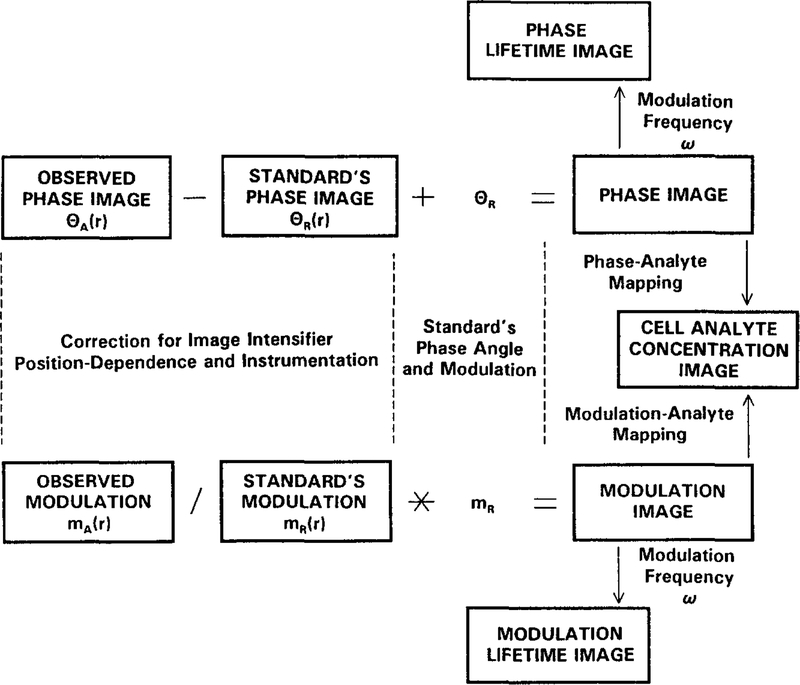
This procedure is illustrated schematically in Fig. 6. The phase angle image of the standard, 0R(r), is related to the phase angle of the standard θR by
| (15) |
where θD(r) is the detector position-dependent phase angle image. The observed phase angle image θA(r) of the sample is given by
| (16) |
where θ(r) is the true fluorescence phase angle. Hence, the desired phase angle image of the sample is given by
| (17) |
The corrected modulation image can be obtained similarly, but one must remember that the modulation appears as a product. Hence, the modulation image of the standard is given by
| (18) |
where mI is the instrumental factor (dependent on modulation frequency and depth of gain modulation), mR is the modulation of the standard, and mD(r) is the detector position-dependent image. The observed modulation of the sample is given by
| (19) |
where m(r) is the true fluorescence modulation image. Hence, the desired modulation image is given by
| (20) |
Fig. 6.
Procedure for correcting for the position-dependent phase and modulation of the image intensifier and the lifetime of the standard fluorophore.
The portion of these expressions [Eqs. (17)–(20)] for correcting for the phase (θR) and modulation (mR) of the standard are analogous to those described previously for frequency-domain lifetime standards.77 Once the phase and modulation images are known, they are easily transformed into phase (τp) and modulation (τm) lifetimes using Eqs. (3) and (4). The phase and modulation images can also be mapped to other parameters using an appropriate calibration curve.78,79 The latter can be used for lifetime-based sensing in two-dimensional samples to distinct regions with different environmental properties (different concentrations of ions, oxygen, etc.).
Intracellular Calcium Concentration Imaging
We used COS cells (from African Green monkey kidney epithelium) to work out the technical requirements for FLIM imaging in a cellular system. The COS cells were used in these experiments because the cells are relatively flat in terms of biological architecture, easy to grow, and adhere moderately well to glass surfaces. The cells were loaded with the calcium probe quin-2 by exposure to quin-2 AM. The fluorescence lifetime of quin-2 is strongly dependent on Ca2+.63,80,81 The calcium-induced change in the lifetime of quin-1 results in dramatic changes in phase angle and modulation versus free calcium concentration in the range from 0 to 600 nM.63 Phase-sensitive images were collected using instrumentation described in Fig. 1 at modulation frequency 49.53 MHz.
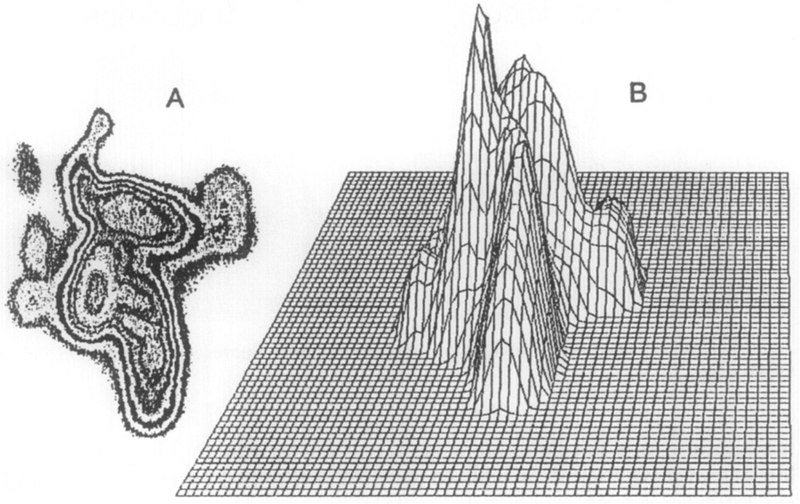
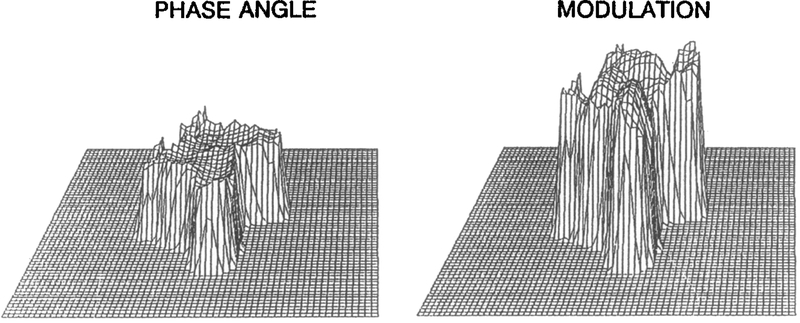
The fluorescence intensity image (Fig. 7A) shows the area, shape, and orientation of the COS cell (or cell clusters). Figure 7B shows that the local intensity varies dramatically throughout the cell. The phase angle and modulation images (Fig. 8) display relatively constant values throughout the cell, suggesting that the Ca2+ concentration is uniform. This constancy is in agreement with the result of ratiometric imaging in diverse cells.82 The calcium concentrations determined from phase angles and/or modulations are not dependent on the intensity signal. The variations in intensity image (Fig. 7) are due to the different quin-2 concentrations and/or different thicknesses of the cell. As expected in phase-modulation fluorometry, the modulation image varies inversely from the phase image, as is clearly seen in Fig. 8. The use of both the phase and modulation information is likely to increase the accuracy and range of the FLIM technique. More detailed information about these cellular imaging experiments has been reported elsewhere.64
Fig. 7.
Fluorescence intensity images of quin-2 in a COS cell. (A) Area, shape, and orientation of the cell; (B) intensity variation throughout the cell.
Fig. 8.
Phase angle and modulation images of quin-2 fluorescence in a COS cell at 49.53 MHz.
Phase Suppression Imaging
Creation of a lifetime image requires considerable data collection and image processing. This is because of the nature of the technological challenge and because we choose in our initial experiments to use “complete” data sets which in fact overdetermine the answer. However, one can imagine many circumstances where it is desirable to obtain less resolved images more quickly, or with less demand for computational speed. For example, one can collect only two images, with a θD difference of 90°, and calculate the phase angle image, or phase lifetime image, from the ratio of the two images. Alternatively, one may be interested in quickly identifying regions of the cell where the lifetime exceeds some threshold value. The phase-modulation imaging method is unique in this regard. By selection of two detector phase angles one can eliminate the contribution of (suppress) any desired lifetime. Then only regions of longer (or shorter) lifetime appear as positive values in the difference image.
Suppose two phase-sensitive images are collected with detector phase angles of θD and θD + Δ. According to Eq. (6) the phase sensitive intensities are given by
| (21) |
| (22) |
The difference (I2 −I1) phase-sensitive image is given by
| (23) |
Using cos(α − β) = cos α cos β + sin α sin β, one obtains
| (24) |
The intensity in the difference image is zero when
| (25) |
In Eq. (25) we have defined θS to be the phase angle at which ΔI = 0. Rearrangement yields
| (26) |
Using 1 – cos α = 2 sin2(α/2) and sin(α) = 2 sin(α/2) cos(α/2) yields
| (27) |
or
| (28) |
The suppressed lifetime is given by
| (29) |
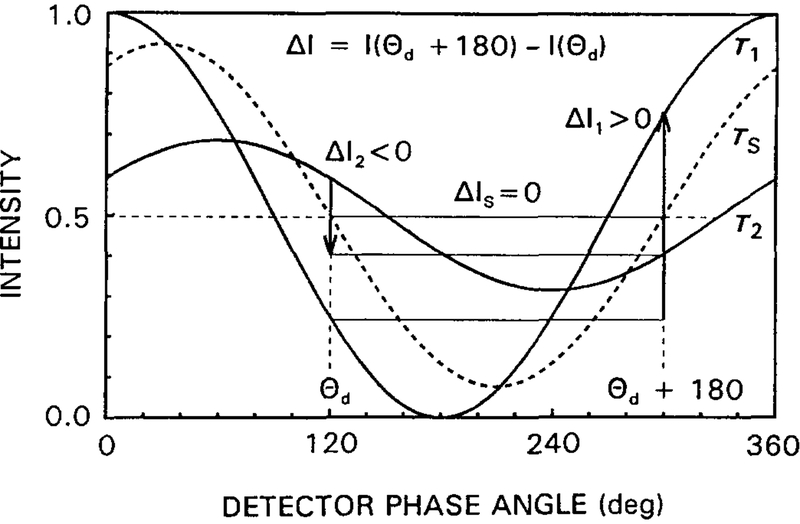
The concept of phase suppression is shown schematically in Fig. 9 where the detector phase angle θD difference between two phase-sensitive images is 180°. The suppressed component (τs) has equal phase-sensitive intensities at θD and θD + 180°.
Fig. 9.
Intuitive description of phase suppression. In a difference image with ΔI = I(θD + 180°) − I(θd), a component with τ = τS is completely suppressed (ΔIS = 0). Components with longer lifetimes (τ2) appear as negative values (ΔI2 < 0), and those with shorter lifetimes (τ1) appear to be positive (ΔI1 > 0).
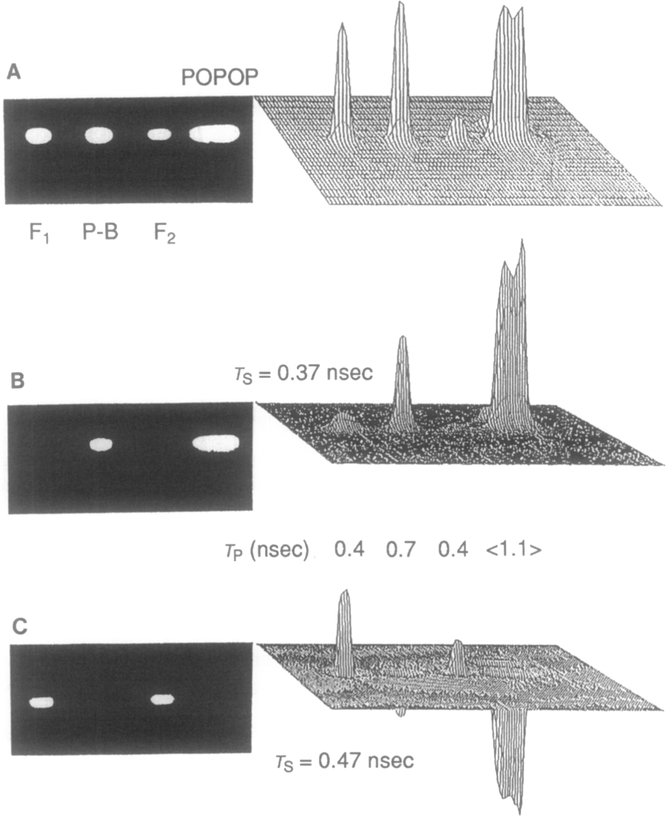
The example of using difference images to suppress the emission of protein-bound or free NADH is shown in Fig. 10. The experiment was performed on macroscopic objects.62 We used a row of four cuvettes, two with free NADH at different concentrations, one with NADH bound to dehydrogenase, and one with POPOP as a standard fluorophore (reference). The cuvettes were placed to obtain images close to the center of the photocathode to minimize the effect of position-dependent time delay of image intensifier (see below). Figure 10A shows the nonprocessed phase-sensitive image, in which all samples appear with nonzero intensity. In Fig. 10B the emission with a lifetime of 0.37 nsec, close to that of free NADH, is suppressed, revealing a positive peak for protein-bound NADH between two free NADH samples. Also shown are the gray-scale images in which only the positive regions are shown as nonzero. Similarly, in Fig. 10C the emission with a lifetime of 0.47 nsec is suppressed, revealing two positive images for free NADH on either side of the central sample of bound NADH, which appear as negative regions in the image.
Fig. 10.
Phase-suppressed images of free and protein-bound NADH. (A) Phase-sensitive intensity image of samples (F1 and F2, NADH free; P-B, NADH bound to protein; POPOP, standard fluorophore used for lifetime calculation). (B) Difference image with a suppressed lifetime of 0.37 nsec. (C) Difference image with a suppressed lifetime of 0.47 nsec.
We note that the phase suppression as described above is only an approximation owing to the position-dependent response of the image intensifier. Because the phase angle of the image intensifier is position-dependent (Fig. 5) the suppressed lifetime is also position-dependent. This effect needs to be considered for high modulation frequencies or when imaging the central and side region of the image intensifier simultaneously. The observed suppressed phase angle is given by
| (30) |
Using tan(α + β) = (tan α + tan β)/(1 - tan α tan β), the position-dependent supressed lifetime is given by
| (31) |
where τD(r) = ω−1 tan θD(r) and to is the modulation frequency. The value of τD(r) is related to the time gate and the distance r from the center of the photocathode of the detector. For an image intensifier (with a manufacturer-specified 5-nsec time gate) at the distance of r ≅ 0.9RD (RD is the radius of photocathode), the % is about 0.75 nsec for frequencies from 26 to 122 MHz (from Fig. 5). For moderate frequencies (up to 100 MHz) Eq. (31) may be simplified to
| (32) |
A negligible effect of τD(r) is expected if higher speed image intensifiers are used; for example, for a time gate of 400 psec the expected maximum value τD at distance of 0.9 RD is about 60 psec (assuming the same relation between time gate and τD as for our image intensifier with a 5-nsec time gate).
Summary
In the previous sections we demonstrated imaging of intracellular Ca2+ using our approach to FLIM. What other analytes can be imaged using FLIM? We have now characterized the lifetime of a good number of ion indicators.78,83–86 Based on these studies we know that Cl− can be imaged using FLIM with probes such as SPQ or MQAE,87 pH can be imaged using resorufin88 as and probes of the SNAFL and SNARF (Molecular Probes) series,84 and Mg2+ can be imaged using Magnesium Green,85 Magquin-2, or Mag-quin-189 (Molecular Probes). At present, the probe for K+, as PBFI, are just adequate as a lifetime probe,78 but it seems likely that newer probes for Na+ (Sodium Green13) and K+ will be practical for effective imaging. Of course, imaging of oxygen is possible using a wide variety of fluorophores.90–92
It should be noted that a wide variety of substances and/or phenomena are known to alter decay times, acting as quenchers. These include the phenomena of resonance energy transfer, collisional quenching, temperature effects, and viscosity effects. Also, the FLIM method is not limited to microscopic objects but can be possibly used in remote imaging of any object. Hence, FLIM will allow the imaging of the chemical and physical properties of objects based on the effects of the local environment on the decay kinetics of fluorophores.
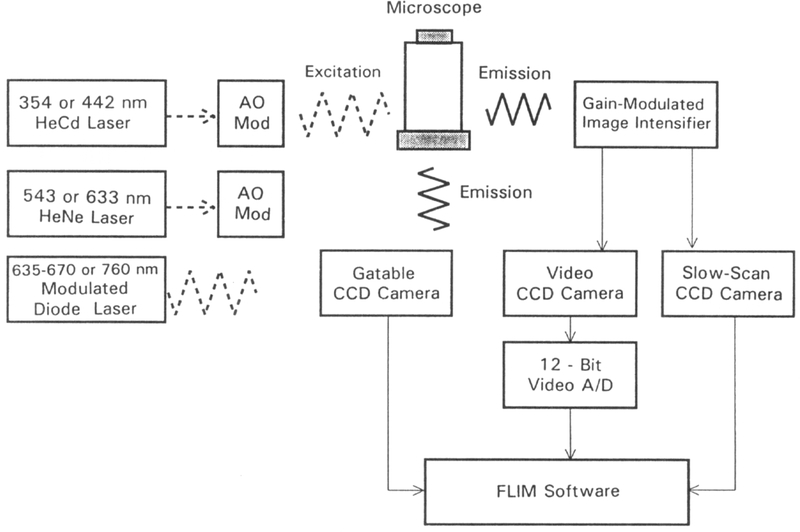
The instrumentation for FLIM is presently complex and requires a moderately complex laser source, a gain-modulated image intensifier, and a slow-scan CCD camera. However, one can readily imagine the instrumentation becoming rather compact, and even all solid-state, owing to advances in laser and CCD technologies and, more importantly, advances in probe chemistry. To be specific, the dye laser shown in Fig. 1 may be replaced by a simpler UV laser, such as the 354 nm HeCd laser which has become available (Fig. 11). Intensity modulation of a continuous wave sources can be accomplished with acoustooptic modulators.
Fig. 11.
Possible future FLIM instrument configurations.
The scientific slow-scan CCD cameras are presently rather expensive, but they are used in the present instrumentation because of their linearity and high dynamic range. However, the increasing use of CCD detectors suggest that even the scientific-grade CCD cameras will soon become less costly. Additionally, the frame rates of these detectors continue to increase in response to the need for faster imaging. Furthermore, the performance of the video CCD cameras is increasing, as seen by the introduction of 10-bit video analog-to-digital (A/D) converters.
It is difficult to propose a final design for the FLIM computational system because of the frequent introduction of faster computers. Most image processing hardware and software are designed for use with video cameras and 8-bit data. In FLIM it will be advantageous to use the highest practical dynamic range of the CCD, in order to allow lifetimes to be calculated for the greatest range of intensities.
Finally, we note that it should be eventually possible to eliminate the image intensifier, which is a delicate device requiring high voltage. A report has appeared93 describing a gatable CCD. Although the CCD gating time near 50 nsec is presently too slow for imaging nanosecond decay times, it seems probable that the temporal performance of such devices will increase. Alternatively, one can imagine the use of longer lifetime fluorophores, such as the lanthanide chelates94,95 or ruthenium-ligand complexes.92 Using the technology and probes described above it should be possible to construct robust and inexpensive instrumentation for FLIM (Fig. 11), which will enable the use of lifetime imaging in the engineering, physical, and biological sciences.
References
- 1.Wang and Taylor DL (eds.), “Fluorescence Microscopy of Living Cells and Culture, Part A: Fluorescent Analogues, Labelling Cells, and Basic Microscopy.” Academic Press, New York, 1989. [Google Scholar]
- 2.Taylor DL and Wang Y (eds.), “Fluorescence Microscopy of Living Cells and Culture, Part B: Quantitative Analogues, Microscopy-Imaging, and Spectroscopy.” Academic Press, New York, 1989. [Google Scholar]
- 3.Inoune S, “Video Microscopy.” Plenum, New York, 1989. [Google Scholar]
- 4.Herman B and Jacobson K (eds.), “Optical Microscopy for Biology.” Wiley-Liss, New York, 1990. [Google Scholar]
- 5.Kohen E, Ploem JS, and Hirschberg JG (eds.), “Cell Structure and Function by Microspectrofluorometry.” Academic Press, New York, 1989. [Google Scholar]
- 6.Agard DA, Annu. Rev. Biophys. Bioeng 13, 191(1984). [DOI] [PubMed] [Google Scholar]
- 7.DeWeer P and Salzberg BM (eds.), “Optical Methods in Cell Physiology.” Wiley, New York, 1986. [Google Scholar]
- 8.Taylor DL, Waggoner AS, Murphy RF, Lanni F, and Birge RR (eds.), “Applications of Fluorescence in the Biomedical Sciences.” Alan R. Liss, New York, 1986. [Google Scholar]
- 9.Cherry J (ed.), “New Techniques in Optical Microscopy and Spectrometry.” Macmillan, London, 1991. [Google Scholar]
- 10.Grynkiewicz G, Poenie M, and Tsien RY, J. Biol. Chem 260, 3440(1985). [PubMed] [Google Scholar]
- 11.Moore EDW, Becker PL, Fogarty KE, Williams DA, and Fay FS, Cell Calcium 11, 157(1990). [DOI] [PubMed] [Google Scholar]
- 12.Haugland RP, “Molecular Probes Handbook of Fluorescent Probes and Research Chemicals.” Molecular Probes, Inc., Eugene, Oregon, 1992-1994. [Google Scholar]
- 13.Bioprobes 17, Molecular Probes, Inc., Eugene, Oregon, June 1993. [Google Scholar]
- 14.Lakowicz JR, Szmacinski H, and Johnson ML, J. Fluoresc 2, 47(1992). [DOI] [PMC free article] [PubMed] [Google Scholar]
- 15.Lakowicz JR, “Principles of Fluorescence Spectroscopy.” Plenum, New York, 1983. [Google Scholar]
- 16.Demas JN, “Excited State Lifetime Measurements.” Academic Press, New York, 1983. [Google Scholar]
- 17.Dewey TG (ed.), “Biophysical and Biochemical Aspects of Fluorescence Spectroscopy.” Plenum, New York, 1991. [Google Scholar]
- 18.Lakowicz JR (ed.), “Time-Resolved Laser Spectroscopy in Biochemistry II” (Proc. SPIE 1204). SPIE Press, Bellingham, Washington, 1990. [Google Scholar]
- 19.Lakowicz JR (ed.), “Time-Resolved Laser Spectroscopy in Biochemistry III” (Proc. SPIE 1640). SPIE Press, Bellingham, Washington, 1992. [Google Scholar]
- 20.O’Connor DV and Phillips D, “Time-Correlated Single Photon Counting.” Academic Press, New York, 1984. [Google Scholar]
- 21.Gratton E and Limkeman M, Biophys. J 44, 315(1983). [DOI] [PMC free article] [PubMed] [Google Scholar]
- 22.Lakowicz JR and Maliwal BP, Biophys. Chem 21, 61(1985). [DOI] [PubMed] [Google Scholar]
- 23.Laczko G, Lakowicz JR, Gryczynski I, Gryczynski Z, and Malak H, Rev. Sci. lnstrum 61, 2331(1990). [Google Scholar]
- 24.Gratton E, Feddersen B, and van de Ven M, Proc. SPIE 1204, 21(1990). [Google Scholar]
- 25.Birch DJ, Suhling K, Holmes AS, Dutch AD, and Imhof RE, Proc. SPIE 1204, 26(1990). [Google Scholar]
- 26.Mitchell GW and Swift K, Proc. SPIE 1204, 270(1990). [Google Scholar]
- 27.Loeser CHN, Clark E, Maher M, and Tarkmeel H, Exp. Cell Res 72, 480(1972). [DOI] [PubMed] [Google Scholar]
- 28.Sacchi CA, Svelto O, and Prenna G, Histochem. J 6, 251(1974). [DOI] [PubMed] [Google Scholar]
- 29.Docchio F, Ramponi R, Sacchi CA, Bottiroli G, and Freitas I, J. Microsc 134, 151(1984). [DOI] [PubMed] [Google Scholar]
- 30.Kinoshita K Jr., Mitaku S, Ikegami A, Ohbo N, and Kunii TL, Jpn. J. Appl. Phys 15, 2433(1976). [Google Scholar]
- 31.Herman BA and Fernandez SF, J. Cell. Physiol 94, 253(1978). [DOI] [PubMed] [Google Scholar]
- 32.Arndt-Jovin DJ, Latt SA, Striker G, and Jovin TM, J. Histochem. Cytochem 27, 87(1979). [DOI] [PubMed] [Google Scholar]
- 33.Schneckenburger H, Reuter BW, and Schoberth SM, Anal. Chim. Acta 163, 249(1984). [Google Scholar]
- 34.Minami T, Kawahigashi M, Sakai Y, Shimamoto K, and Hirayama S, J. Lumin 35, 247(1986). [Google Scholar]
- 35.Rodgers MAJ and Firey PA, Photochem. Photobiol 42, 613(1985). [DOI] [PubMed] [Google Scholar]
- 36.Schneckenburger H, Pauker F, Unsöld E, and Jocham D, Photobiochem. Photobiophys 10, 61(1985). [Google Scholar]
- 37.Ramponi R and Rodgers MAJ, Photochem. Photobiol 45, 161(1987). [DOI] [PubMed] [Google Scholar]
- 38.Keating SM and Wensel TG, Biophys. J 59, 186(1991). [DOI] [PMC free article] [PubMed] [Google Scholar]
- 39.Murray JG, Cundall RB, Morgan CG, Evans GB, and Lewis C, J. Phys. (E) Sci. Instrum 19, 349(1986). [Google Scholar]
- 40.Verkman AS, Armijo M, and Fushimi K, Biophys. Chem 40, 117(1991). [DOI] [PubMed] [Google Scholar]
- 41.Scheckenburger H, Frenz M, Tsuchiya Y, Denzer U, and Schleinkafer L, Lasers Life Sci. 1(4), 299(1987). [Google Scholar]
- 42.Kusumi A, Tsuji A, Murata M, Sako Y, Yoshizawa AC, Kagiwada S, Hayakawa T, and Ohnishi S, Biochemistry 30, 6517(1991). [DOI] [PubMed] [Google Scholar]
- 43.Pauker F, Schneckenburger H, and Unsöld E, J. Phys. (E) Sci. lnstrum 19, 240(1986). [Google Scholar]
- 44.Iwata T, Uchida T, and Minami S, Appl. Spectrosc 39, 101(1985). [Google Scholar]
- 45.Wang XF, Kitajima S, Uchida T, Coleman DM, and Minami S, Appl. Spectrosc 44, 25(1990). [Google Scholar]
- 46.Wang XF, Tsuji T, Uchida T, and Minami S, Proc. SPIE 1640, 271(1992). [Google Scholar]
- 47.Scheckenburger H, Seidlitz HK, and Eberz J, J. Photochem. Photobiol. B 2, 1(1988). [DOI] [PubMed] [Google Scholar]
- 48.Tian R and Rodgers MAJ, in “New Techniques in Optical Microscopy and Spectrophotometry” (Cherry J, ed.), p. 177 Macmillan, London, 1991. [Google Scholar]
- 49.“Technical Data Sheet for High Speed II.” Hamamatsu Photonics K.K., Electron Tube Center, Japan, November 1992. [Google Scholar]
- 50.Wang XF, Periasamy A, Herman B, and Coleman DM, Anal. Chem 23, 369(1992). [Google Scholar]
- 51.Charbonneau S, Allard LB, Young JF, Dyck G, and Kyle BJ, Rev. Sci. Instrum 63, 5315(1992). [Google Scholar]
- 52.Courtney SC and Wilson WL, Rev. Sci. Instrum 62, 2100(1991). [Google Scholar]
- 53.Morgan CG, Mitchell AC, and Murray JG, Proc. SPIE 1204, 798(1990). [Google Scholar]
- 54.Wang XF, Uchida T, Coleman DM, and Minami S, Appl. Spectrosc 45, 360(1991). [Google Scholar]
- 55.Marriot G, Clegg RM, Arndt-Jovin DJ, and Jovin TM, Biophys. J 60, 1374(1991). [DOI] [PMC free article] [PubMed] [Google Scholar]
- 56.Cubeddu R, Taroni P, Valentini G, and Canti G, J. Photochern. Photobiol. B 12, 109(1992). [DOI] [PubMed] [Google Scholar]
- 57.Oida T, Sako Y, and Kusumi A, Biophys. J 64, 676(1993). [DOI] [PMC free article] [PubMed] [Google Scholar]
- 58.Morgan CG, Mitchell AC, and Murray JG, Trans. R. Microsc. Soc 1, 463(1990). [Google Scholar]
- 59.Lakowicz JR and Berndt K, Rev. Sci. lnstrum 62, 1727(1991). [Google Scholar]
- 60.Clegg RM, Feddersen B, Gratton E, and Jovin TM, Proc. SPIE 16407 448(1992). [Google Scholar]
- 61.Lakowicz JR, Szmacinski H, Nowaczyk K, Berndt KW, and Johnson ML, Anal. Biochem 202, 316(1992). [DOI] [PMC free article] [PubMed] [Google Scholar]
- 62.Lakowicz JR, Szmacinski H, Nowaczyk K, and Johnson ML, Proc. Natl. Acad. Sci. U.S.A 89, 1271(1992). [DOI] [PMC free article] [PubMed] [Google Scholar]
- 63.Lakowicz JR, Szmacinski H, Nowaczyk K, and Johnson ML, Cell Calcium 13, 131(1992). [DOI] [PMC free article] [PubMed] [Google Scholar]
- 64.Lakowicz JR, Szmacinski H, Nowaczyk K, Lederer WJ, Kirby MS, and Johnson ML, Cell Calcium 15, 7(1994). [DOI] [PMC free article] [PubMed] [Google Scholar]
- 65.Lakowicz JR, Laczko G, Cherek H, Gratton E, and Limkeman M, Biophys. J 46, 463(1984). [DOI] [PMC free article] [PubMed] [Google Scholar]
- 66.Gratton E, Limkeman M, Lakowicz JR, Maliwal BP, Cherek H, and Laczko G, Biophys. J 46, 479(1984). [DOI] [PMC free article] [PubMed] [Google Scholar]
- 67.Alcala JR, Gratton E, and Prendergast FG, Biophys. J 51, 587(1987). [DOI] [PMC free article] [PubMed] [Google Scholar]
- 68.Lakowicz JR and Cherek H, J. Biochem. Biophys. Methods 5, 19(1981). [DOI] [PubMed] [Google Scholar]
- 69.Lakowicz JR and Cherek H, J. Biol. Chem 256, 6348(1981). [PubMed] [Google Scholar]
- 70.Veselova TV, Cherkasov AS, and Shirokow VI, Opt. Spectrosc. (Engl. Transl.) 29, 617(1970). [Google Scholar]
- 71.Veselova TV and Shirokow VI, Akad. Nauk SSSR Bull. Phys. Sci 36, 925(1972). [Google Scholar]
- 72.Hiraoka Y, Sedat JW, and Agard DA, Science 238, 36(1987). [DOI] [PubMed] [Google Scholar]
- 73.Billhorn RB, Sweedler JV, Epperson PM, and Benton MB, Appl. Spectrosc 41, 1114(1987). [Google Scholar]
- 74.Billhorn RB, Epperson PM, Sweedler JV, and Benton MB, Appl. Spectrosc 41, 1126(1987). [Google Scholar]
- 75.Aikens RS, Agard DA, and Sedat JW, in “Fluorescence Microscopy of Living Cells and Culture, Part A: Fluorescent Analogues, Labelling Cells, and Basic Microscopy” (Wang Y and Taylor DL, eds.), p. 291 Academic Press, New York, 1989. [Google Scholar]
- 76.Tsay T-T, Inman R, Wray B, Herman B, and Jacobson K, J. Microsc 160, 141(1990). [DOI] [PubMed] [Google Scholar]
- 77.Lakowicz JR, Cherek H, and Balter A, J. Biochem. Biophys. Methods 5, 131(1981). [DOI] [PubMed] [Google Scholar]
- 78.Lakowicz JR and Szmacinski H, Sens. Actuators B, 11 133(1993). [Google Scholar]
- 79.Lakowicz JR, Szmacinski H, and Thompson RB, Proc. SPIE 1895, 2(1993). [Google Scholar]
- 80.Miyoshi N, Hara K, Kimura S, Nakanishi K, and Fukuda M, Photochem. Photobiol 53, 415(1991). [DOI] [PubMed] [Google Scholar]
- 81.Hirshfield KM, Toptygin D, Packard BS, and Brand L, Anal. Biochem 209, 209(1993). [DOI] [PubMed] [Google Scholar]
- 82.Berlin JR, Wozniak MA, Cannel MB, Bloch RJ, and Lederer WJ, Cell Calcium 11, 371(1990). [DOI] [PubMed] [Google Scholar]
- 83.Lakowicz JR, Szmacinski H, and Karakelle M, Anal. Chim. Acta 272, 179(1993). [Google Scholar]
- 84.Szmacinski H and Lakowicz JR, Anal. Chem 65, 1668(1993). [DOI] [PMC free article] [PubMed] [Google Scholar]
- 85.Szmacinski H and Lakowicz JR, Biophys. J 64, A108(1993). [Google Scholar]
- 86.Lakowicz JR and Maliwal BP, Anal. Chim. Acta 271, 155(1993). [Google Scholar]
- 87.Verkman AS, Am. J. Physiol 259, C375(1990). [DOI] [PubMed] [Google Scholar]
- 88.Thompson RB and Lakowicz JR, Anal. Chem 65, 853.1993). [DOI] [PMC free article] [PubMed] [Google Scholar]
- 89.Szmacinski H and Lakowicz JR, unpublished observations.
- 90.Wolfbeis OS, in “Fiber Optic Chemical Sensors and Biosensors” (Wolfbeis OS, ed.), Vol, 2, p. 19 CRC Press, Boca Raton, Florida, 1991. [Google Scholar]
- 91.Vanderkooi JM and Wilson DF, Adv. Exp. Methods Biol 200, 189(1986). [DOI] [PubMed] [Google Scholar]
- 92.Bacon JR and Demas JN, Anal. Chem 59, 2780(1987). [Google Scholar]
- 93.Reich RK, Mountain RW, McGonagle WH, Huang CM, Twichell JC, Kosicki BB, and Savoye ED, Proc. IEEE 91, 171(1991). [Google Scholar]
- 94.Diamandis EP, Clin. Biochem 21, 139(1988). [DOI] [PubMed] [Google Scholar]
- 95.Lovgen T, Hemmilä I, Pettersson K, and Halonen P, in “Alternative Immunoassays” (Collins WP, ed.), p. 204 Wiley, 1985. [Google Scholar]


