Abstract
We measured the Mg2+-dependent absorption spectra, emission spectra, quantum yields, and intensity decays of most presently available fluorescent magnesium probes. The lifetimes were found to be strongly Mg2+ dependent for Mag-quin-l, Mag-quin-2, magnesium green, and magnesium orange and increased 2- to 10-fold upon binding of Mg2+. The lifetimes of Mag-fura-2, Mag-fura5, Mag-fura red, and Mag-indo-I were similar in the presence and absence of Mg2+. Detailed timeresolved measurements were carried out for Mag-quin-2 and magnesium green using phase-modulation fluorometry. Apparent dissociation constants (Kd) were determined from the steady-state and time-resolved data. Their values were compared and discussed. Mg2+ sensing is described using phase and modulation data measured at a single modulation frequency. Phase angle and modulation data showed the possibility ofobtaining a wider Mg2+-sensitive range than available from intensity measurements. A significant expansion in the Mg2+-sensitive range was found for Mag-quin-2 using excitation wavelengths from 343 to 375 nm, where the apparent Kd from the phase angle was found to vary from 0.3 to about 100 mM. Discrimination against Ca2+ was also measured for Mag-quin-2 and magnesium green. Significant phototransformation and/or photodecomposition, which affect the sensitivity to Mg2+, were observed for Mag-quin-2 and magnesium green under intense and long illumination.
Keywords: Magnesium fluorescence probes, sensing, imaging, time-resolved fluorescence, frequency-domain fluorescence, phase-modulation fluorometry
INTRODUCTION
Measurements of intracellular Mg2+ concentrations are of considerable interest in biochemistry and cell physiology because of the role of ionized magnesium in the regulation of cell function(1,2). Magnesium has been implicated in hypertension, cardiovascular disease, growth regulation, and cell cycle control, and Mg2+-ATP acts as a cofactor in many enzymes. Processes involved in regulating [Mg2+]l include permeability of the plasma membrane, Mg2+ transporters in the membrane, intracellular buffering by proteins, transport across organelles, and regulation the activity of Na+, K+, and Cl−.(3–6) The methods for measurement of intracellular magnesium using endogenous NMR magnesium chelators (ATP, citrate, phosphocreatine), exogenous NMR magnesium indicators (fluonnated fluorophores), and fluorescent magnesium probes have been reviewed by London(7) Although the 19F NMR-magnesium probes provide unique opportunities(8,9) this method requires a large number of cells and does not presently allow imaging of local [Mg2+]1, concentrations. Fluorescent indicators, with their high sensitivity and selectivity, can provide measurements in single cells, can provide imaging with fluorescence microscopy, and can be performed with better time resolution.
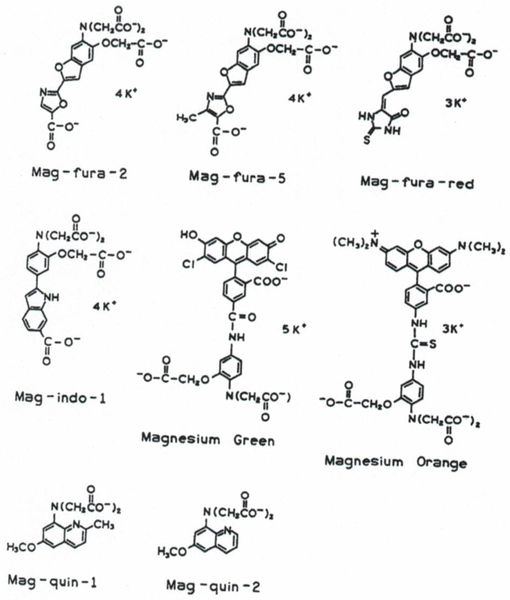
Several magnesium fluorescence indicators are Commercially available, mostly from Molecular Probes.(10) Their chemical structures are shown in Fig 1 They have been developed based on chemical procedures for calcium probes(11,12) and using magnesium-selective chelator APTRA3.(8,13) The names of magnesium probes are the same as for respective calcium probes with the prefix “mag.” The spectral responses to Mg2+ of mag-ftira-2,(13) mag-indo-l,(14) mag-quin-1, and mag-quin-2 are similar to their calcium precursors.(11,12) They require UV excitation in the range of 330–370 nm. These wavelengths are undesirable due to the simultaneous excitation of autofluorescence from unknown cellular fluorophores and known species such as NADH the poor transmission of these wavelengths through microscope optics, and expense and complexity of UV laser sources. To circumvent these difficulties, a new magnesium probe magnesium green (MgG) has been developed by conjugation of APTRA to fluorescein derivatives through an amide linker (Fig. 1). The conjugation approach is chemically easier and allows synthesis of long-wavelength excitation and emission probes with good quantum yields. MgG and MgO absorb visible wavelengths with a maximum at 506 and 550 nm respectively exhibit a Mg2+-dependent spectral response as a result of photomduced electron transfer (PET) between the ion binding site and the attached fluorophore.(15,16) Very recently, new magnesium probes were synthesized in a similar way as MgG and MgO, using an APTRA chelator and based on PET mechanism, also with long excitation wavelengths.(17) A disadvantage of conjugated probes is lack of spectral shifts in either the excitation or the emission spectra upon ion binding.(15–17) Therefore, these probes cannot be used with quantitative wavelength-ratiometric methods as used widely with calcium probes like fura-2 (excitation ratio) and indo-1 (emission ratio).
Fig. 1.
Chemical structures of fluorescent magnesium probes.
In the present paper we demonstrate magnesium sensing based on the magnesium-sensitive fluorescence lifetime of mag-quin-2 and MgG. Lifetime-based sensing does not require spectral shifts and is mostly independent of probe concentration.(18) It is known that the intensity decays of fluorophores are often complex, especially in the presence of two or more species, e.g., in the case the free and Mg2+-bound forms of the magnesium probes. Fortunately, analyte sensing (here Mg2+) does not require resolution of the multiexponential intensity decay of the probe. A single modulation frequency can be used to obtain the analyte concentration with phase-modulation fluorometry.(18,19) Probes which display a spectral shift (absorption or emission) combined with phase-modulation fluorometry provide a unique capability of expanding the sensitive range over a wide range of analyte concentrations.(20,21) Not all available magnesium probes can be used with lifetimebased sensing. The most widely used magnesium fluorescent probe like mag-fura-2(22–29) and the lesser used mag-indo-1(24) do not show useful changes in lifetime upon magnesium binding. These results are somewhat surprising compared to their respective calcium analogues.(21,30) We also found no lifetime change upon Mg2+ binding for mag-fura-5 and mag-fura-red. Magfura-5 was recently evaluated as an excitation wavelength ratiometric magnesium probe.(31) The others probes (mag-quin-1, mag-quin-2, magnesium green, and magnesium orange) display increased lifetimes on Mg2+ binding and can thus be used for lifetime-based sensing and imaging of Mg2+. A promising lifetime probe is magnesium orange (MgO), which structurally is similar to MgG but contains a more photostable rhodamine derivative instead of fluorescein.(32) In the present paper we focused on mag-quin-2 and magnesium green.
MATERIALS AND METHODS
The magnesium probes were obtained from Molecular Probes, Eugene, Oregon. Their chemical structures are shown in Fig. 1. The structures for MgO and magfura-red have not been published yet. Mg2+ and Ca2+ concentrations were obtained using magnesium (115 mM KCI, 20 mM NCI, 10 Tris, pH 7.05, and MgC12 from 0 to 35 mM) and calcium [100 mM KCI, 10 mM MOPS, pH 7.2, and 10 mM (EGTA + CaEGTA)] Calibration Buffer Kits also from Molecular Probes. The samples were freshly prepared before each measurement and measurements were performed at room temperature (20°C). Absorption spectra were measured using a Perkin—Elmer Lambda 6 UV/vis spectrophotometer. Fluorescence spectra and quantum yields were obtained with a SLM 8000 photon counting spectrofluorometer. The quantum yields were calculated by comparing the integrals of corrected emission spectra of the Mg2+-bound and anion free forms with the emission from mag-fura2, Mg2+-bound form, for which the quantum yield was taken as 0.30.(13) Fluorescence intensity decays were measured with frequency-domain instrumentation described in Ref. 33. The light source was the cavitydumped and frequency-doubled output of pyridine 2 dye laser (pulse repetition rate, 3.795 MHz) from 343 to 375 nm for excitation of mag-quin-2 or the output of a argon ion mode-locked laser (pulse repetition rate, 75.9 MHz) with 514 nm for excitation of magnesium green. The emission was observed through long-wave pass filters, above 445 nm for mag-quin-2 and above 530 nm for MgG. The frequency-domain data were used to determine the intensity decay law using the multiexponential model
| (1) |
where αi are the preexponential factors, τi are the decay times, and n is the number of exponential components. The mean decay time is given by
| (2) |
The intensity decays were also fit to a global model in which the decay times were assumed to be independent of Mg2+ concentration (κ), but the values αik to reflect changes in the fractional amounts of each species. In this case the intensity decay of each Mg2+ concentration is given by
| (3) |
where the subscript k indicates the Mg2+ concentration. All magnesium concentrations refer to free magnesium. For the intensity decay measurements we used magic angle conditions to eliminate the effects of Brownian rotation.
In phase-modulation fluorometry, the sample is excited with an intensity-modulated light source. The emission is delayed in time relative to the modulated excitation. At each circular modulation frequency this delay is described as the phase shift which increases from 0 to 900 with increasing modulation frequency (ω in radian/s). The finite time response of the sample also results in demodulation of the emission by a factor mω, which decreases from 1.0 to 0.0 with increasing modulation frequency. The phase angle and the modulation (mω) are separate measurements, each of which are related to the intensity decay parameters, αi and τi, and modulation frequency ω by
| (4) |
where
| (5) |
The values αi and τi are determined by minimization of the goodness-of-fit parameter
| (6) |
where the subscript c indicates calculated values of the phase and modulation for assumed values of αi and τi, ν is the number of degrees of freedom, and and are the experimental uncertainties of the measured phase and modulation values. The sum can extend over a single set of data (ω) or over multiple data for both different frequencies (ω) and magnesium concentrations (k). For the latter global analysis, we assumed that the values of τi were global, i.e., were the same at all magnesium concentrations.
RESULTS AND DISCUSSION
Absorption and Emission Spectra
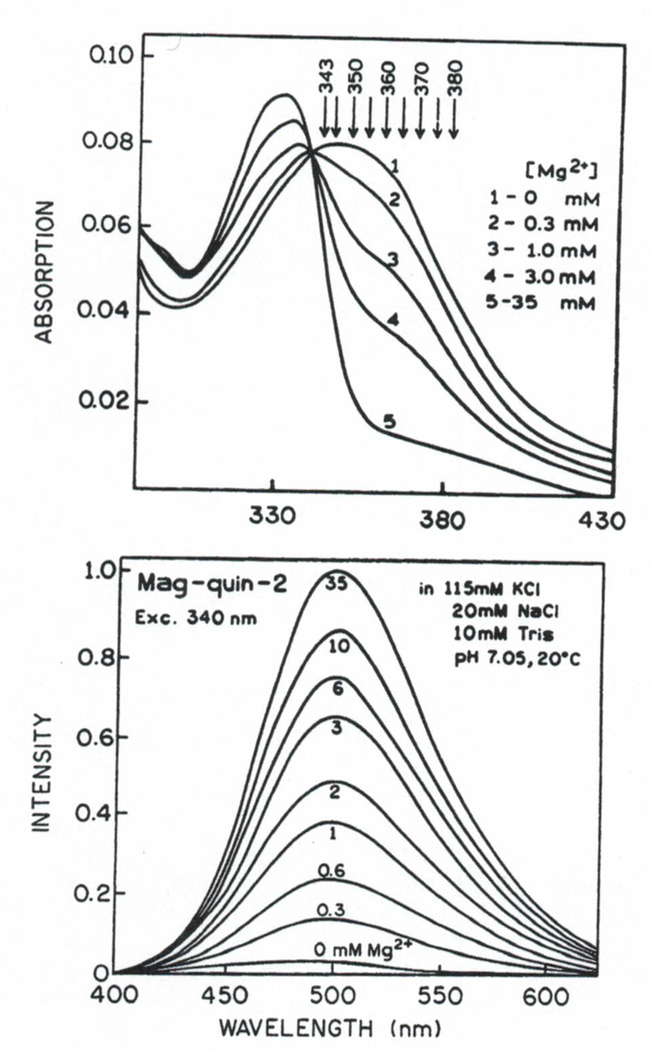
Absorption and emission spectra of mag-quin-2 with various magnesium concentrations are shown in Fig. 2. The absorption spectra of thé free and Mg2+bound forms of mag-quin-2 show a spectral shift with an isobestic point at 340 nm. Binding of Mg2+ to magquin-2 results in a strong enhancement of its fluorescence, over 20-fold. The Mg-dependent emission spectra of mag-quin-2 in the absence (0 mM) and presence of magnesium (Fig. 2, 35 mM) reflect the relative quantum yields of the free and Mg2+-bound forms, respectively, because excitation (339 nm) was close to the isobestic point. The relative emission spectra of mag-quin-2 depend strongly on excitation wavelength since the absorption spectra of the free anion and Mg2+-bound forms are shifted. There are no reports of practical applications of mag-quin-2. It is likely that mag-quin-2 cannot be regarded as a good excitation ratiometric probe, similar to the calcium analogue quin-2.(34) The fluorescence intensity of quin-2 drops off sharply at excitation wavelengths longer than 360 nm due to a low extinction coefficient for the Ca2+-bound form and the low quantum yield of the free anion. It is experimentally difficult to separate excitation wavelengths of 360 from 340 nm by the bandpass filter and dichroic mirror system for excitation ratiometric measurements. Using excitation wavelength shorter than 340 nm will require expensive quartz microscope optics. Nevertheless, excitation of mag-quin2 with longer wavelengths has important advantageous if lifetime-based measurements are used (see next section).
Fig. 2.
Absorption (top) and emission spectra (bottom) of mag-quin-2 in calibrated magnesium buffers at 20°C.
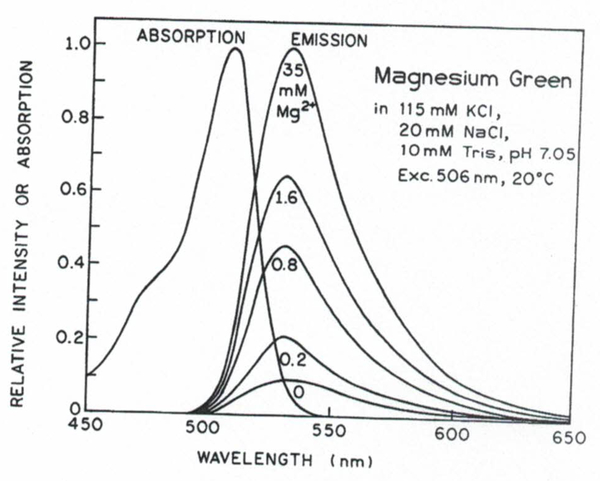
Figure 3 shows the absorption and emission spectra of magnesium green. The MgG responds to magnesium in a similar way as the calcium Color Series (calcium green, calcium orange, and calcium Crimson) responds to Ca2+,(19) with a significantly increased quantum yield on Mg2+ binding. There is no spectral shift upon Mg2+ binding in either the absorption or the emission spectra. Moreover, Mg2+ binding does not affect the long-wavelength absorption spectrum. The relative intensity of the Mg2+-bound form of MgG is about 10-fold higher than its free anion due to its higher quantum yield. Absorption and emission spectra of MgO (not shown) are shifted about 45 nm toward longer wavelengths compared to those of MgG. The fluorescence intensity of MgO increases 2.65-fold upon Mg2+ binding without a spectral shift. An important feature of these new conjugated probes is the possibility with visible excitation wavelengths, which reduces autofluorescence and is much less harmful for cells than UV excitation. A disadvantage for quantitative steady-state measurements is the lack of ratiometric capabilities. However, MgG and MgO can be successfully used with the lifetime-based measurements (below).
Fig. 3.
Absorption and emission spectra of magnesium green.
Frequency-Domain Intensity Decays
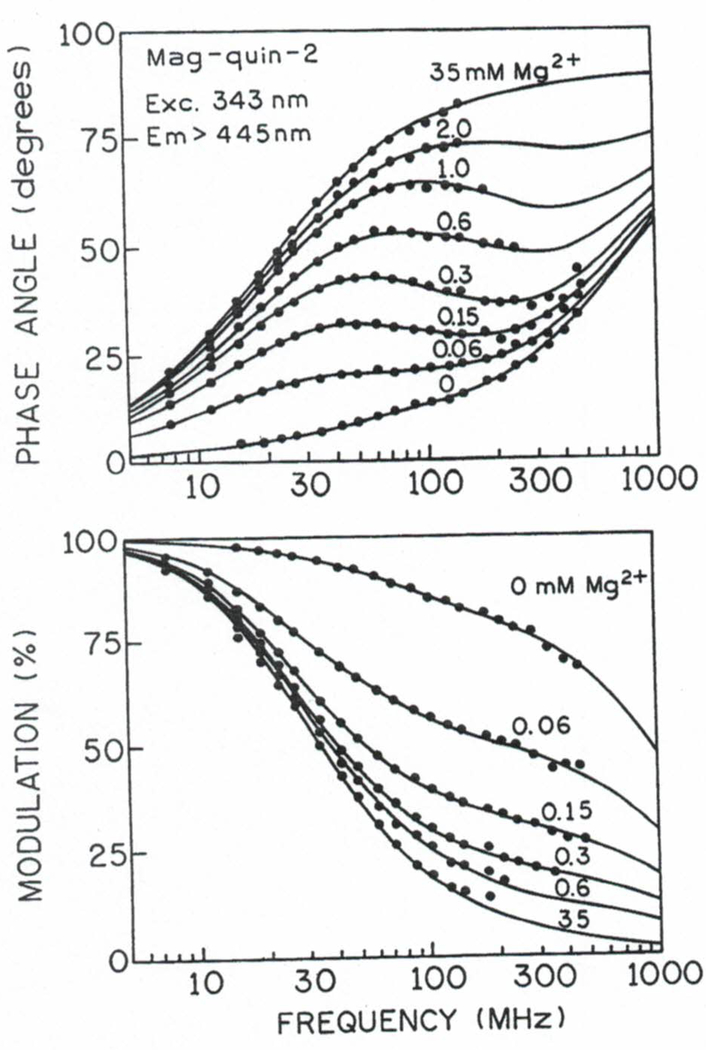
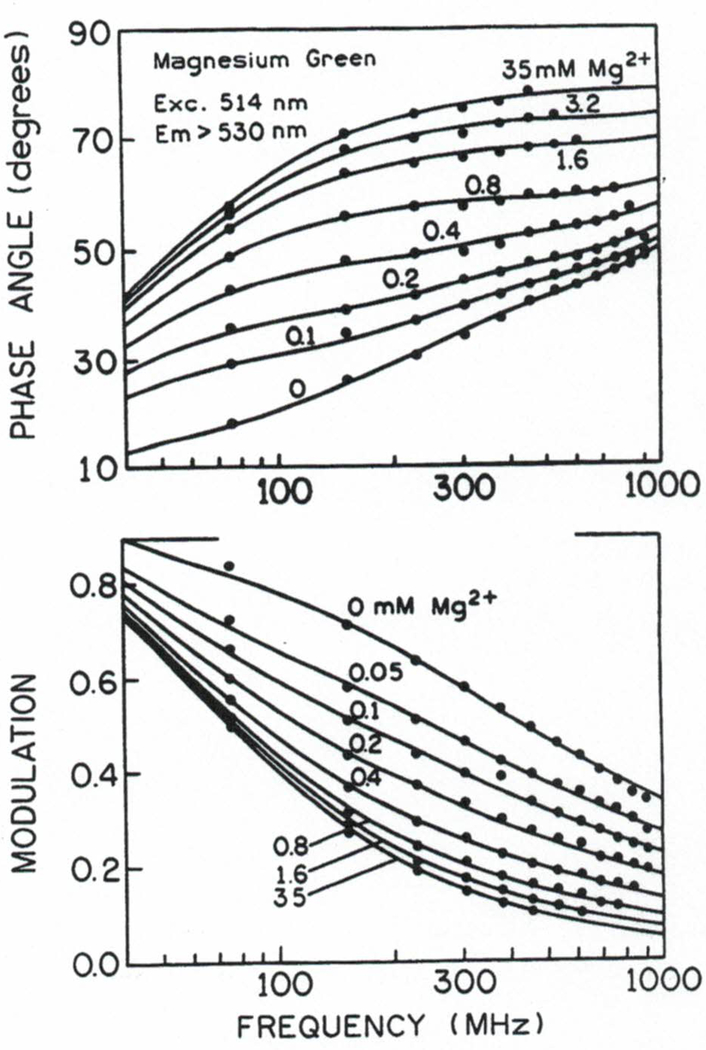
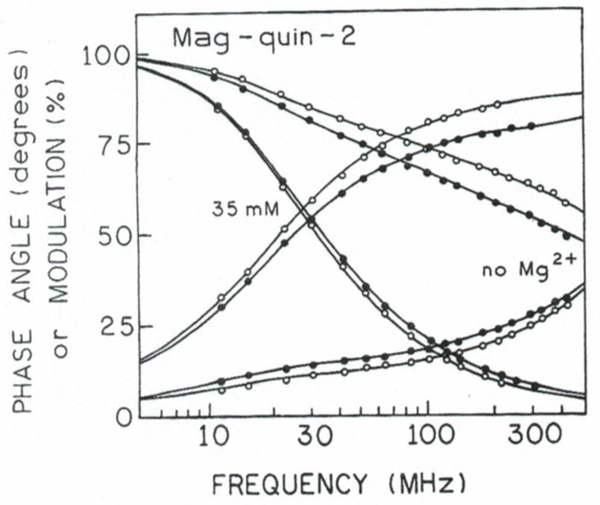
We measured the frequency responses of mag-quin2 and MgG at various magnesium concentrations from 0 to 35 mM. The excitation wavelength was 343 nm for mag-quin-2 and 514 nm for MgG. Their frequency-domain intensity decays are shown in Figs. 4 and 5. The increase in phase angle and decrease in modulation with increasing concentrations of [Mg2+] indicates an increase in the mean lifetimes upon Mg2+ binding. For instance, at a modulation frequency of 100 MHz, the phase angle of mag-quin-2 increases from 14 to 78° upon binding Mg2+, and the modulation decreases from 0.85 to 0.19 (Fig. 4). Excellent changes in phase and modulation (more than 400 and 40%) were also observed for MgG (Fig. 5). Somewhat smaller but still substantial changes (about 260 and 28%; not shown) in phase and modulation was observed for MgO. These results indicate that mag-quin-2, MgG, and MgO with a single excitation wavelength and a single modulation frequency, can be used for fluorescence lifetime-based sensing and imaging of Mg2+. It should be noted that the magnesium sensitive range of the phase angle and modulation is dependent on fre modulation frequency because of strong heterogeneity of intensity decays (Figs. 4 and 5). The choice of modulation frequency may depend on the needs of the experiment. Usually, there is a wide range of useful modulation frequencies. For instance, modulation frequencies from about 30 to 1000 MHz will give substantial changes in phase angle and modulation in response to Mg2+ for mag-quin-2 and MgG (Figs. 4 and 5). However, modulation frequencies higher than 300 MHz will require more expensive high-speed detectors (e.g., MCP-PMT) for effcient detection of the moduated emission.
Fig. 4.
Frequency domain of intensity decays of mag-quin-2 with various Mg2+ concentrations.
Fig. 5.
Frequency domain of intensity decays of magnesium green with various Mg2+ concentrations.
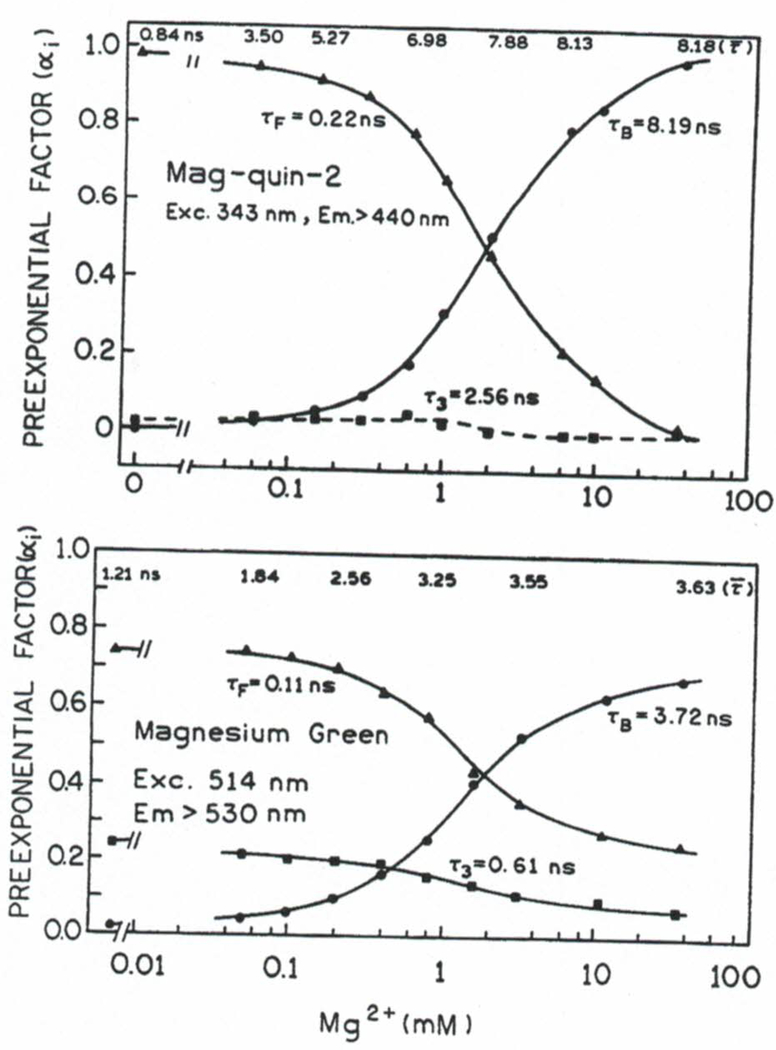
The fluorescence intensity decays of mag-quin-2 (Fig. 4) and MgG (Fig. 5) were found to be multiexponential. Acceptable fits could be obtained with three decay times at all magnesium concentrations. We used global multiexponential intensity decay analysis [Eq. (3)] to determine the multiexponential decay times and changes of the amplitudes with various magnesium concentrations. The results of this global analysis are summarized in Fig. 6. Three decay times were found for both probes and the decay times appeared to be independent of Mg2+ concentration. However, the amplitudes are strongly dependent on the magnesium concentration (Fig. 6). The component which is evidently associated with the magnesium free form is described as τF and that associated with bound form as τB. The amplitude of the third component, τ3, is less sensitive to magnesium. In the case of mag-quin-2 this value (α3) is low and almost insensitive to magnesium. A form of mag-quin-2 and MgG less sensitive to magnesium may be explained by the partially protonated forms of the magnesium probes (lower affnity to Mg2+), which has been suggested in case of mag-indo-1.(14) However, the pKa of magnesium probes near 5 argues against a protonated form, so that the origin of the Mg2+-insensitive form is not clear.
Fig. 6.
Mg2+-dependent preexponential factors for mag-quin-2 (top) and MgG (bottom).
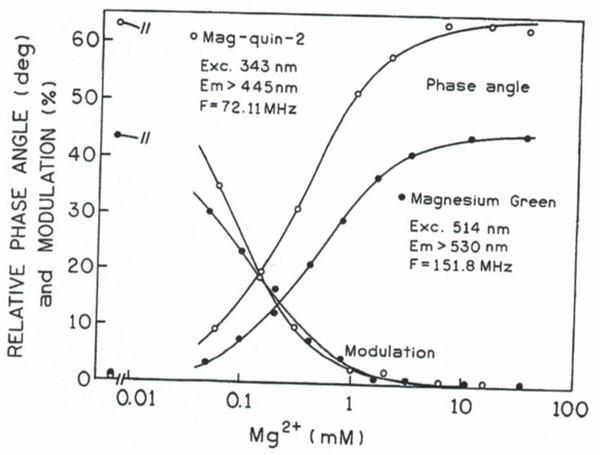
The plots of the Mg2+-dependent multiexponential analysis (αi vs [Mg2+]) can be regarded as very detailed calibration curves. But in practice, they may not be available. Calculation of the multiexponential parameter values in Fig. 6 requires multifrequency measurements and least-squares data analysis.(33,35,36) For lifetime imaging one expects to obtain data using a single light modulation frequency because multifrequency lifetime imaging is presently instrumentally complex and time consuming. Regardless of the complex intensity decays one can see from Figs. 4 and 5 that there is available a wide range of modulation frequencies which can be used for phase angle- or/and modulation-based sensing. Figure 7 shows that both probes display excellent phase angle and modulation changes in response to Mg2+ in an optimal range for physiological levels of Mg2+ (from about 0.1 to about 5 mM). The apparent dissociation constants from modulation and phase angle are 0.07 and 0.30 mM for mag-quin-2 and 0.11 and 0.45 for MgG, respectively. Theoretically, measurements of Mg2+ concentrations from about 0.007 to 4.5 mM are possible with the phase-modulation method. However, the presence of Ca2+ in cytosol may significantly affect the accuracy of the Mg2+ determinations (see next section). The large changes in phase angle (42° for MgG and 63° for mag-quin-2) and modulation (42 and 62%, respectively) result from the large difference between the lifetime of the free anion and Mg2+-bound forms (see Fig. 6). The lifetimes observed for MgG and mag-quin-2 are in the range of their calcium analogues, calcium green(19) and respectively. Almost no changes in lifetime was observed for mag-fura-2 and mag-indo-I (Table I), whereas the calcium probes fura-2(21) and indo-I (30) displayed quite sufficient changes for phase angle and modulation calcium imaging. We have also investigated mag-quin-l in terms of phase and modulation sensing. Its lifetime and quantum yield increases significantly upon magnesium binding (see Table I). The detailed data for mag-quin-l are not presented because the spectral changes are similar to those of mag-quin-2 but the quantum yield is significantly lower. Therefore, for biological applications, the better choice is mag-quin-2.
Fig. 7.
Mg2+-dependent phase angles and modulations for mag-quin-2 and for magnesium green.
Table I.
Spectroscopic Characteristics of Fluorescent Magnesium Probes
| Absorption |
Emission |
||||
|---|---|---|---|---|---|
| Probe |
(nm)a |
(× 10−3 M−1cm−1)b |
(nm)a |
c |
2(ns)d |
| mag-quin-1 | 349(335) | 5.0 | 499(490) | 0.0015(0.009) | 0.57(10.3) |
| mag-quin-2 | 353(337) | 4.2(4.0) | 487(493) | 0.003(0.07) | 0.84(8.16) |
| mag-fura-2 | 370(330) | 26(28) | 511(491) | 0.24(0.30) | 1.64(1.72) |
| mag-fura-5 | 369(332) | 23(25) | 505(482) | — | 2.52(2.39) |
| mag-indo-1 | 352(331) | 38(33) | 476(417) | 0.36(0.59) | 1.71(1.90) |
| MgG | 506 | 76 | 532 | 0.04(0.42) | 0.98(3.63) |
| mag-fura-red | 483(427) | 23(29) | 659(631) | 0.012(0.007) | 0.38(0.35) |
| MgO | 550 | 56 | 575 | 0.13(0.34) | 1.06(2.15) |
Absorption and emission maxima; of the free anion (F) and Mg2+-bound fom (B) [10].
Extinction coeffcients at absorption maxima [10].
Quantum yields vs the Mg2+-bound form of mag-fura-2; 0.30 [13], quantum yields for MgO were determined relative to Ca2+-bound forms of calcium orange, 0.33 [15] for mag-fura-red relative to 0.53 for calcium crimson [15].
Mean lifetime, see Eq. (2).
It is important to note that the analyte sensitive ranges obtained with phase angle and modulation measurements are different than those determined from fluorescence intensity or absorption. The analyte—sensitive range based on intensity measurements is accurately predicted from the value of the dissociation constant, KD. The dynamic range of the probe is determined by the magnitude of the changes from minimum to maximum of intensity or from minimum to maximum of intensity ratio for wavelength-ratiometric probes. The plot of intensity values versus analyte concentration (logarithmic scale) is usually sigmoidal with the midpoint related to analyte concentration equal Kd. Typically, Mg2+ concentrations can be determined within a 10-fold range above and below the Kd.
The changes in phase angle and modulation in response to Mg2+ concentration were approximately sigmoidal (Fig. 7). The minimum and maximum values of the phase angle (reversed for modulation) are related to the decay times for free probe and analyte bound, respectively. However, the analyte sensitive concentration range is usually shifted compared to that from intensity measurements. In general, the magnitude of shift depends on the mean lifetime of the free and analyte-bound forms of the probe.(18) If the mean lifetime of the bound forn is larger than that of the free, the analyte sensitive range measured by phase angle and modulation is shifted toward lower analyte concentrations.(18) In practical applications, it is useful to introduce an apparent dissociation constant which is not equal to the concentration of analyte where there are equal amounts of the free and analyte bound forms of the probe. The apparent dissociation constants for mag-quin-2 and MgG were calculated using plots of log (Hill plot), where X refers to phase angle (θ) Or modulation (m). The apparent dissociation constants (Table II) are equal to the Mg2+ concentration at the zero intercept of the Hill plots using the phase angle or modulation as the measurable parameter X. The apparent dissociation constant is an important and helpful parameter from the point of view of lifetime-based sensing. It describes the analyte sensitive concentration range associated with the measurable parameter (phase angle or modulation). Its value defines the midpoint in similar manner as for intensity measurements.
Table II.
Dissociation Constants (mM) Determined from Intensity and from Phase-Modulation Measurements for Magnesium Probes
| Probe | Intensity method |
Ref. No. |
Phase-modulation method |
|||
|---|---|---|---|---|---|---|
| KD (Mg) | KD (Ca) | |||||
| mag-fura-2 | 1.5 | — | 10 | Insufficient lifetime sensitivity | ||
| 2.7 | 0.030 | 38 | ||||
| 2.3 | — | 24 | ||||
| mag-indo-1 | 2.7 | — | 10 | Insufficient lifetime sensitivity | ||
| 3.1 | 0.034 | 38 | ||||
| mag-fura-5 | 2.6 | 0.0065 | 10 | Insufficient lifetime sensitivity | ||
| mag-fura-red | 4.6 | 0.017 | 32 | Insufficient lifetime sensitivity | ||
| MgO | 3.5 | 0.012 | 32 | Not measured | ||
| mag-quin-2 | 0.8 | — | 10 | Excitation (nm) |
||
| 2.2 | — | 0.30 | 0.07 | 343 | ||
| 0.35 | 0.09 | 345 | ||||
| 0.85 | 0.15 | 350 | ||||
| 2.7 | 0.55 | 355 | ||||
| 10.1 | 1.5 | 360 | ||||
| 45 | 6.5 | 365 | ||||
| >100 | ~20 | 370 | ||||
| mag-quin-1 | 6.7 | — | 10 | 1.3 | — | 343 |
| MgO | 0.9 | 0.0048 | 10 | Frequency (MHz) |
||
| 1.4 | — | 0.27 | 0.09 | 75.9 | ||
| 0.45 | 0.11 | 151.0 | ||||
| 0.68 | 0.20 | 759.0 | ||||
The lifetime does not depend on the total fluorescence intensity (probe concentration) but reflects the fractional contribution of the free anion and Mg2+-bound probe to the total intensity. The mean lifetime depends on the fractional contribution of each component and can be calculated using Eq. (2). The fractional intensity contribution in case of an absorption spectral shift will depend on the excitation wavelength. Excitation at wavelengths longer than the isobestic point for magquin-2 will result in an increased contribution from the free anion (or decreased from Mg2+-bound) to the total fluorescence intensity. In this case the apparent dissociation constant for phase angle and modulation will have a higher value which allows measurement of higher magnesium concentrations. The highest apparent dissociation constant is limited by the relative fluorescence signals from the free and Mg2+-bound forms of the probe.
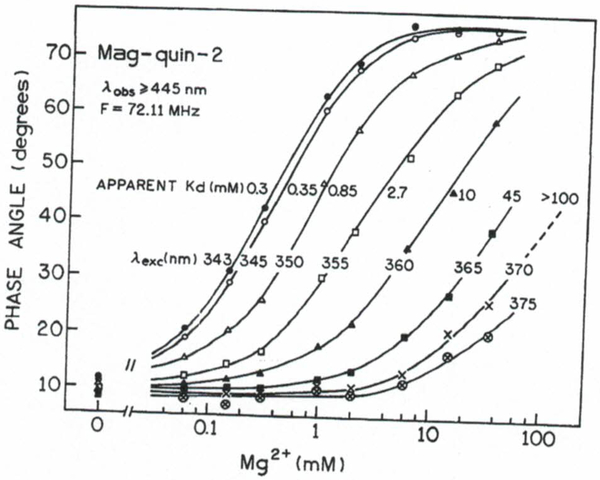
The effect of excitation wavelength for mag-quin2 at various Mg2+ concentrations are shown in Fig. 8 for the phase angle measurements at 72.11 MHz. The sensitive range of Mg2+ concentration is extended from about 0.03 (excitation at 343 nm) to more than 100 mM (excitation at 360–370 nm). The apparent dissociation constants for phase angle and modulation for mag-quin2 at excitation wavelengths from 343 to 370 nm are summarized in Table II. Assuming a range that measurable analyte ranges from 0.1 to 10 of the value, the phase-modulation method using mag-quin-2 allows measurement over almost five decades of Mg2+ concentration, i.e., from about 0.01 to about 1000 mM. From intensity measurements we can expect only two decades of Mg2+ concentration. The differences between the Kd values determined from intensity measurements shown in Table II are likely a result of sensitivity to temperature, ionic strength, and pH of magnesium probes.(31,38) Additionally, the phase angle and modulation are usually measured simultaneously, and the combined data will give more accurate measurements of the Mg2+ concentration. The apparent Kd value of the mag-quin-2 can be selected to match needs of the cell biology experiment simply by changing the excitation wavelength. For instance, excitation at a shorter wavelength can be used to measure lower Mg2+ concentrations in one region of a cell, and a longer wavelength can be used to measure higher Mg2+ concentrations in another region of the cell. Another advantage of phase-modulation method is the high Mg2+ sensitivity, which is important factor since physiological changes in Mg2+ concentration are relatively small, (13,27,31) which require the most sensitive part of the calibration curve be close to the apparent Kd.
Fig. 8.
Excitation wavelength- and Mg2+-dependent phase angles for mag-quin-2.
An important characteristic of the phase angle data presented in Fig. 8 is that higher excitation wavelengths may allow a calibration of mag-quin-2 under the experiments with living cells without use of ionophores. Intracellular Mg2+ concentrations are not expected to be higher than about 20 mM. For excitation at wavelengths above 375 nm the phase angle of mag-quin-2 (72.11 MHz) will change insignificantly and will yield the phase angle for the free form (Fig. 8). If one assumes that the total phase angle change remains constant in the control buffer and in the cell, than a phase angle measurement at other excitation wavelengths can be used with the data in Fig. 8 to determine the Mg2+ concentration.
The nonratiometric probes, like MgG and MgO, do not allow changes in the apparent dissociation constants by selection of the excitation wavelength. However, the apparent dissociation constant can be changed slightly by selection of the modulation frequency. For example at modulation frequencies of 75.9 and 759 MHz (see Fig. 5), the apparent dissociation constants from phase angle can be estimated to be 0.27 and 0.68 mM, respectively. The apparent dissociation constants for MgG for three selected modulation frequencies are in Table II. This shift toward higher apparent Kd values with higher modulation frequencies occurs because at higher modulation frequencies the shorter decay times contribute more to the phase angle and modulation measurements [Eqs. (4) and (5)]. Importantly, lifetime measurements of MgG allows Mg2+ measurements with visible excitation wavelengths, which is very convenient to avoid excitation of cellular endogenous fluorophores and reduced autofluorescence. Visible excitation also reduces the cell photodamage.
Photobleaching of mag-quin-2 and Magnesium Green
Commonly, photobleaching is regarded as a reduced fluorescence intensity due to the reduced concentration of molecules under strong excitation. This process frequently occurs under microscopy illumination. While we refer to the process as photobleaching, we mean by the term both loss of the probe and phototransformation of the probe to new fluorescent species. In cuvette measurements, photobleaching processes can be avoided or significantly reduced by sample stirring or/and defocused excitation.
To evaluate the effects of intense illumination we measured the intensity decays of fresh samples with lowintensity excitation and after exposing the sample to the strong and focused excitation for several minutes to mimic the conditions in a microscope. The 343-nm excitation for mag-quin-2 and 514-nm excitation for MgG were focused into a small volume cuvette containing mag-quin-2 or MgG, respectively. Since the photobleaching processes are excitation intensity and time duration dependent, the present data should be regarded as one of many possible cases. The goal of these measurements was to reveal the presence of photoprocesses and their possible effect on the Mg2+ measurements.
To facilitate the comparison of intensity decays before and after intense illumination we used a multiexponential global analysis. The multiexponential model is suffciently versatile, compared to the experimental resolution, so that the photobleaching data could be analyzed using either variable decay times or amplitudes. In the global analysis we assumed that the decay times were the same before and after illumination, and the respective amplitudes or fractional intensities changed in response to photobleaching. Similar experiments and analysis have been recently reported for calcium probes, quin-2(39) and fura-2.(21) We note that it is likely that one or more of the decay times could change in response to photobleaching. We used a two- or three-decay time model for MgG and mag-quin-2, respectively, to fit the frequency-domain data.
The effect of photobleaching was investigated for the free anion and Mg2+-bound forms separately. The detailed intensity decays analysis for mag-quin-2 and MgG are summarized in Table III. By examining the changes of amplitude (αi) or fractional intensity (fi), the photobleaching processes for mag-quin-2 and MgG seem to be complex and cannot be explained by creating only nonfluorescent molecules. If the Mg2+ probes simply bleached to nonfluorescent forms there would be no change in the intensity decay. A detailed discussion of each case is beyond the scope of the present paper, and would require more experimental work, and the results are likely to be dependent on the precise experimental conditions. Also, the effects of illumination are likely to be different in the presence or absence of intracellular components, as well as molecular oxygen.(41)
Table III.
Intensity Decay Analysis Before and After (Data in Parentheses) Photobleaching of mag-quin-2 and MgG
| Condition | τi (ns) | αi | a | b | |
|---|---|---|---|---|---|
| mag-quin-2 | |||||
| No Mg2+ | 0.18 | 0.953 (0.932) | 0.612 (0.508) | ||
| 1.23 | 0.039 (0.058) | 0.168 (0.205) | |||
| 7.66 | 0.008 (0.013) | 0.220 (0.287) | 2.00 (2.54) | 0.96 | |
| 35 mM Mg2+ | 0.39 | −0.023 (0.189) | −0.001 (0.012) | ||
| 2.54 | −0.012 (0.148) | −0.007 (0.061) | |||
| 8.56 | 0.956 (0.663) | 1.008 (0.927) | 8.56 (8.09) | 0.35 | |
| Magnesium green | |||||
| No Mg2+ | 0.07 | 0.761 (0.780) | 0.228 (0.185) | ||
| 0.46 | 0.216 (0.172) | 0.444 (0.280) | |||
| 35 mM Mg2+ | 3.11 | 0.023 (0.048) | 0.328 (0.534) | 1.22 (1.76) | 0.95 |
| 0.16 | 0.293 (0.598) | 0.018 (0.063) | |||
| 3.56 | 0.707 (0.402) | 0.982 (0.937) | 3.68 (3.16) | 0.60 | |
Fractional intensity and mean lifetime .
Relative intensity of the photobleached (I) sample relative to the nonphotobleached sample (I0).
The most evident case is the behavior of Mg2+bound form of mag-quin-2; the nonphotobleached sample display an almost single-exponential decay (α3 = 0.956), whereas the photobleached sample display a significant fraction of the short component (0.39 ns), which can be associated with the free form (see Fig. 6). The steady-state intensity decreased significantly (I/I0 0.35, where I0 and I are the intensities before and after illumination, respectively), which can be interpreted as an effect of nonfluorescent probe molecules (photobleached). The intensity decay data for the same photobleached sample of mag-quin-2 indicate that the decreased total intensity is a result of the processes of phototransformation and photodecomposition. The excited Mg2+-bound form is partially decomposed to fluorescent form (s) with shorter lifetime (s) and, possibly, to the excited state free anion. It has been reported that partially bleached fura-2 solutions also contain fluorescent and less calcium-sensitive form(s), which affects the relative excitation spectra(40) and intensity decays.(21) The small decrease in mean lifetime, from 8.56 to 8.09 ns (Table II), and much greater decrease in intensity (I/I0 = 0.35) confirm that a significant amount of the probe is simply photobleached, that is, becomes nonfluorescent.
From the practical point of view, the most important factor is the effect of intense illumination on the calibration curve of the probe. The rate of photobleaching of the free and bound form may be different, which will result in excitation intensity and time duration-dependent apparent dissociation constants measured by steady-state or time-resolved methods. The calibration curve may be shifted toward lower or higher analyte concentrations range compared to those observed without photo effects. The photodecomposition may lead to an equilibrium which does not reflect the ground-state equilibrium of the probe prior to phototransformation. The effect of intense illumination on the phase angle and modulation for free anion and Mg2+-bound form of magquin-2 is presented in Fig. 9. Opposite changes in phase angle and modulation are observed for the free anion and Mg2+-bound of the photobleached samples relative to nonphotobleached. This result indicates a decreased dynamic range for Mg2+. However, the apparent dissociation constants from phase angle and modulation may not be affected as much as the dissociation constant from intensity measurements. This is because, for low concentrations of Mg2+, the phase angle of the photobleached probe will be higher and for high Mg2+ concentration lower than those of nonphotobleached probe. As a result the midpoint (apparent dissociation constant) will not be significantly shifted.
Fig. 9.
Effect of intense illumination on intensity decays of free and Mg2+-bound forms of mag-quin-2. Data are shown for before (○) and after (●) intense illumination.
Mg2+/Ca2+ Sensitivity of mag-quin-2 and Magnesium Green
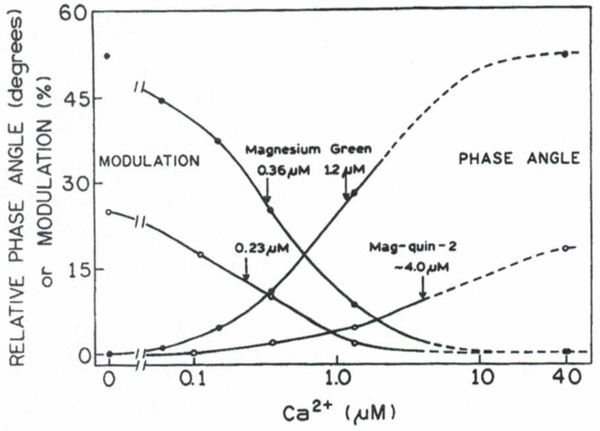
One of the most important parameters besides magnesium sensitivity is discrimination against calcium. It has been shown that binding of Ca2+ leads to changes in the fluorescence spectra of mag-fura-2, which are nearly identical to those resulting from Mg2+ binding.(13) A detailed discussion of Ca2+ interference on Mg2+ using mag-fura-2 are reported elsewhere.(42) We also studied Ca2+ binding to mag-quin-2 and MgG using phase-modulation fluorometry. The intensity decay of MgG in the presence of Ca2+ can be described by similar decay times as in the presence of Mg2+. For mag-quin-2 the intensity decays in the presence of Ca2+ were more complex than in the presence of Mg2+. The amplitudes and decay times cannot be correlated with the Ca2+ concentration as has been shown for Mg2+ (Fig. 6). The mean lifetime increased from 0.92 ns (no Ca2+) to only 2.47 ns (1.35 11M free Ca2+), and for higher Ca2+ concentrations the value of mean lifetime decreased to about of 1.8 ns. However, the absorption spectra indicated the only Ca2+-bound form for the ground state of mag-quin-2 (40 μM free Ca2+). The intensity decays of mag-quin-2 with increased Ca2+ concentrations suggest that the Ca2+-bound form undergoes a fast excited-state reaction with possible dissociation of the Ca2+. In the presence of phototransformation the intensity decays are nonexponential and the expected lifetimes of free and Ca2+-bound forms drift with time. In this case it is difficult resolve the decay times of both forrns using the multiexponential model. The Ca2+-dependent phase angles and modulations for mag-quin-2 and MgG are shown in Fig. 10. The differences for mag-quin-2 in the presence of Mg2+ (Fig. 7) and Ca2+ (Fig. 10) and the similar behavior for MgG can be explained by the different magnesium chelators used to create these probes. In mag-quin-2 the chelator is EDTA and in MgG it is APTRA (see Fig. 1). It is important to notice that the different phase-modulation measurements of mag-quin-2 for Mg2+ and Ca2+ is an advantage over the intensity measurements, which are similar for these ions.
Fig. 10.
Ca2+-dependent phase angles and modulations for mag-quin-2 (○) and for magnesium green (●). Arrows indicate apparent dissociation constants (midpoints). Experimental conditions are the same as indicated in the legend to Fig. 7.
If Ca2+ and Mg2+ ions produce essentially identical changes in the measured parameter of the magnesium probe, the changes correspond to an average of [Mg2+] and [Ca2+] concentrations weighted by their respective apparent dissociation constants. Assuming that both ions are in equilibrium with the probe, the magnesium concentration can be determined from(7)
| (7) |
where X is a measured parameter (intensity, absorbance, mean lifetime, phase angle, or modulation), and and are apparent dissociation constants obtained using parameter X.
The correction factors (see data in Figs. 7 and 10) are 75 and 304 for mag-quin-2 and 375 and 306 for MgG, using phase angle and modulation measurements, respectively. These values are comparable with those that can be estimated from the respective KD’s of other magnesium probes (mag-fura-red, MgO, and mag:fura-5) presented in Table II. About two- to three fold lower values can be calculated for mag-fura-2 and mag-indo-1 (Table II). The substantial calcium affnity of the magnesium probes is a complicating factor in Mg2+ measurements since the ratio of these divalent cations in cytosolic concentrations can be estimated from about 2000 to 10000. It is very likely that measurements of Mg2+ in cytosol will be affected by the Ca2+ concentration. However, examining Fig. 9 we can conclude that Ca2+ concentrations below 1μM will have almost no effect on measurements of Mg2+ using the phase angle of mag-quin-2 (excitation 343 nm). Phase angles of MgG also allow magnesium measurements without corrections if the free Ca2+ concentration in cytosol does not exceed about 100 nM. The modulation data are somewhat more sensitive at low Ca2+ concentrations and will require corrections using Eq. (7). Fortunately, there are calcium analogues for mag-quin-2, quin-2; and for MgG, calcium green, which can be used to measure calcium concentration, without the need to change the instrumental configuration (excitation and emission wavelengths as well as modulation frequency).
SUMMARY
Since many questions about magnesium transport remain to be answered, the availability of new fluorescent probes and new methods should greatly enhance our knowledge of intracellular magnesium regulation. New probes such as magnesium green and magnesium orange display a high lifetime sensitivity to Mg2+ that can be measured by phase angle and/or modulation. They can be excited with visible wavelengths that reduces autoflourescence. The apparent dissociation constants from phase and modulation measurements shows an apparent higher affinity for magnesium than from intensity measurements for MgG (also expected for MgO). However, a considerably lower affnity for Ca2+ would be a definite advantage to avoid corrections. The apparent KD can be changed to some extent by selecting the modulation frequency, shown for MgG. The extension of apparent KD to a large range of ion concentrations can be obtained with probes that are lifetime and spectral (shift in absorption or emission) sensitive on ion binding. Magquin-2 is the only useful magnesium probe that can be used for very low and very high Mg2+ concentration measurements. The appropriate range of measurements can be obtained by selection of excitation wavelength. The possibility of selecting the apparent KD that will be close to the intracellular Mg2+ concentration will allow us not only to increase the accuracy but also to determine small changes in Mg2+ under different stimuli.
Currently, the measurements of intracellular magnesium concentration have been done in cell suspensions where only an averaged signal is recorded from a large number of cells. New opportunity for spatial magnesium imaging is a fluorescence lifetime imaging microscopy (FLIM). MgO with low and mag-quin-2 with a very wide range of apparent affinity to Mg2+ can be successfully used for magnesium imaging using FLIM. By the analogy to Ca2+, one can envisage that areas of localized high or low intracellular magnesium concentrations may exist.
ACKNOWLEDGMENTS
The authors thank Molecular Probes, Inc., for complimentary samples of mag-fura-red and magnesium orange. This work was supported by Grants RR-08119 and RR-07510 from the National Institutes of Health.
3. Abbreviations used:
- APTRA
o-aminophenol-N,N,O-tnacetic acid
- magfura-2
2-(5-carboxyoxazol-2-yl)-5-hydroxy-6-aminobenzofuran-N,N,O-triacetic acid, Furaptra, potassium salt
- mag-fura-5
2-(4-methyl-5-carboxyoxazol-2-yl)-5-hydroxy-6-aminobenzofuran-N,N,O-triacetic acid, potassium salt
- mag-indo-1
2-amino-5-(6-carboxyindol-2-yl)-phenol-N,N,O-triacetic acid, potassium salt
- mag-quin-1
6-methoxy-2-methyl-8-aminoquinoline-N,N-diacetic acid, potassium salt
- mag-quin-2
6-methoxy-8-aminoquinoline-N,N-diacetic acid, potassium salt
- MgG
magnesium green
- MgO
magnesium orange
REFERENCES
- 1.Grubbs RD and Maquire ME (1987) Magnesium 6, 113–127. [PubMed] [Google Scholar]
- 2.Flatrnan PW (1994) Magnesium Transport Across Cell Membranes, CRC Press, Boca Raton, FL. [Google Scholar]
- 3.Flatman PW (1991) Annu. Rev. Physiol 53, 259–271. [DOI] [PubMed] [Google Scholar]
- 4.Flatman PW (1988) J. Physiol 397, 471–487. [DOI] [PMC free article] [PubMed] [Google Scholar]
- 5.Murphy E, Freudenrich CC, and Lieberman M (1991) Annu. Rev. Physiol 53, 273–287. [DOI] [PubMed] [Google Scholar]
- 6.Corkey BE, Duszynski J, Rich TL, Matschinsky B, and Williamson JR (1986) J. Biol. Chem 261, 2567–2574. [PubMed] [Google Scholar]
- 7.London RE (1991) Annu. Rev. Physiol 53, 241–258. [DOI] [PubMed] [Google Scholar]
- 8.Levy LA, Murphy E, Raju B, and London RE (1988) Biochemistry 27, 4041–4048. [DOI] [PubMed] [Google Scholar]
- 9.Gupta RK and Gupta P (1984) Annu. Rev. Biophys. Bioeng 13, 221–246. [DOI] [PubMed] [Google Scholar]
- 10.Haugland RP (1992–1994) in Larisson KD (Ed), Molecular Probes Handbook of Fluorescent Probes and Research Chemicals, Molecular Probes, Eugene, OR, pp. 142–152. [Google Scholar]
- 11.Tsien RY (1980) Biochemistry 19, 2396–2404. [DOI] [PubMed] [Google Scholar]
- 12.Grynkiewicz G, Poenie M, and Tsien RY (1985) J. Biol. Chem 260, 3440–3450. [PubMed] [Google Scholar]
- 13.Raju B, Murphy E, Levy LA, Hall RD, and London RE (1989) Am. J. Physiol 256, C540–548. [DOI] [PubMed] [Google Scholar]
- 14.Morelle B, Salmon J-M, Vigo J, and Viallet P (1993) Photochem Photobiol. 58, 795–802. [Google Scholar]
- 15.Kuhn M (1993) in Czarnik AW (Ed.), Fluorescent Che mosensors for Ion and Molecule Recognition, ACS Symposium Series 538, Washington, DC, pp. 147–161. [Google Scholar]
- 16.Kuhn MA, Hoyland B, Carter S, Zhang C, and Haugland RP (1995) SPIE Press 2388, 238–244. [Google Scholar]
- 17.de Silva AP, Gunaratne HQN, and Maguire EM (1994) J. Chem. Soc. Chem. Commun 1213–1214. [Google Scholar]
- 18.Szmacinski H and Lakowicz JR (1994) in Lakowicz JR (Ed.), Topics in Fluorescence Spectroscopy, Vol. IV Probe Design and Chemical Sensing, Plenum Press, New York, pp. 295–334. [Google Scholar]
- 19.Lakowicz JR, Szrnacinski H, and Johnson ML (1992) J. Fluoresc 2, 47–62. [DOI] [PMC free article] [PubMed] [Google Scholar]
- 20.Szmacinski H and Lakowicz JR (1993) Anal. Chem 65, 1668–1674. [DOI] [PMC free article] [PubMed] [Google Scholar]
- 21.Szmacinski H and Lakowicz JR (1995) Cell Calcium 18, 64–75. [DOI] [PMC free article] [PubMed] [Google Scholar]
- 22.Murphy E, Freudenrich C, Levy LA, London RE, and Lieberman M (1989) Proc. Natl. Acad. sci. USA 86, 2981–2984. [DOI] [PMC free article] [PubMed] [Google Scholar]
- 23.Schachter M, Gallagher KL, and Sever PS (1990) Biochim. Biophys. Acta 1035, 378–380. [DOI] [PubMed] [Google Scholar]
- 24.Rutter GA, Osbaldeston NJ, McCormack JG, and Denton RM (1990) Biochem. J 271, 627–634. [DOI] [PMC free article] [PubMed] [Google Scholar]
- 25.Quamme GA and Rabkin SW (1990) Biochem. Biophys. Res. Commun 167, 1406–1414. [DOI] [PubMed] [Google Scholar]
- 26.Gylfe E (1990) Biochim. Biophys. Acta 1055, 82–86. [DOI] [PubMed] [Google Scholar]
- 27.Jung DW, Apel L, and Brierley GP (1990) Biochemistry 29, 4121–4128. [DOI] [PubMed] [Google Scholar]
- 28.Ng LL, Davies JE, and Garrido MC (1991) Clin. sci 80, 539–547. [DOI] [PubMed] [Google Scholar]
- 29.Konishi M, Nuda N, and Kurihara S (1993) Biophys. J 64, 223–239. [DOI] [PMC free article] [PubMed] [Google Scholar]
- 30.Szmacinski H, Gryczynski I, and Lakowicz JR (1993) Photochem. Photobiol 58, 341–345. [DOI] [PubMed] [Google Scholar]
- 31.Illner H, McGuigan JAS, and Lüthi D (1992) Pßügers Arch. 422, 179–184. [DOI] [PubMed] [Google Scholar]
- 32.BioProbes 17, Molecular Probes, Inc, June 1993. and personal communication. [Google Scholar]
- 33.Laczko G, Gryczynski I, Gryczynski Z, Wiczk W, Malak H, and Lakowicz JR (1990) Rev. Sci. Instrum. 61(9), 2331–2337. [Google Scholar]
- 34.Tsien RY and Pozzan T (1989) Methods Enzymol. 172, 230–261. [DOI] [PubMed] [Google Scholar]
- 35.Lakowicz JR, Laczko G, Cherek H, Gratton E, and Limkeman M (1984) Biophys. J 46, 463–477. [DOI] [PMC free article] [PubMed] [Google Scholar]
- 36.Gratton E, Limkeman M, Lakowicz JR, Maliwal BP, Cherek H, and Laczko G (1984) Biophys. J 46, 479–486. [DOI] [PMC free article] [PubMed] [Google Scholar]
- 37.Lakowicz JR, Szmacinski H, Nowaczyk K, and Johnson ML (1992) Cell Calcium 13, 131–147. [DOI] [PMC free article] [PubMed] [Google Scholar]
- 38.Lattanzio FA Jr., and Bartschat DK (1991) Biochem. Biophys. Res. Commun 177, 184–191. [DOI] [PubMed] [Google Scholar]
- 39.Lakowicz JR, Szmacinski H, Nowaczyk K, Lederer WJ, Kirby MS, and Johnson ML (1994) cell Calcium 15, 7–27. [DOI] [PMC free article] [PubMed] [Google Scholar]
- 40.Becker PL and Fay FS (1986) J. Physiol 253 (Cell Physiol. 22), C613–C618. [DOI] [PubMed] [Google Scholar]
- 41.Stout AL and Axelrod D (1995) Photochem. Photobiol 62, 239–244. [DOI] [PubMed] [Google Scholar]
- 42.Hurley TW, Ryan MP, and Brinck RW (1992) Am. J. Physiol 263 (Cell Physiol. 32), C3300–C3307. [DOI] [PubMed] [Google Scholar]


