Abstract
Real-time quantitative PCR studies largely depend on reference genes for the normalization of gene expression. Stable reference genes should be accurately selected in order to obtain reliable results. We here present a study screening commonly used reference genes (TEF1F, α-centractin, Ctsyn1, GAPDH, R6046, APRT and TUB) in the chytrid fungi Batrachochytrium dendrobatidis (Bd) and Batrachochytrium salamandrivorans (Bsal), which cause the lethal amphibian skin disease chytridiomycosis. We evaluated the stability of the reference gene candidates during different growth stages of the fungi, using different statistical software packages: ΔCT, BestKeeper, GeNorm, NormFinder and RefFinder. In order to reflect the in vivo situation, the stability of the candidates was assessed when taking all growth stages into account. Using an ex-vivo approach, we tested whether the expression of GAPDH, TUB, R6046 and APRT (Bd) and GAPDH, TUB, R6046 and α-centractin (Bsal) remained stable when these fungi came in contact with host tissue. Finally, their role as in vivo reference genes was examined in skin tissue of experimentally infected midwife toads (Alytes obstetricans) (Bd) and fire salamanders (Salamandra salamandra) (Bsal). Summarized, the present study provides guidance for selecting appropriate reference genes when analyzing expression patterns of these fungal organisms during different growth stages and in Bd- or Bsal-infected tissues.
Subject terms: Fungal pathogenesis, Pathogens
Introduction
Batrachochytrium dendrobatidis (Bd) and Batrachochytrium salamandrivorans (Bsal) have been described as the etiological agents of the amphibian fungal skin disease chytridiomycosis, which caused the greatest disease-driven loss of amphibian biodiversity ever documented1–3. Both chytrid fungi infect the amphibian epidermis, residing intracellularly in the host keratinocytes. Although they show highly similar niche occupancy, the pathogenesis markedly differs between both fungi. Bd typically induces epidermal hyperplasia and hyperkeratosis, whereas Bsal induces the formation of skin ulcers. Both processes can lead to severe disturbance of skin functioning (including fluid and electrolyte homeostasis and respiration) and subsequent death4.
Real time quantitative polymerase chain reaction (RT-qPCR) is a widely used technique for relative gene expression analysis and it has been shown to be a powerful tool for analyzing mRNA expression of pathogens during host infection, uncovering fundamentals of host-pathogen interactions5. With the genomes of Bd and Bsal being fully sequenced, RT-qPCR has already shown its added value in pathogenesis research of chytridiomycosis5,6. RT-qPCR results however, largely depend on reference genes which serve as an internal control for standard correction or normalization7,8. Reference gene mRNA expression should be stable, meaning that these genes exhibit little variation in their expression within different samples, and their abundance should be in correlation with the total amounts of mRNA in the sample7. Selecting suitable reference genes is of utmost importance in order to create reliable results and using more than one reference gene is recommended9. Determining reference genes for analyzing fungal gene expression inside host tissue can, however, be challenging. It is difficult to define the amount of pathogen RNA when extracting RNA from an infected tissue. As such, it is tough to determine whether changes in expression are linked to changes in pathogen loads or rather due to instability of the genes.
A thorough screening of reference genes is still lacking in chytrid research. In this study, we therefore examined the stability of 7 reference gene candidates in both Bd and Bsal. These include translation elongation factor 1-alpha (TEF1F), alpha-centractin (α-centractin), cysteinyl tRNA synthetase (Ctsyn1), glyceraldehyde 3-phosphate dehydrogenase (GAPDH), ribosomal protein R6046 (R6046), anthralinate phosphoribosyltransferase (APRT) and beta tubulin (TUB). Using the statistical software packages ΔCT10, GeNorm11, NormFinder12, BestKeeper13 and RefFinder14, we assessed the stability of these candidate reference genes during different growth stages of Bd and Bsal. Subsequently we determined their suitability in host-pathogen research by using an ex-vivo approach and finally, we screened their expression profile and stability in tissues of experimentally infected midwife toads (Alytes obstetricans) and fire salamanders (Salamandra salamandra).
Results and Discussion
Cq variation of Bd and Bsal candidate reference genes during chytrid growth
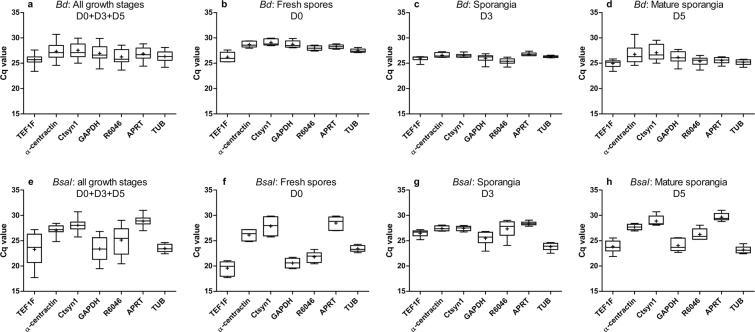
Bd and Bsal growth and infection of amphibian hosts usually involves multiple developmental stages2,15,16. As such, the ideal in vivo reference genes should have a constant expression across different developmental stages of the chytrid fungi. Therefore, we investigated the RT-qPCR expression profiles from seven candidate reference genes during Bd and Bsal growth and determined the Cq values of fresh Bd and Bsal spores at day 0 (D0), sporangia at day 3 (D3) and mature sporangia at day 5 (D5) (Fig. 1). Different ranges of Cq values were found for the different candidate reference genes, with varying standard deviations (Fig. 1 and Supplementary Tables S1–S2).
Figure 1.
Cq values of 7 reference genes in Bd and Bsal. Shown is the variation in the mRNA expression (Cq) of TEF1F, α-centractin, Ctsyn1, GAPDH, R6046, APRT and TUB in (a–d) Bd and (e–h) Bsal at different growth stages with (a,e) a combination of all growth stages (D0 + D3 + D5) (n = 18), (b,f) fresh spores at day 0 (D0) (n = 6), (c,g) sporangia at day 3 (D3) (n = 6) and (d,h) a mature culture at day 5 (D5) (n = 6). The whiskers represent the median, the minimum and maximum values, and the first and third quartiles. A plus (+) indicates the mean cq value.
For Bd, the candidate reference genes showed the least deviation in the spores D0 and sporangia D3 group compared to the mature sporangia at day 5 and a combination of all growth stages, with TUB (D0: 27.49 ± 0.37; D3: 26.32 ± 0.19) and APRT (D0: 28.27 ± 0.40; D3: 26.77 ± 0.33) showing the lowest standard deviation. In the mature sporangia at day 5, TUB (25.19 ± 0.57) and APRT (25.56 ± 0.67) also showed the least deviation compared to the other reference genes and when combining all growth stages together, TUB (26.33 ± 1.04) and APRT (26.87 ± 1.23) were ranked the 2nd and 3rd (Fig. 1a–d and Supplementary Tables S1–S2).
For Bsal, the candidate reference genes showed the least deviation in the sporangia group D3 compared to the other groups, with APRT (D3: 28.40 ± 0.40) showing the lowest standard deviation. In mature sporangia at day 5, α-centractin had the lowest deviation (D5: 27.69 ± 0.61). When examining the spore fraction and a combination of all growth stages, TUB was ranked first (D0: 23.41 ± 0.62; D0 + D3 + D5: 23.47 ± 0.72) (Fig. 1e–h and Supplementary Tables S1–S2).
Expression stability of Bd and Bsal candidate reference genes during chytrid growth using GeNorm
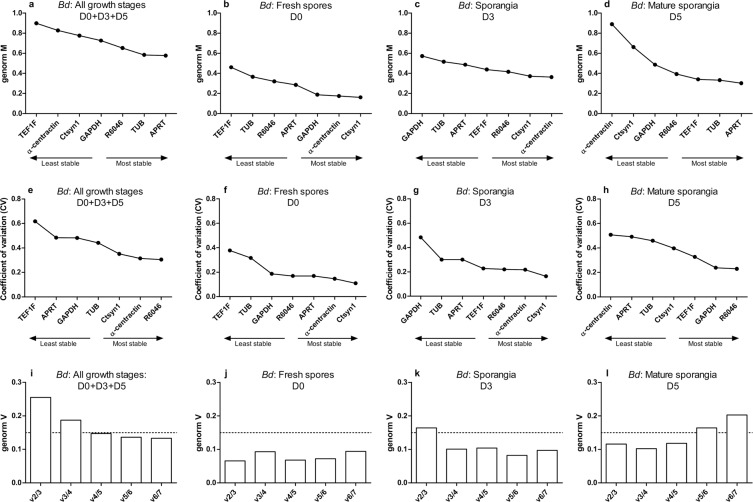
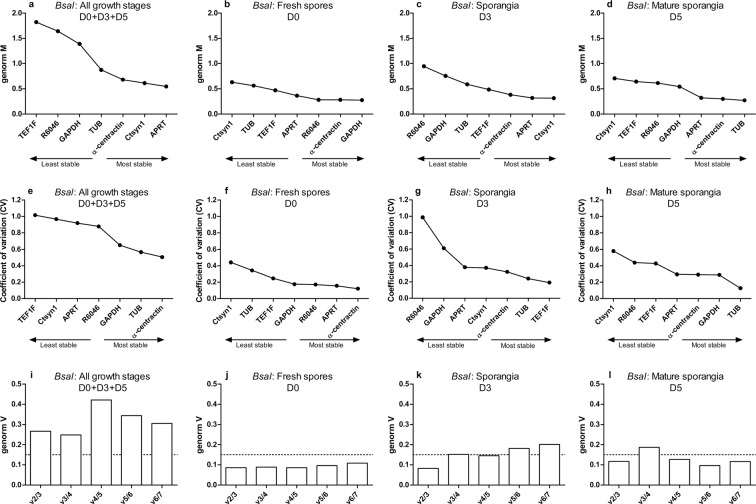
We evaluated the stability of the candidate reference genes during different growth stages of Bd and Bsal using multiple software packages, assessing different aspects of gene stability. Initially, we analysed the Cq data using GeNorm11 (Figs. 2 and 3). GeNorm is based on the expression stability “GeNorm M” value, derived from the average pairwise variation of a potential reference gene set with all other control genes. This means the higher the GeNorm M value, the lower the stability of the reference gene. A coefficient of variation (CV) is also calculated as a relative standard deviation. Ideal reference genes in homogeneous samples, should have an M value ≤ 0.5 and a CV ≤ 0.2, whereas medium reference gene stability (0.5 < M ≤ 1.0) is typically seen in heterogeneous samples17. In both Bd and Bsal, GeNorm M and CV values are the lowest in the spores D0 fraction, reflecting homogeneous samples (Figs. 2b,f and 3b,f).
Figure 2.
GeNorm stability analysis of Bd candidate reference genes. The stability of the genes was assessed during different growth stages with (a,e,i) a combination of all growth stages (D0 + D3 + D5) (n = 18), (b,f,j) fresh spores at day 0 (D0) (n = 6), (c,g,k) sporangia at day 3 (D3) (n = 6) and (d,h,l) a mature culture at day 5 (D5) (n = 6). Genes were ranked based on (a–d) the GeNorm M and (e–h) coefficient of variation (CV) value. (i–l) By pairwise variation (V) analysis, the optimal number of reference genes was determined.
Figure 3.
GeNorm stability analysis of Bsal candidate reference genes. The stability of the genes was assessed during different growth stages with (a,e,i) a combination of all growth stages (D0 + D3 + D5) (n = 18), (b,f,j) fresh spores at day 0 (D0) (n = 6), (c,g,k) sporangia at day 3 (D3) (n = 6) and (d,h,l) mature culture at day 5 (D5) (n = 6). Genes were ranked based on (a–d) the GeNorm M and (e–h) coefficient of variation (CV) value. (i–l) By pairwise variation (V) analysis, the optimal number of reference genes was determined.
Using GeNorm analysis of pairwise variation “V” value, the optimal number of reference genes required for normalization was calculated (Figs. 2i–l and 3i–l). This value is an indication for how much difference it makes when using an extra reference gene for normalization. For example, the V2/3 value represents the pairwise variation of two genes compared to that with three genes, the V3/4 value represents the pairwise variation of three genes compared to that with four genes, and so on. If the added value of adding one more is limited (cut-off: V < 0.15), inclusion of an additional reference gene is not necessary. A such, based on GeNorm, RT-qPCR analyses conducted in chytrid spores should contain Ctsyn1 and α-centractin (Bd: V2/3 < 0.15), or GAPDH and α-centractin (Bsal: V2/3 < 0.15). When working with only 3 day old sporangia, α-centractin, Ctsyn1 and R6046 (Bd: V3/4 < 0.15) or Ctsyn1 and APRT (Bsal: V2/3 < 0.15) should be included. In 5 day old mature sporangia APRT and TUB (Bd: V2/3 < 0.15) or TUB and α-centractin (Bsal: V2/3 < 0.15) provide the best normalization.
In relation to the in vivo situation, a combination of all growth stages could be expected in Bd- or Bsal-infected tissue2,15,16. Therefore, we also analysed what reference genes should be included when working with Bd- or Bsal-infected tissue by taking a combination of all the growth stages into account (spores D0 + sporangia D3 + mature sporangia D5). For Bd, the optimal normalization factor could be calculated from APRT, TUB, R6046 and GAPDH. For Bsal, no optimal number of reference targets could be determined as the variability between sequential normalization factors was relatively high (V > 0.15). However, since the use of multiple (non-optimal) reference targets results in more accurate normalization compared to the use of a single non-validated reference target, we recommend the use of at least 3 reference gene candidates or to screen for additional reference genes. Based on the M-value stability, the targets showed the following ranking: APRT > Ctsyn1 > α-centractin > TUB > GAPDH > R6046 > TEF1F.
Expression stability of Bd and Bsal candidate reference genes during chytrid growth using ΔCT method, BestKeeper, NormFinder and RefFinder
We further analysed reference gene stability using ΔCT method10, BestKeeper13, NormFinder12 and RefFinder14 (Table 1, Supplementary Tables S3–S4). The ΔCT method directly compares relative expression of ‘pairs of genes’ within each sample. The most stable reference genes are associated with the lowest standard deviations of ΔCt when these genes are compared with the other reference genes (Supplementary Tables S3–S4). BestKeeper software evaluates the expression stability of the candidate reference genes based on the standard deviation (SD) of the reference gene Cq values and the coefficient of variation (CV). As a third stability parameter, it calculates the BestKeeper Index from the geometric mean of the remaining reference genes and performs Pearson correlation of each of the reference genes to the BestKeeper index, resulting in a coefficient of correlation (r). Genes with low SD ± CV and high correlation coefficients are the most stable (Supplementary Tables S3–S5). Normally, any studied gene with a SD higher than 1 is considered inconsistent, however, when examining a combination of all developmental stages, including different samples, a low standard deviation for that group was not expected. NormFinder is based on a mathematical model that ranks the candidate reference genes according to their expression stability. This allows the estimation of the overall expression variation of the candidate genes, but also the variations between sample subgroups (e.g. spores day 0 vs sporangia day 3 vs mature sporangia day 5). For each reference gene, a stability value was calculated, taking both intra-and intergroup variations into account (Supplementary Tables S3–S4, Fig. S1). Genes with the lowest stability value are the most stable. In Bd, R6046 and in Bsal, α-centractin, showed the lowest intra- and intergroup variation and can be defined as the most stably expressed reference genes between and within the different developmental stages (Supplementary Fig. S1). TEF1F (Bd and Bsal) showed the highest intergroup variation and can therefore be defined as the least stable candidate.
Table 1.
Comprehensive ranking of reference gene stability.
| D0 + D3 + D5 | rank | GeNorm | RefFinder | D0 | rank | GeNorm | RefFinder |
|---|---|---|---|---|---|---|---|
| M value | Geomean | M value | Geomean | ||||
| Bd | 1 | APRT (0.58) | R6046 (1.86) | Bd | 1 | Ctsyn1 (0.16) | Ctsyn1 (1.50) |
| 2 | TUB (0.58) | APRT (2.63) | 2 | α-centractin (0.18) | α-centractin (2.00) | ||
| 3 | R6046 (0.65) | TUB (2.66) | 3 | GAPDH (0.19) | APRT (3.36) | ||
| 4 | GAPDH (0.73) | GAPDH (3.13) | 4 | APRT (0.29) | R6046 (3.41) | ||
| 5 | Ctsyn1 (0.78) | Ctsyn1 (4.21) | 5 | R6046 (0.32) | TUB (3.83) | ||
| 6 | α-centractin (0.83) | TEF1F (4.30) | 6 | TUB (0.37) | GAPDH (4.61) | ||
| 7 | TEF1F (0.90) | α-centractin (5.73) | 7 | TEF1F (0.46) | TEF1F (7.00) | ||
| Bsal | 1 | APRT (0.55) | α-centractin (1.57) | Bsal | 1 | GAPDH (0.27) | α-centractin (1.86) |
| 2 | Ctsyn1 (0.61) | APRT (2.21) | 2 | α-centractin (0.28) | R6046 (1.86) | ||
| 3 | α-centractin (0.68) | TUB (2.63) | 3 | R6046 (0.28) | GAPDH (2.21) | ||
| 4 | TUB (0.87) | Ctsyn1 (3.16) | 4 | APRT (0.33) | TUB (3.83) | ||
| 5 | GAPDH (1.39) | GAPDH (3.50) | 5 | TEF1F (0.39) | APRT (3.94) | ||
| 6 | R6046 (1.64) | R6046 (6.00) | 6 | TUB (0.46) | TEF1F (5.23) | ||
| 7 | TEF1F (1.82) | TEF1F (7.00) | 7 | Ctsyn1 (0.56) | Ctsyn1 (7.00) | ||
| D3 | rank | GeNorm | RefFinder | D5 | rank | GeNorm | RefFinder |
| M value | Geomean | M value | Geomean | ||||
| Bd | 1 | α-centractin (0.36) | Ctsyn1 (1.32) | Bd | 1 | APRT (0.30) | TUB (2.24) |
| 2 | Ctsyn1 (0.37) | α-centractin (2.11) | 2 | TUB (0.33) | R6046 (2.38) | ||
| 3 | R6046 (0.42) | TEF1F (3.46) | 3 | TEF1F (0.34) | APRT (2.38) | ||
| 4 | TEF1F (0.44) | TUB (3.66) | 4 | R6046 (0.39) | TEF1F (2.71) | ||
| 5 | APRT (0.49) | R6046 (4.12) | 5 | GAPDH (0.49) | GAPDH (2.94) | ||
| 6 | TUB (0.52) | APRT (4.16) | 6 | Ctsyn1 (0.66) | Ctsyn1 (6.00) | ||
| 7 | GAPDH (0.57) | GAPDH (7.00) | 7 | α-centractin (0.89) | α-centractin (7.00) | ||
| Bsal | 1 | Ctsyn1 (0.22) | TEF1F (2.00) | Bsal | 1 | TUB (0.27) | TUB (1.19) |
| 2 | APRT (0.23) | APRT (2.11) | 2 | α-centractin (0.30) | α-centractin (1.57) | ||
| 3 | α-centractin (0.24) | Ctsyn1 (2.51) | 3 | APRT (0.32) | APRT (2.71) | ||
| 4 | TEF1F (0.43) | α-centractin (2.71) | 4 | GAPDH (0.54) | R6046 (4.47) | ||
| 5 | TUB (0.56) | TUB (3.50) | 5 | R6046 (0.61) | GAPDH (5.14) | ||
| 6 | GAPDH (0.75) | GAPDH (6.00) | 6 | TEF1F (0.64) | TEF1F (6.00) | ||
| 7 | R6046 (0.95) | R6046 (7.00) | 7 | Ctsyn1 (0.71) | Ctsyn1 (6.09) |
GeNorm and RefFinder were used to determine reference gene stability in Bd and Bsal spores day 0 (D0) (n = 6), sporangia day 3 (D3) (n = 6), mature sporangia day 5 (D5) (n = 6) and a combination of all life stages (D0 + D3 + D5) (n = 18). Candidate genes were ranked from most stable (1) to least stable (7).
Depending on the algorithm used, varying rankings for Bd and Bsal candidate reference genes were observed (Supplementary Tables S3–S4). Therefore, we applied RefFinder, a tool developed to generate a comprehensive ranking of the most stable reference genes by integrating data obtained by ΔCT, GeNorm, NormFinder and BestKeeper. Using the ranking from each program, RefFinder assigns an appropriate weight to a candidate reference gene and it calculates the geometric mean of their weights for the overall ranking14. The analysis of the comprehensive ranking revealed that indeed R6046, APRT, TUB and GAPDH are the most stably expressed genes throughout all the developmental stages of Bd. For Bsal, slightly deviant results were obtained compared to the results obtained by GeNorm analysis alone, as α-centractin, APRT and TUB instead of Ctsyn1, were shown to be most stably expressed. Also, in the separate growth stages, slight differences were observed between the GeNorm and overall RefFinder ranking (Table 1).
Ex vivo expression analysis of chytrid reference gene candidates in contact with skin tissue
In order to determine whether the targets are suitable as in vivo reference genes, we first analysed whether they stay stably expressed if the fungi come in contact with host skin using an ex vivo approach. Based on the results described above and with relation to the in vivo situation where infected skin tissue comprises different developmental stages of the fungus, we evaluated the stability of GAPDH, TUB, R6046 and APRT for Bd when a standardized amount of the fungus encounters host tissue. In Bsal, Ctsyn1 and APRT were shown to be among the most stably expressed genes in a combination of all growth stages (Fig. 3a), however with an average Cq value of 28.07 ± 1.30 and 28.86 ± 1.02 (Fig. 1e and Supplementary Table S2). This is the highest of all tested targets, making these candidates less suitable as in vivo reference genes. TEF1F was shown to be the least stably expressed gene of all targets tested, with the highest intergroup variation (Table 1 and Supplementary Fig. 1). Therefore, we analysed the stability of GAPDH, TUB, R6046 and α-centractin if host tissue is added to Bsal.
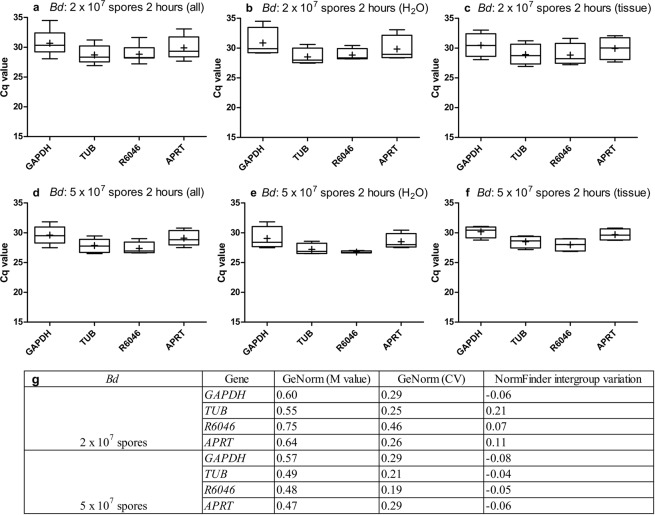
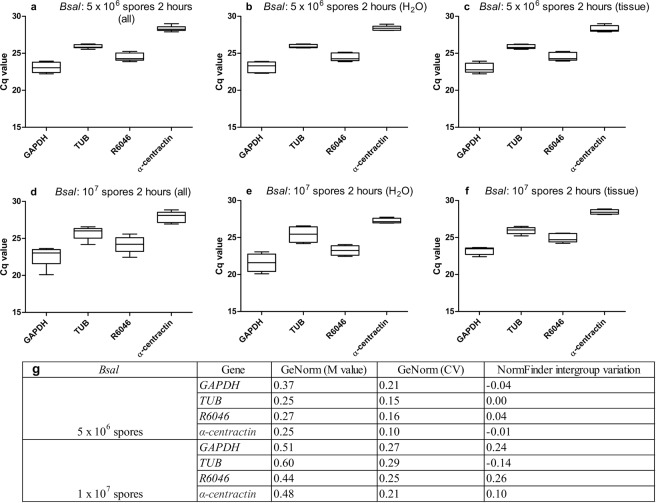
In the groups without skin tissue, only fungal RNA was isolated, whereas in the groups with skin tissue, a combination of fungal and host RNA was isolated. This led to a small variation in Cq values between the groups “with” (Figs. 4c,f and 5c,f) and “without” (Figs. 4b,e and 5b,e) skin tissue (Supplementary Table S1). However, this happened in a standardized way, allowing us to check the stability of the reference genes and whether or not this changed when the spores came in contact with skin. We focused on the results obtained by GeNorm analysis (M and CV value) and the intergroup variation obtained by NormFinder.
Figure 4.
Ex vivo expression analysis of Bd reference gene candidates. Shown is the variation in the mRNA expression (Cq) of GAPDH, TUB, R6046 and APRT in (a–c) 2 × 10⁷ Bd spores and (d–f) 5 × 10⁷ Bd spores that were incubated for 2 hours at 20 °C (c,f) with or (b,e) without skin tissue of midwife toads, or (a,d) a combination of both. Every condition was tested in fourfold. The whiskers represent the median, the minimum and maximum values, and the first and third quartiles. A plus (+) indicates the mean Cq value. (g) GeNorm stability analysis providing a GeNorm M and coefficient of variation (CV) value, combined with NormFinder intergroup variation analysis.
Figure 5.
Ex vivo expression analysis of Bsal reference gene candidates. Shown is the variation in the mRNA expression (Cq) of GAPDH, TUB, R6046 and α-centractin in (a–c) 5 × 10⁶ Bsal spores and (d–f) 1 × 10⁷ Bsal spores that were incubated for 2 hours at 15 °C (c,f) with or (b,e) without skin tissue of fire salamanders, or (a,d) a combination of both. Every condition was tested in fivefold. The whiskers represent the median, the minimum and maximum values, and the first and third quartiles. A plus (+) indicates the mean Cq value. (G) GeNorm stability analysis providing a GeNorm M and coefficient of variation (CV) value, combined with NormFinder intergroup variation analysis.
For Bd at a concentration of 2 × 10⁷ spores, GAPDH, TUB, R6046 and APRT show a medium reference gene stability (0.5 ≤ M ≤ 1.0). When increasing the fungal load and, as a result the proportion of fungal RNA within the mix of host and fungal RNA, TUB, R6046 and APRT even showed a high reference gene stability (M ≤ 0.5) (Fig. 4g). For Bsal at a concentration of 5 × 10⁶ spores, a high reference gene stability (M ≤ 0.5) was observed for GAPDH, TUB, R6046 and α-centractin (Fig. 5g), as well as for R6046 and α-centractin at a Bsal concentration of 107 spores. Despite the fact that we were dealing with mixed host and fungal RNA vs only fungal RNA, NormFinder analysis showed a relatively small intergroup variation for both Bd and Bsal. This indicates that these reference genes stay stably expressed when Bd and Bsal come in contact with host tissue and that they could serve as normalization factors for chytrid-infected skin samples.
Expression profile and stability of chytrid candidate reference genes in experimentally infected amphibians
Based on the above described results, GAPDH, TUB, R6046 and APRT were proposed as candidate reference genes in Bd and GAPDH, TUB, R6046 and α-centractin in Bsal for in vivo normalization. We now analysed whether they indeed could be validated as in vivo reference genes by examining their expression stability in skin tissue of experimentally Bd-infected midwife toads and Bsal-infected fire salamanders and by assessing the expression of target genes.
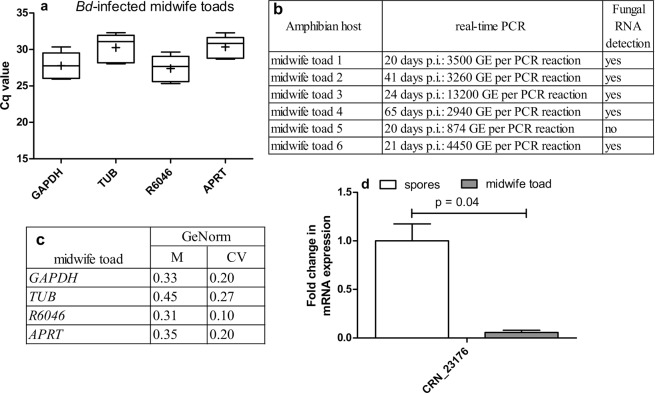
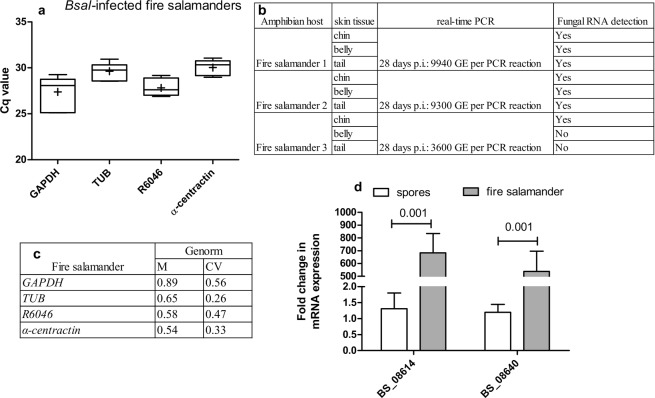
The chytrid loads differed between the different animals. As such, differences in Cq values were expected as a result of differences in pathogen load inside host tissue (Figs. 6a,b and 7a,b). When analyzing intracellular fungal pathogens, there is no straightforward method for separating fungal and host RNA, highlighting the need of good reference genes for the normalization of RT-qPCR data from mixed host-fungi RNA samples. When assessing the stability of Bd candidate reference genes in infected skin tissue of midwife toads using GeNorm, M values ≤ 0.5 (GAPDH, R6046, APRT and TUB) and CV values ≤ 0.2 (GAPDH, R6046, APRT) were observed, indicating high reference gene stability (Fig. 6c). In skin tissue of Bsal-infected fire salamanders a medium reference gene stability was observed (M ≤ 1.0) (Fig. 7c).
Figure 6.
In vivo expression profile and stability of Bd candidate reference genes. Shown is (a) the variation in the mRNA expression (Cq) of GAPDH, TUB, R6046 and APRT in skin tissue (thigh) of experimentally Bd-infected midwife toads (n = 6). The whiskers represent the median, the minimum and maximum values, and the first and third quartiles. A plus (+) indicates the mean Cq value. (b) At euthanasia, different fungal loads were detected in the skin tissues. (c) GeNorm stability analysis providing a GeNorm M and coefficient of variation (CV) value. (d) CRN_23176 mean fold change in mRNA expression profiles. The data shows the normalized target gene quantity in skin tissue from Bd-infected midwife toads, relative to freshly collected spores which is considered 1. The results are presented as means + standard error of the mean (SEM) with significant differences shown by the P value.
Figure 7.
In vivo expression profile and stability of Bsal candidate reference genes. Shown is (a) the variation in the mRNA expression (Cq) of GAPDH, TUB, R6046 and α-centractin in skin (chin, belly and tail) tissue of experimentally Bsal-infected fire salamanders (n = 3). The whiskers represent the median, the minimum and maximum values, and the first and third quartiles. A plus (+) indicates the mean Cq value. (b) At euthanasia, different fungal loads were detected in the skin tissues. (c) GeNorm stability analysis providing a GeNorm M and coefficient of variation (CV) value. (d) BS_08640 and BS_08614 mean fold change in mRNA expression profiles. The data shows the normalized target gene quantities in skin tissue from Bsal-infected Salamandra salamandra, relative to freshly collected spores which is considered 1. The results are presented as means + SEM with significant differences shown by the P value.
To examine the utility of the candidate reference genes, the expression of target genes CRN_23176 (Bd), BS_08640 (Bsal) and BS_08614 (Bsal) was determined using a combination of GAPDH, TUB, R6046 and APRT for Bd and GAPDH, TUB, R6046 and α-centractin for Bsal as normalizers. According to Farrer et al. (2017), the Crinkler and Necrosis gene CRN_23176 is highly expressed during early interaction of Bd with the host, whereas it is less expressed during advanced Bd infection of Tylototriton wenxianensis5. We noticed a significant downregulation of CRN_23176 (p < 0.05) in skin tissue of Bd positive midwife toads compared to spores. This confirms the results by Farrer et al. (2017) in midwife toads as a host and validates the use of GAPDH, TUB, R6046 and APRT as Bd reference genes for in vivo screening of target genes (Fig. 6d)5. BS_08640 and BS_08614 are two target genes with an unknown function, however, using RNA-seq analysis they were shown to be highly expressed in the skin of Bsal-infected Tylototriton wenxianensis animals5. When using GAPDH, TUB, R6046 and α-centractin as reference genes, a significant (p < 0.05) upregulation of both genes of more than 500 times was observed in Bsal-infected skin tissue of fire salamanders, compared to expression levels in spores (Fig. 7d). These results are in line with data described by Farrer et al. (2017), highlighting the utility of the Bsal reference gene candidates and the importance of BS_08640 and BS_08614 during infection of the host with Bsal5.
All too often, only one reference gene or even non-validated reference genes are used in an RT-qPCR setup which can lead to misleading results18. A careful selection of thoroughly validated reference genes prior to performing qPCR experiments is therefore recommended. However, the ideal set of reference genes does not exist, i.e. reference genes whose expression is constant across all cells and tissues. Bd and Bsal are fungal organisms that show changes in expression among isolates19–21, by serial passages in artificial culture medium22 and depending on the amphibian host22. As such, it should be taken into account that these factors and possibly others (e.g. chemical treatment, type of tissue or in vivo-infection conditions) could also affect the stability of the suggested reference genes. Therefore, our results serve as a guide during the Bd and Bsal reference gene hunt but depending on the experimental setup researchers should carefully think out the best normalization strategy.
Summarized, we investigated the stability of suitable reference genes during the development of Bd and Bsal and depending on the growth stage, different combinations of candidate reference genes should be used (Supplementary Table S6). We further focused on defining reference genes that can be used for mRNA expression analysis of infected host tissue and we propose that the optimal in vivo normalization factor can be calculated using GAPDH, TUB, R6046 and APRT for Bd and GAPDH, TUB, R6046 and α-centractin for Bsal (Supplementary Table S6). This study will enhance the accuracy of future RT-qPCR analyses of in vitro, ex vivo and in vivo Bd and Bsal studies.
Methods
Zoospore isolation
Bd and Bsal spores were collected from mature cultures in sterile distilled water. In order to reduce the percentage of mature cells, the water containing the zoospores was passed over a sterile mesh filter with pore size 10 µm (Pluristrainer, PluriSelect). The flow through was used as the zoospore fraction (>90% purity).
In vitro Bd and Bsal culture conditions
The zoospore fraction (3 ml) was seeded in 6-well plates at a density of 2.5 × 10⁵ spores/ml TGhL (1.6% tryptone, 0.4% gelatin hydrolysate and 0.2% lactose in H2O) for Bd and 7.5 × 10⁵ spores/ml TGhL for Bsal. The spores were incubated during 5 days at 20 °C or 15 °C, respectively. RNA was extracted from the Bd and Bsal cultures during different growth stages, namely at day 0 (D0: fresh spores), day 3 (D3: sporangia) and day 5 (D5: mature sporangia containing zoospores). Every condition was tested in sixfold.
Ex vivo Bd and Bsal infection experiments
Testing whether the reference gene candidates stay stable inside infected host tissue, can pose some problems. When extracting RNA from chytrid-infected tissue, there is no straightforward way of determining the amount of fungal RNA inside the pool of host and fungal RNA. Therefore, changes in reference gene expression could be the result of instability of these genes, or from an increase in pathogen load in host tissue. In order to determine whether candidate reference genes indeed stay stable when they come in contact with host tissue, we performed an ex vivo experiment. A standardized amount of spores (Bd: 2 × 10⁷ and 5 × 10⁷; Bsal: 5 × 10⁶ and 1 × 10⁷) were incubated for 2 hours in H2O with skin tissue of a chytrid-susceptible amphibian (Bd: midwife toad; Bsal: fire salamander), collected with a skin biopsy punch (6 mm)2,23–26. As a control, we included Bd and Bsal zoospores that were incubated without tissue. All samples were incubated for 2 hours at 20 °C or 15 °C, respectively, after which RNA was extracted. Every condition was tested in fourfold (Bd) or fivefold (Bsal).
In vivo Bd and Bsal infection experiments
This study was carried out in strict accordance with the recommendation in the European Convention for the Protection of Vertebrate Animals used for Experimental and other Scientific Purposes. Animal experiments were performed with the approval of the ethical committee of the Faculty of Veterinary Medicine (Ghent University 2016/120 and 2016/55). All animals used were clinically healthy and free of Bd and Bsal as assessed by sampling the skin using cotton-tipped swabs and subsequent performing qPCR. All animals were acclimatized for 1 week before the onset of the experiments. The animals were housed individually at 15 ± 1 °C on moist tissue, with access to a hiding place and they were fed daily.
In a first experiment, six captive bred midwife toads were exposed to 1 ml of 106 Bd spores per ml water for 24 h at 15 ± 1 °C. Animals were followed up by clinical examination and the infection load was followed up weekly by taking swabs on which we performed qPCR. The animals were euthanized when clinical symptoms were observed (e.g. lethargy, loss of appetite, weight reduction). A part of the skin (10 mg: thigh) was stored in RNA later for 24 h and subsequently stored at −70 °C. Skin samples for histopathology were stored in formalin.
In a second experiment, three captive bred fire salamanders were exposed to 1 ml of 103 Bsal spores per ml water for 24 hours at 15 ± 1 °C. The animals were swabbed and euthanized at day 28 post-infection. A part of the skin (10 mg: belly, chin and tail) was stored in RNA later for 24 h and subsequently stored at −70 °C. Skin samples for histopathology were stored in formalin.
RNA extraction and cDNA synthesis
Using the RNeasy mini kit (Qiagen), total RNA was isolated from in vitro Bd and Bsal cultures, ex vivo Bd and Bsal-infected skin samples and in vivo Bd and Bsal-infected skin samples. The RNA concentration was measured by absorbance at 260 nm using a nanodrop spectrophotometer and the quality of the RNA samples was checked using an Experion RNA StdSens Analysis kit (Bio-Rad). Total RNA (500 ng) was reverse transcribed to cDNA with the iScript cDNA synthesis kit (Bio-Rad) and cDNA was stored at −20 °C until further use.
Reference genes and primer design
Bd and Bsal primers for α-centractin, R6046, TEF1F and GAPDH were used from previously published data5. Bd and Bsal primers for APRT, Ctsyn1 and TUB were designed using Primer3plus (Supplementary Table S7). The specificity of each primer set was checked by nucleotide blast and by performing a standard PCR (40 cycles) on Bd and Bsal cDNA (diluted 1:5), followed by gel electrophoresis. The PCR products were checked on an agarose gel (1.5%) and single band amplification was confirmed (Supplementary Figs. S2–S3). Primer efficiency was evaluated by performing real-time quantitative PCR reactions on serial dilutions of a cDNA mix from the in vitro samples (1:5, 1:25, 1:125; 1:625). For every standard curve, we assessed the amplicon efficiency (E), correlation coefficients (R2) and slope (Supplementary Table S7). Water and no-template controls were used as negative controls for each primer set. Melting curves were analysed and for all primer pairs a single peak was detected (Supplementary Figs. S4-S5).
RT-qPCR analysis and data analysis
Real-time quantitative PCR reactions were run in duplicate and the reactions were performed in 10 μl volumes using the iQ SYBR Green Supermix (Bio-Rad) and 1 µl 1/5 diluted cDNA. The experimental protocol for PCR (40 cycles) was performed on a CFX384™ RT-qPCR System with a C1000 Thermal Cycler (Bio-Rad, Hercules). The results were analysed using the Bio-Rad CFX manager 3.1. Quantification cycle (Cq) values were obtained using auto baseline settings and they were applied per primer set. The threshold for maximum Cq difference between the technical replicates was set to 0.5. We used different statistical algorithms to assess the stability of the candidate reference genes. Therefore, the RT-qPCR data obtained were exported into an Excel datasheet and the raw Cq values (Supplementary Table S1) were used directly for analysis in Qbase (GeNorm)17, BestKeeper13 and the ΔCT method10. For NormFinder analysis12, the raw Cq values were converted into relative quantities using the formula Q = E−ΔCq, with E = amplification efficiency and ΔCq = the corresponding Cq value – minimum Cq. The RefFinder tool integrates the data obtained from GeNorm, BestKeeper, ΔCT and NormFinder analysis and calculates a comprehensive ranking order14. All the software packages were used according to the manufacturer’s instructions.
Validation of in vivo reference genes by expression analysis of target genes
The Bd Crinkler and Necrosis gene CRN_23176 and Bsal in vivo genes BS_08640 and BS_08614, were used as target genes to analyse the usefulness of the selected candidate reference genes5. The results are shown as fold changes of mRNA expression, which were calculated based on the CNRQ values obtained in qBase. Statistics were performed using SPSS version 25 (SPSS Inc., Chicago, IL, USA), by performing a non-parametric Kruskal-Wallis analysis on the CNRQ values, with significance set to p < 0.05.
Supplementary information
Acknowledgements
This work was supported by the Research Foundation Flanders (FWO grants 12E6616N and 1507119N). The technical assistance of Mark Greener is greatly appreciated. We also would like to thank Alexandra Laking for her diligent proofreading of the manuscript.
Author contributions
E.V. performed the experimental work. E.V., A.M., and F.P. conceived the study, participated in its design and coordination. E.V., A.M. and F.P. co-drafted the manuscript. All authors read and approved the final manuscript.
Data availability
All data generated or analysed during this study are included in this published article and its Supplementary Information Files.
Competing interests
The authors declare no competing interests.
Footnotes
Publisher’s note Springer Nature remains neutral with regard to jurisdictional claims in published maps and institutional affiliations.
Supplementary information
is available for this paper at 10.1038/s41598-019-54582-4.
References
- 1.Longcore JE, Pessier AP, Nichols DK. Batrachocytrium dendrobtidis gen. et sp. nov., a chytrid pathogenic to amphibians. Mycologia. 1999;91:219–227. doi: 10.1080/00275514.1999.12061011. [DOI] [Google Scholar]
- 2.Martel A, et al. Batrachochytrium salamandrivorans sp. nov. causes lethal chytridiomycosis in amphibians. P. Natl. Acad. Sci. USA. 2013;110:15325–15329. doi: 10.1073/pnas.1307356110. [DOI] [PMC free article] [PubMed] [Google Scholar]
- 3.Scheele, B. C. et al. Amphibian fungal panzootic causes catastrophic and ongoing loss of biodiversity. Science363, 1459–1463 (2019). [DOI] [PubMed]
- 4.Van Rooij P, Martel A, Haesebrouck F, Pasmans F. Amphibian chytridiomycosis: a review with focus on fungus-host interactions. Vet. Res. 2015;46:137. doi: 10.1186/s13567-015-0266-0. [DOI] [PMC free article] [PubMed] [Google Scholar]
- 5.Farrer R, et al. Genomic innovations linked to infection strategies across emerging pathogenic chytrid fungi. Nat. Commun. 2017;8:14742. doi: 10.1038/ncomms14742. [DOI] [PMC free article] [PubMed] [Google Scholar]
- 6.Rosenblum EB, Stajich JE, Maddox N, Eisen MB. Global gene expression profiles for life stages of the deadly amphibian pathogen Batrachochytrium dendrobatidis. P. Natl. Acad. Sci. USA. 2008;105:17034–17039. doi: 10.1073/pnas.0804173105. [DOI] [PMC free article] [PubMed] [Google Scholar]
- 7.Bustin SA, et al. The MIQE guidelines: minimum information for publication of quantitative real-time PCR experiments. Clin. Chem. 2009;55:611–622. doi: 10.1373/clinchem.2008.112797. [DOI] [PubMed] [Google Scholar]
- 8.Bustin SA, Nolan T. Talking the talk, but not walking the walk: RT-qPCR as a paradigm for the lack of reproducibility in molecular research. Eur. J. Clin. Invest. 2017;47:756–774. doi: 10.1111/eci.12801. [DOI] [PubMed] [Google Scholar]
- 9.Bustin SA, Wittwer CT. MIQE: A Step Toward More Robust and Reproducible Quantitative PCR. Clin. Chem. 2017;63:1537–1538. doi: 10.1373/clinchem.2016.268953. [DOI] [PubMed] [Google Scholar]
- 10.Silver N, Best S, Jiang J, Thein SL. Selection of housekeeping genes for gene expression studies in human reticulocytes using real-time PCR. BMC Mol. Biol. 2006;7:33. doi: 10.1186/1471-2199-7-33. [DOI] [PMC free article] [PubMed] [Google Scholar]
- 11.Vandesompele, J. et al. Accurate normalization of real-time quantitative RT-PCR data by geometric averaging of multiple internal control genes. Genome Biol. 3, research 0034.1–0034.1 (2002). [DOI] [PMC free article] [PubMed]
- 12.Andersen CL, Jensen JL, Orntoft TF. Normalization of real-time quantitative reverse transcription-PCR data: A model-based variance estimation approach to identify genes suited for normalization, applied to bladder and colon cancer data sets. Cancer Res. 2004;4:5245–5250. doi: 10.1158/0008-5472.CAN-04-0496. [DOI] [PubMed] [Google Scholar]
- 13.Pfaffl MW, Tichopad A, Prfomet C, Neuvians TP. Determination of stable housekeeping genes, differentially regulated taret genes and sample integrity: BestKeeper-Excel-based tool using pair-wise correlations. Biotechnol. Lett. 2004;26:509–515. doi: 10.1023/B:BILE.0000019559.84305.47. [DOI] [PubMed] [Google Scholar]
- 14.Xie F, Xiao P, Chen D, Xu L, Zhang B. miRDeepFinder: a miRNA analysis tool for deep sequencing of plant small RNAs. Plant Mol. Biol. 2012;80:75–84. doi: 10.1007/s11103-012-9885-2. [DOI] [PubMed] [Google Scholar]
- 15.Berger L, Hyatt AD, Speare R, Longcore JE. Life cycle stages of the amphibian chytrid Batrachochytrium dendrobatidis. Dis. Aquat. Organ. 2005;68:51–63. doi: 10.3354/dao068051. [DOI] [PubMed] [Google Scholar]
- 16.Van Rooij P, et al. Germ tube mediated invasion of Batrachochytrium dendrobatidis in amphibian skin is host dependent. Plos One. 2012;7:e41481. doi: 10.1371/journal.pone.0041481. [DOI] [PMC free article] [PubMed] [Google Scholar]
- 17.Hellemans J, Mortier G, De Paepe A, Speleman F, Vandesompele J. qBase relative quantification framework and software for management and automated analysis of real-time quantitative PCR data. Genome Biol. 2007;8:R19. doi: 10.1186/gb-2007-8-2-r19. [DOI] [PMC free article] [PubMed] [Google Scholar]
- 18.Verbrugghe E, Martel A, Pasmans F. Reference Gene Validation for Quantitative Real-Time PCR Studies in Amphibian Kidney-Derived A6 Epithelial Cells. ATLA-Alter. Lab. Anim. 2019;47:63–70. doi: 10.1177/0261192919862936. [DOI] [PubMed] [Google Scholar]
- 19.Farrer RA, et al. Multiple emergences of genetically diverse amphibian-infecting chytrids include a globalized hypervirulent recombinant lineage. P. Natl. Acad. Sci. USA. 2011;108:18732–18736. doi: 10.1073/pnas.1111915108. [DOI] [PMC free article] [PubMed] [Google Scholar]
- 20.O’Hanlon SJ, et al. Recent Asian origin of chytrid fungi causing global amphibian declines. Science. 2018;360:621–627. doi: 10.1126/science.aar1965. [DOI] [PMC free article] [PubMed] [Google Scholar]
- 21.Schloegel LM, et al. Novel, panzootic and hybrid genotypes of amphibian chytridiomycosis associated with the bullfrog trade. Mol. Ecol. 2012;21:5162–5177. doi: 10.1111/j.1365-294X.2012.05710.x. [DOI] [PubMed] [Google Scholar]
- 22.Ellison AR, DiRenzo GV, McDonald CA, Lips KR, Zamudio KR. First in Vivo Batrachochytrium dendrobatidis Transcriptomes Reveal Mechanisms of Host Exploitation, Host-Specific Gene Expression, and Expressed Genotype Shifts. G3-Genes Genom. Genet. 2017;7:269–278. doi: 10.1534/g3.116.035873. [DOI] [PMC free article] [PubMed] [Google Scholar]
- 23.Bosch J, Martínez-Solano I, García-París M. Evidence of a chytrid fungus infection involved in the decline of the common midwife toad (Alytes obstetricans) in protected areas of central Spain. Biol. Conserv. 2001;97:331–337. doi: 10.1016/S0006-3207(00)00132-4. [DOI] [Google Scholar]
- 24.Pasmans F, et al. Chytridiomycosis related mortality in a midwife toad (Alytes obstetricans) in Belgium. Vlaams Diergen. Tijds. 2010;79:460–462. [Google Scholar]
- 25.Walker SF, et al. Factors driving pathogenicity vs. prevalence of amphibian panzootic chytridiomycosis in Iberia. Ecol. Lett. 2010;13:372–382. doi: 10.1111/j.1461-0248.2009.01434.x. [DOI] [PubMed] [Google Scholar]
- 26.Martel A, et al. Recent introduction of a chytrid fungus endangers Western Palearctic salamanders. Science. 2014;346:630–631. doi: 10.1126/science.1258268. [DOI] [PMC free article] [PubMed] [Google Scholar]
Associated Data
This section collects any data citations, data availability statements, or supplementary materials included in this article.
Supplementary Materials
Data Availability Statement
All data generated or analysed during this study are included in this published article and its Supplementary Information Files.


