

Abstract
Background
DNA methylation is implicated in many chronic diseases and may contribute to mortality. Therefore, we conducted an epigenome‐wide association study (EWAS) for all‐cause mortality with whole‐transcriptome data in a cardiovascular cohort (CATHGEN [Catheterization Genetics]).
Methods and Results
Cases were participants with mortality≥7 days postcatheterization whereas controls were alive with≥2 years of follow‐up. The Illumina Human Methylation 450K and EPIC arrays (Illumina, San Diego, CA) were used for the discovery and validation sets, respectively. A linear model approach with empirical Bayes estimators adjusted for confounders was used to assess difference in methylation (Δβ). In the discovery set (55 cases, 49 controls), 25 629 (6.5%) probes were differently methylated (P<0.05). In the validation set (108 cases, 108 controls), 3 probes were differentially methylated with a false discovery rate–adjusted P<0.10: cg08215811 (SLC4A9; log2 fold change=−0.14); cg17845532 (MATK; fold change=−0.26); and cg17944110 (castor zinc finger 1 [CASZ1]; FC=0.26; P<0.0001; false discovery rate–adjusted P=0.046–0.080). Meta‐analysis identified 6 probes (false discovery rate–adjusted P<0.05): the 3 above, cg20428720 (intergenic), cg17647904 (NCOR2), and cg23198793 (CAPN3). Messenger RNA expression of 2 MATK isoforms was lower in cases (fold change=−0.24 [P=0.007] and fold change=−0.61 [P=0.009]). The CASZ1,NCOR2, and CAPN3 transcripts did not show differential expression (P>0.05); the SLC4A9 transcript did not pass quality control. The cg17944110 probe is located within a potential regulatory element; expression of predicted targets (using GeneHancer) of the regulatory element, UBIAD1 (P=0.01) and CLSTN1 (P=0.03), were lower in cases.
Conclusions
We identified 6 novel methylation sites associated with all‐cause mortality. Methylation in CASZ1 may serve as a regulatory element associated with mortality in cardiovascular patients. Larger studies are necessary to confirm these observations.
Keywords: cardiac biomarkers, epigenetics, mortality, outcome, transcriptome
Subject Categories: Biomarkers, Pathophysiology, Translational Studies, Epigenetics, Gene Expression & Regulation
Clinical Perspective
What Is New?
Six novel differentially methylated CpG loci were found to be associated with all‐cause mortality in a cardiovascular cohort.
Differential methylation in CASZ1 may serve as a genomic regulatory element associated with increased risk of death in cardiovascular patients.
What Are the Clinical Implications?
Differentially methylated loci may serve as potential biomarkers for patient risk stratification.
Cardiovascular disease is the greatest cause of morbidity and mortality in the United States and worldwide.1, 2 Clinical factors, some biomarkers, and genetic factors predict incident cardiovascular events and mortality in secondary prevention patients.3, 4, 5 However, the ability to predict these adverse events and to understand the biology underlying this risk is incomplete. Epigenetic studies provide an opportunity to simultaneously identify biomarkers of disease risk and causal biological pathways, while integrating underlying genetic variation with clinical and environmental risk factors.
The evolution of high‐throughput technologies has enabled comprehensive assessments including epigenome‐wide association studies (EWAS) by assessing methylation patterns at a genomic scale.6 EWAS in many diseases have identified biological mechanisms and unexplained heritability. They have established relationships between methylation signatures and a number of phenotypes, including, but not limited to, cancer,7, 8 coronary artery disease (CAD),9 obesity,10 and all‐cause mortality.11, 12 However, to our knowledge, there have been no EWAS for incident mortality in a cardiovascular cohort.
Epigenetic modifications play physiological13 and pathophysiological7, 8 roles in phenotypic outcomes. Methylation of cytosine in CpG dinucleotides alters chromatin structure and typically suppresses gene transcription. Given the capacity of environmental exposures to alter gene expression by epigenetic mechanisms, nonphysiological alteration of DNA methylation has the potential to contribute to disease and, ultimately, mortality.11, 12, 14 However, the specific biological mechanisms by which DNA methylation signatures are associated with mortality remain poorly understood. We conducted an EWAS to identify differentially methylated loci predicting mortality in a secondary prevention cardiovascular cohort, CATHGEN (Catheterization Genetics).15
Methods
The data that support the findings of this study are available from the corresponding author upon reasonable request.
Study Population
The CATHGEN biorepository consists of sequential patients undergoing cardiac catheterization at Duke from 2001 to 2010 and has been described in detail previously.15 Blood samples were collected from a femoral arterial catheter before administration of supplemental heparin and immediately processed for whole blood and plasma and frozen at −80°C within a few hours. Cases were defined as subjects with mortality at any time at or >7 days postcatheterization (to avoid procedure‐related deaths). Controls were comprised of CATHGEN individuals alive at the time of last known follow‐up with a minimum of 2 years of follow‐up and who had no subsequent interventional cardiac procedure, coronary bypass grafting, or myocardial infarction. Samples were selected in 2 sets to create a discovery and validation cohort. For each set, we prioritized available cases with the shortest time to death (to enhance potential genetic/epigenetic factors); controls were matched to cases based on genetic ancestry (African or European), sex, age, and ejection fraction (EF). After matching and accounting for quality control (QC) of DNA, the cases and controls were not perfectly matched on these risk factors and thus these variables were also included in multivariable adjusted models.
The CATHGEN study was approved by the Duke University Institutional Review Board and participants provided written consent.
Epigenetic Profiling
Sample QC
Samples were quantified using the Quant‐iT PicoGreen dsDNA reagent in a 96‐well plate format (Life Technologies, Grand Island, NY). We used a modified version of the Life Technologies Quant‐iT PicoGreen dsDNA protocol designed by the DNA Bank at the Center for Human Genetics (Duke University, Durham, NC) found in Data S1.
DNA quality was assessed by gel electrophoresis similar to those outlined by Chen et al.16 All samples were scored on a 0 to 5 scale; all samples used for the genotyping protocol scored a 3 to 5 on the grading scale. See Data S1 for grading scale descriptions (Duke University, Durham, NC).
Bisulfite conversion
Bisulfite conversion of CATHGEN DNA was carried out using the manufacturer's recommendations. Briefly, 500 ng was bisulfite treated using a Zymo EZ DNA Methylation kit (catalog number: D5001; Zymo Research, Irvine, CA) using PCR conditions for Illumina's Infinium Methylation assay (95°C for 30 seconds, 50°C for 60 minutes×16 cycles).
Methylation study
Methylation data from the discovery cohort were generated using the Illumina HumanMethylation450 DNA Analysis Beadchip (catalog number: WG‐314‐1001; Illumina, San Diego, CA), with validation data that were produced using the Illumina Infinium MethylationEPIC BeadChips (catalog number: WG317‐1001; Illumina), given that the 450K chips were no longer manufacturered. Briefly, a total of 4 μL of bisulfite converted DNA was hybridized to Illumina BeadChips using the manufacturer's protocols. Samples were denatured and amplified overnight for 20 to 24 hours. Fragmentation, precipitation, and resuspension of the samples followed overnight incubation, before hybridization to 450 or EPIC BeadChips for 16 to 24 hours. BeadChips were then washed to remove any unhybridized DNA and labeled with nucleotides to extend the primers to the DNA sample. Following the Infinium HD Methylation protocol, the BeadChips were imaged using the Illumina iScan system (Illumina).
Methylation Preprocessing and QC
For both the discovery and validation sets, raw .idat files were read and preprocessed using the R package, minfi.17, 18 Each data set was preprocessed using noob for background subtraction and dye‐bias normalization, followed by stratified quantile normalization. All methylation values with detection P>0.01 were set to missing, then probes with >1% missing values were removed from further analysis. Cell‐mixture distributions were estimated using the Houseman method19 as implemented in minfi.20 All samples were checked for concordance between reported sex and predicted sex from the methylation data, excessive missing data (>1%), unusual cell mixture estimates, and outlying control probe measurements. Finally, probes were filtered using functions implemented in the DMRcate package21, 22, 23 if the probe's CpG site was within 2 base pairs of a common single‐nucleotide polymorphism (minor allele frequency, >5%), the probe was reported to cross‐hybridize in multiple locations or if the probe was located on the X or Y chromosome.
Each methylation data set was examined for potential batch effects using principal components calculated using the 20 000 most variable probes. The first 7 principal components were examined for association with plate effects during bisulfite conversion, methylation array, and row. Principal components were visualized on plots and tested for association with potential batches using linear models.
Statistical Analysis
To assess for differential methylation between cases and controls in each set of samples separately (discovery and validation), a linear model approach with empirical Bayes estimators, as implemented in limma,24, 25 was used. The resulting regression coefficients for the linear models are reported in these analyses as log2 fold change (negative when methylation is lower in cases than controls and positive when methylation is higher in cases than controls). Methylation was measured using , where β is the estimated proportion of cells methylated at a given CpG. Models were adjusted for age, ancestry (European versus African), sex, EF (the left ventricular ejection fraction measured by echocardiography), CAD, estimated cell type proportions, plate, and methylation array row. All probes with nominal P<0.05 (ie, adjusted for covariables, unadjusted for multiple comparisons) in the discovery set were then tested for differential methylation in the validation set and considered to be differentially methylated if the false discovery rate (FDR)‐adjusted P value26 was <0.10. We chose a liberal P value for the discovery set to generate a more expansive set of results, but chose a more conservative P value adjusted for multiple comparisons in the validation cohort to avoid type 1 error. We used METAL27 to conduct a meta‐analysis of P values from the discovery and validation experiments, using an FDR‐adjusted P‐value cutoff of 0.05 to determine significance, given the lack of a separate validation set in this analysis. We tested for differential expression of candidate genes and potential target genes in the combined set of samples (discovery and validation) using a linear model, adjusting for age, ancestry, sex, and expression batch (regression coefficients for the linear models, is reported as log2 fold change). Results from this meta‐analysis were also used in an over‐representation analysis of both Gene Ontology and Kyoto Encyclopedia of Genes and Genomes (KEGG) gene sets using the gometh function from the missMethyl 28 package in R, and the default significance cutoff of P<0.001.The approach uses a modified version of the hypergeometric test that takes into account the probability of each gene being selected, based on the number of CpG sites tested in the gene.
Probes that were only present in either the discovery or validation set (ie, the set of probes present on the 450K chip or on the EPIC chip, but not on both) were considered as a separate exploratory experiment, with no validation set available. These probes were considered potentially differentially methylated if the FDR‐adjusted P value was <0.10.
Testing for differentially methylated regions (DMRs) was performed using comb‐p,29 which uses P values and chromosomal locations as input. The algorithm adjusts P values according to their correlation with neighboring P values, then identifies regions of low P values using parameters seed (threshold necessary to start identification of a region) and dist (distance to look for neighboring P values also below the threshold). Once regions are defined, a P value is calculated for each using the Sidak correction.30 We used parameters found in previous work to maximize the area under the precision‐recall curve.31 We set seed=0.05 and dist=750 and counted regions as DMRs if the correction region‐based P value was <0.05. Similar to the probe‐based approach, results from this meta‐analysis were used in an over‐representation analysis of both Gene Ontology and KEGG gene sets using the preranked tool in gene set enrichment analysis.32
Gene Expression Profiling
Gene expression profiling was previously described in detail in an earlier work.33 In brief, RNA was initially purified using Qiagen PaxGene Blood RNA MDx Kits in PAXgene tubes containing whole blood. The Illumina TotalPrep RNA amplification kit (Life Technologies) was then used to biotinylate the RNA. Afterward, quantity and quality of the RNA were assessed using the Quant‐iT RiboGreen RNA Assay Kit and Bioanalyzer RNA Nano chip assay (Agilent, Santa Clara, CA), respectively. Expression data from the Human HT‐12v3 Expression BeadChip (Illumina) were used for assessment of the genes of interest. QC was carried out using the Illumina Genome Studio software, and probes detected in >50% of samples and that had a detection P<0.05 were utilized. Plate, nested chip, and sample effects were also assessed using variance components and principal components analyses, and outliers at each level were excluded. Robust multichip average methods were used to log2 transform and quantile normalize the expression data.
Results
Baseline Characteristics
Baseline characteristics of the CATHGEN discovery and validation cohorts are summarized in Table 1. Cases and controls were similar with regard to age, sex, ancestry, EF, body mass index, smoking history, as well as presence of CAD. The mean EF is lower in the discovery set; this is most likely because of the discovery set having been ascertained first where cases were prioritized based on the shortest time to death. Highlighting the separation of these 2 groups, within each set, there is no overlap between time‐to‐event (cases) and last follow‐up (controls). In the discovery set, cases died a median of 141 days (interquartile range [52, 355]; range, 8–527) after their cardiac catheterization procedure, whereas all controls had at least 2138 days of event‐free follow‐up (median, 2981; interquartile range [2734, 3293]). In the validation set, the median time‐to‐event for cases was 1500 days (interquartile range [1054, 1872]; range, 563–2346), whereas all controls had at least 2803 days of event‐free follow‐up (median, 3017; interquartile range [2939, 3303]). Although we focused on all‐cause mortality as a primary phenotype (as is often performed in clinical trials of cardiovascular secondary prevention patients), 53% of the discovery and 30% of the validation cohort were definitively adjudicated to be attributed to cardiovascular causes. In contrast, the remaining individuals were a combination of noncardiac medical, unspecified, and other causes. Given the high prevalence of CAD in this sample (70–71%) and the fact that cardiovascular disease is the most common cause of death,2 the majority of the remaining deaths are assumed to be cardiovascular in origin.
Table 1.
Baseline Characteristics of Participants
| Discovery | Validation | |||
|---|---|---|---|---|
| Cases (N=55) | Controls (N=49) | Cases (N=108) | Controls (N=108) | |
| Age, mean (SD), y | 66.8 (11.4) | 66.2 (10.1) | 69.3 (10.1) | 67.8 (9.4) |
| European ancestry, n (%) | 45 (81.8) | 41 (83.7) | 93 (86.1) | 91 (84.3) |
| Female, n (%) | 17 (30.9) | 17 (34.7) | 41 (38.0) | 41 (38.0) |
| Diabetes mellitus, n (%) | 25 (45.5) | 9 (18.4) | 34 (31.5) | 29 (26.9) |
| Dyslipidemia, n (%) | 28 (50.9) | 30 (61.2) | 71 (65.7) | 58 (53.7) |
| History of smoking, n (%) | 27 (49.1) | 27 (55.1) | 53 (49.1) | 53 (49.1) |
| BMI, mean (SD) | 27.6 (5.8) | 27.8 (6.0) | 29.0 (7.0) | 29.9 (5.8) |
| Ejection fraction, median [IQR] | 49.0 [33.3, 55.6] | 50.0 [35.0, 60.5] | 55.9 [52.9, 65.2] | 60.0 [55.0, 68.5] |
| Coronary artery disease, n (%) | 43 (78.2) | 35 (71.4) | 77 (71.3) | 71 (65.7) |
| Time to death (cases) or last follow‐up (controls), median [IQR], days | 141.0 [51.5, 355.0] | 2981.0 [2734.0, 3293.0] | 1500.5 [1053.8, 1872.0] | 3017.0 [2939.0, 3303.0] |
BMI indicates body mass index; IQR, interquartile range.
EWAS Results: Discovery and Validation of Differentially Methylated Probes
In the discovery cohort, 1715 probes (0.35%) had >1% missing values and were removed, whereas 8678 probes (1.0%) were removed from the validation set. After removing cross‐hybridizing probes, probes near common single‐nucleotide polymorphisms, and nonautosomal probes, we retained 426 122 probes for analysis in the discovery set and 790 644 probes in the validation set. A total of 397 024 probes present on both versions of the Illumina Infinium methylation array were available for analysis in both sample sets. After examining distributions of estimated cell‐type proportions and Illumina control probes during QC, we removed 2 samples from the validation set that were extreme outliers. There were no mismatches between predicted and reported sex in either set, and all samples had <0.6% missing probes, so no other samples were removed during QC.
In the discovery cohort, 25 629 (6.5%) were differently methylated between cases and controls (nominal P<0.05) using a model adjusted for age, ancestry, sex, EF, CAD, estimated cell‐type proportions, plate, and methylation array row. These probes were carried forward as candidates to be tested in the validation samples. In the validation set, 3 of the probes validated (at an FDR‐adjusted P<0.10): cg08215811 within intron 15 of solute carrier family 4 member 9 (SLC4A9); cg17845532 within the promoter region of megakaryocyte‐associated tyrosine kinase (MATK); and cg17944110 in the 5′ untranslated region exon 1 of castor zinc finger 1 (CASZ1; Table 2). Using a more‐conservative FDR‐adjusted P<0.05, only cg17845532 would be significant. Each of the 3 validated probes had relatively small observed Δβ values, but displayed consistent directions of effect in the discovery and validation cohorts. The methylation levels for the 3 probes were approximately normally distributed, with no outliers. We also conducted a sensitivity analysis that included body mass index and smoking in the model, and the same 3 probes met our significance criteria. Analysis of the methylation probes present only on the 450K array (discovery cohort, 29 098) or EPIC (validation cohort, 393 620) did not identify any significant differentially methylated probes between cases and controls using an FDR‐adjusted P<0.10. Given the sample size, we also conducted a meta‐analysis to place our primary analysis results into context and to identify any additional loci. We identified 6 probes that were significant after meta‐analysis (FDR‐adjusted P<0.05): the 3 identified above, together with cg20428720 (intergenic), cg17647904 (nuclear receptor corepressor 2; NCOR2), and cg23198793 (Calpain 3 CAPN3) (Table 2). The 2 genes nearest to cg20428720 are C5orf38 and IRX2. IRX2 and NCOR2 encode for a transcription factor34 and transcriptional repressor,35 respectively, whereas CAPN3 encodes for a muscle‐specific protein that binds to titin.36
Table 2.
Methylation Probes Associated With All‐Cause Mortality in the Discovery and Validation Cohorts
| Probe | Gene | Chr | Pos (hg19) | Discovery | Validation | Meta‐Analysis | ||||||
|---|---|---|---|---|---|---|---|---|---|---|---|---|
| Nominal P Value | ∆β | Log2 Fold Changea | Nominal P Value | FDR‐Adjusted P Value | ∆β | Log2 Fold Changea | Nominal P Value | FDR‐Adjusted P Value | ||||
| cg17944110 | CASZ1 b c | 1 | 10 856 657 | 0.0058 | 0.0064 | 0.18 | 4.59E‐06 | 0.059 | 0.0078 | 0.26 | 9.44E‐08 | 0.014 |
| cg08215811 | SLC4A9 b c | 5 | 139 742 900 | 0.0131 | −0.0068 | −0.13 | 9.37E‐06 | 0.08 | −0.0117 | −0.15 | 4.31E‐07 | 0.029 |
| cg17845532 | MATK b c | 19 | 3 786 643 | 0.0115 | −0.0086 | −0.22 | 1.79E‐06 | 0.046 | −0.0133 | −0.26 | 8.15E‐08 | 0.014 |
| cg20428720 | Intergenicc | 5 | 3 093 071 | 0.0571 | 0.0237 | 0.26 | 3.55E‐07 | >0.1 | 0.0492 | 0.38 | 1.38E‐07 | 0.014 |
| cg17647904 | NCOR2 c | 12 | 124 908 601 | 0.0003 | −0.0008 | 0.16 | 2.33E‐04 | >0.1 | 0.0116 | 0.15 | 3.56E‐07 | 0.028 |
| cg23198793 | CAPN3 c | 15 | 42 694 407 | 0.0010 | 0.0163 | 0.17 | 3.65E‐05 | >0.1 | 0.0191 | 0.16 | 1.44E‐07 | 0.014 |
FDR indicates false discovery rate; FDR‐adjusted, false discovery rate‐adjusted.
Log2 fold change: positive when methylation is higher in cases than controls and negative when methylation is lower in cases than controls.
Probes that were identified in the discovery set using a nominal P<0.05 and validated in the validation set using an FDR‐adjusted P<0.1.
Probes that were identified from the meta‐analysis of both the discovery and validation sets using an FDR‐adjusted P<0.05.
Results from the meta‐analysis were used in an over‐representation analysis of both Gene Ontology and KEGG gene sets. This analysis identified 1 potentially enriched KEGG gene set, Circadian entrainment (FDR‐adjusted P=0.048). However, the pathway is primarily involved in regulating sleep and circadian rhythm and does not appear to be relevant to the study phenotype.
Comb‐p meta‐analysis identified 133 DMRs (Table S1) with an FDR‐adjusted P<0.05, and the most significant DMR (FDR‐adj P=1.37E‐15) was chr1: 2344699‐2345476, which is located upstream of peroxisomal biogenesis factor 10 (PEX10). Unfortunately, there were no expression data for PEX10 available for analysis. Interestingly, the second‐most significant DMR (chr12:12490860‐124908932; FDR‐adj P=3.19E‐12) is located in intron 13 of NCOR2 and includes cg17647904, the NCOR2 probe that was identified in the meta‐analysis of the discovery and validation sets. Another DMR (chr19:3785573‐3786958; FDR‐adj P=3.07E‐05) in the top 50 results included the MATK probe, cg17845532, which encompasses a CpG island and the promoter region of the MATK gene. KEGG and Gene Ontology enrichment analysis of the significant DMRs did not yield any significant results (FDR‐adjusted P<0.1).
Correlation Between Methylation and Expression
We next determined whether there was a correlation between differentially methylated loci identified in our discovery, validation, and meta‐analyses and expression of the adjacent gene. MATK contains 2 (of 3) HT‐12 expression array probes that passed QC: ILMN_1669321 and ILMN_2319000 that capture transcripts NM_139355.2 and NM_139354.2, respectively. Given that both probes have lower expression in cases and controls (P=0.0066 and 0.0090), transcript NM_139355.2 specifically shows differential expression. However, ILMN_1669321 did not show a significant correlation between methylation and expression (P=0.45), whereas ILMN_2319000 showed a weak negative correlation between methylation and expression (P=0.045). The CASZ1 transcript did not show significant differential expression between cases and controls (P=0.15) and did not show correlation between methylation and expression (P=0.18); the SLC4A9 transcript did not pass QC. Both NCOR2 and CAPN3 genes each had 2 expression array probes that passed QC. None of the transcripts displayed differential expression between cases and controls (Table 3).
Table 3.
Expression Probe Changes of Genes That Contained Significant Methylation Probes and of the Target Genes of GH01J010790
| Gene | Probe | Expression Levels (log2 Fold Changea) | Fold Change | P Value |
|---|---|---|---|---|
| MATK | ILMN_2319000 | −0.24 | 0.85 | 0.0065 |
| MATK | ILMN_1669321 | −0.61 | 0.66 | 0.0084 |
| NCOR2 | ILMN_2340052 | −0.07 | 0.95 | 0.17 |
| NCOR2 | ILMN_1698419 | −0.07 | 0.95 | 0.44 |
| CAPN3 | ILMN_2332691 | −0.1 | 0.94 | 0.47 |
| CAPN3 | ILMN_1687971 | −0.01 | 0.99 | 0.90 |
| Target genes of GH01J010790 | ||||
| UBIAD1 | ILMN_1651872 | −0.33 | 0.8 | 0.011 |
| CLSTN1 | ILMN_2415179 | −0.13 | 0.91 | 0.033 |
| EXOSC10 | ILMN_1711189 | −0.10 | 0.93 | 0.14 |
| CASZ1 | ILMN_1655191 | −0.07 | 0.95 | 0.15 |
| EXOSC10 | ILMN_1670796 | 0.04 | 1.03 | 0.62 |
| TARDBP | ILMN_1677532 | −0.04 | 0.97 | 0.65 |
| EXOSC10 | ILMN_2402168 | −0.03 | 0.98 | 0.73 |
Log2 fold change: positive when expression is higher in cases than controls and negative when expression is lower in cases than controls.
CASZ1 is a transcription factor; the significantly differentially methylated probe, cg17944110, is located in the 5′ untranslated region exon 1 within a promoter/enhancer as predicted by GeneHancer37 identifier: GH01J010790. Given that CASZ1 was the most statistically significant of the 3 genes in the discovery set, we chose to focus on this gene. We identified the predicted target genes of this promoter/enhancer using GeneCards38 and tested for differential expression of predicted target genes between cases and controls (in the combined discovery and validation cohorts). Of the 9 identified target genes, expression data were available for 7 probes from 5 genes (Table 3). Two of these target genes showed differential expression between cases and controls: UBIAD1 (P=0.01) and CLSTN1 (P=0.03), with both showing lower expression in cases as compared with controls, consistent with the direction of effect of CASZ1 methylation. Methylation at the CASZ1 locus was inversely associated with expression levels of UBIAD1 and CLSTN1, with unadjusted P values of 0.02 and 0.013, respectively; however, there was no significance after adjusting for experimental batch (P=0.35 and 0.97, respectively).
Discussion
We present herein the first EWAS of all‐cause mortality in a cardiovascular cohort of secondary prevention patients. Using discovery and validation sets, we identified 3 genes, including SLC4A9, MATK, and the transcription factor CASZ1, which contain probes differentially methylated in patients who have subsequent mortality compared with patients who are alive at a median of 3000 days of follow‐up. These loci have not been previously identified in other EWAS of mortality. Although those studies did not focus on cardiovascular patients,11, 12 these results suggest that these loci may be unique to high‐risk cardiovascular disease patients at risk of mortality.
One of our most significant findings was for a differentially methylated probe out of a total of 157 CASZ1‐annotated probes located in the 5′ untranslated region exon 1 of CASZ1 associated with mortality in both the discovery and validation cohorts. It also lies within the promoter/enhancer, GeneHancer identifier GH01J010790 (Figure 1). The region is also listed as an enhancer in the ENCODE database39 and as a “super enhancer” in dbSUPER40 for the following cell types: colon crypt, small intestine, gastric, esophagus, pancreatic islets, left ventricle, psoas muscles, lung, and sigmoid colon. Furthermore, we identified differential expression of 2 of the predicted target genes of the promoter/enhancer in mortality cases and controls, suggesting that epigenetic modification of this gene may influence risk of death in secondary prevention cardiovascular patients. To understand the functional relationship between differential methylation of the predicted CASZ1 promoter/enhancer element and all‐cause mortality, we note the tracks within the University of California, Santa Cruz genome browser (illustrated in Figure 1, using the GViz R package41), particularly GeneHancer,42 that support the locus as an active regulatory site. This locus is correlated with a DNase I hypersensitivity site from the encyclopedia of DNA elements (ENCODE)39 in 114 cell types (Figure 1). Highlighting the putative regulatory role of the locus containing the differentially methylated CASZ1 probe, the locus is also hypomethylated in the majority of cell types and is evolutionarily conserved at the DNA level in multiple species (Figure 1). Epigenetic histone signatures also exemplify the locus’ role as a regulatory element. Histone modification data (mono‐ and trimethylation of histone H3 lysine 4 signatures), from the ENCODE project39 in the University of California, Santa Cruz browser, suggest that the region is an enhancer in 1 cell line (K562) and a promoter in another (NT2‐D1)13 (Figure 1). Our putative model holds that increased methylation of the CASZ1 enhancer decreases the accessibility of regulatory proteins leading to decreased expression of the target genes, including UBIAD1 and CLSTN1 (Figure 2).
Figure 1.
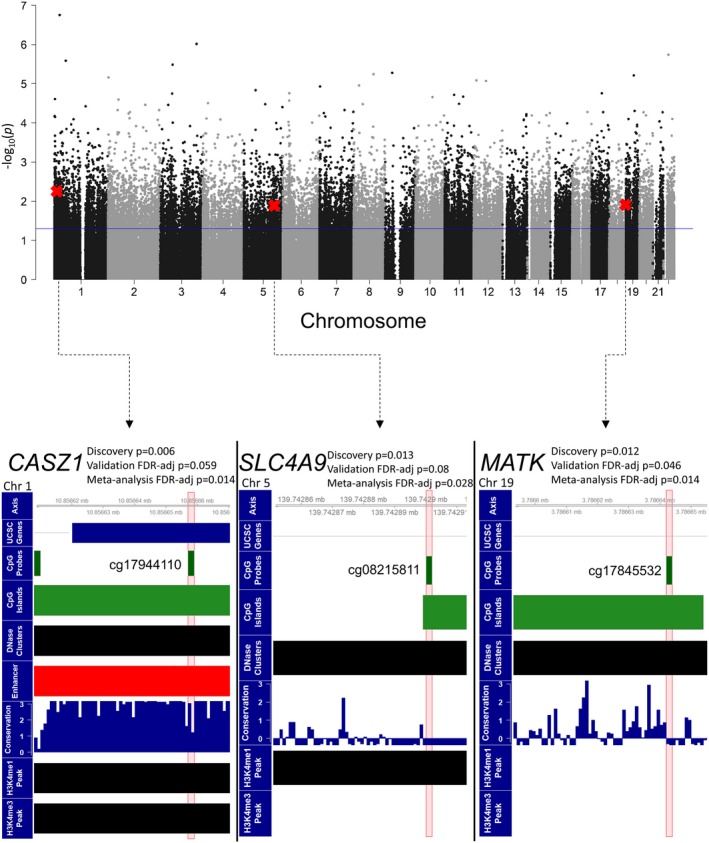
The Manhattan plot shows the results for the EWAS conducted on the discovery set. Probes that reached significance using a nominal P value of 0.05 were carried forward as candidates to be tested in the discovery set. CpG probes that are marked with a red X were those that were found to be significant using an FDR‐adjusted P value of 0.1 in the validation set. The bottom 3 panels show the 3 CpG probes that were significant in the validation set in the genome using UCSC genome browser tracks. The 3 CpGs identified are located within CpG islands and DNase clusters (ie, DNase hypersensitivity sites). The probe in CASZ1 (cg17944110) was located in the promoter/enhancer GH01J010790 (red track) and is in a region that is highly conserved. CASZ1 indicates castor zinc finger 1; EWAS, epigenome‐wide association study; FDR, false discovery rate; UCSC, University of California, Santa Cruz.
Figure 2.
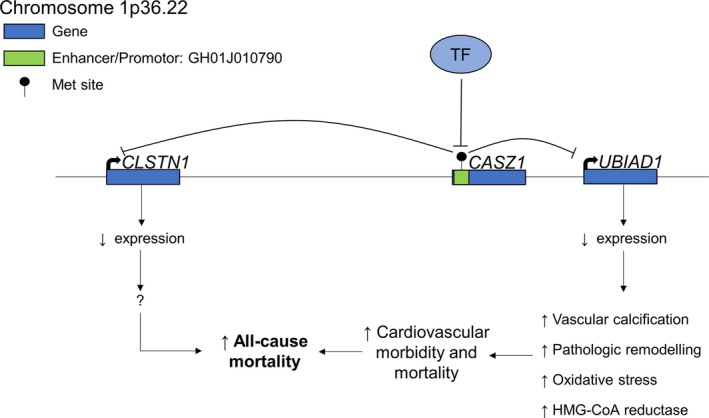
Plausible biological model displaying the consequences of increased methylation in the enhancer/promoter region of CASZ1, with the resulting changes in the expression of the target genes, UBIAD1 and CLSTN1, of GH01J010790. With increased methylation in the regulatory region in CASZ1, DNA becomes inaccessible to regulatory proteins such as transcription factors (TF). Therefore, expression of GH01J010790's target genes are decreased. With decreased UBIAD1 expression, cardiovascular morbidity and mortality are possibly increased through exaggerated vascular calcification, pathologic cardiac remodelling, oxidative stress, and increased HMG‐CoA availability, ultimately leading to increased all‐cause mortality in the cases. CASZ1 indicates castor zinc finger 1; HMG‐CoA, β‐hydroxy β‐methylglutaryl coenzyme A.
CASZ1 encodes a zinc finger transcription factor expressed in a wide variety of cells, including, but not limited to, the brain and heart43; it is frequently deleted in neural‐derived tumors (eg, neuroblastoma).44 In the cardiovascular system, CASZ1 expression is essential for cardiomyocyte cell‐cycle progression45; loss‐of‐function mutations have been implicated in congenital heart disease46 and dilated cardiomyopathy.47 Finally, a single‐nucleotide polymorphism within an intron of CASZ1, rs880315, is associated with hypertension,48 atrial fibrillation,49 and acute ischemic stroke50 in genome‐wide association studies.
One of the target genes of the regulatory element of CASZ1, UBIAD1, encodes a menaquinone‐4 biosynthetic enzyme that converts vitamin K derivatives to menaquinone‐4.51 It is also required for the synthesis of extramitochondrial ubiquinone in the Golgi apparatus.52 Interestingly, UBIAD1 has been shown to play a pleiotropic role in cardiovascular physiology. It is involved in cholesterol and phospholipid metabolism through accelerating the degradation of β‐hydroxy β‐methylglutaryl coenzyme A reductase53, 54 and contributes to the pathogenesis of vascular calcification.55 It is also implicated in the pathophysiology of heart failure where angiotensin II–mediated cardiac hypertrophy is exaggerated with knockdown of Ubiad1 in cardiomyocytes,56 partly through increased oxidative stress. Because of its numerous protective roles and the deleterious repercussions of its absence, decreased Ubiad1 levels potentially contribute to cardiovascular mortality in the cases group.
Similarly, expression levels of CLSTN1 were lower in the cases. CLSTN1 encodes a transmembrane protein known as calsyntenin‐1 or alcadein‐alpha. Almost ubiquitously expressed, calsyntenin‐1 is involved in postsynaptic signaling in the nervous system57 and in anterograde axoplasmic vesicular transport.58 Studies outside the nervous system are lacking, and it currently has no putative role in cardiovascular disease. How decreased CLSTN1 expression is potentially related to cardiovascular mortality requires further exploration.
The methylation probe in the MATK gene is located in its second intron within a CpG island and is located within the significant DMR, chr19:3785573‐3786958 (Table S1). Methylation at the probe site and expression levels were lower in cases than in controls. There is robust evidence that decreased intragenic methylation can lead to decreased expression of the respective gene,59, 60 similar to that observed in our results. The MATK gene encodes for the megakaryocyte‐associated tyrosine kinase, which phosphorylates the Src protein and partakes in regulatory pathways in megakaryocytes.61 MATK has been generally found to serve a protective role in the field of oncology; through its inhibition of Src, it prevents cell growth and invasion.62, 63
The third significant differentially methylated associated with mortality localized to intron 7 of SLC4A9. SLC4A9 (AE4) encodes an anion transporter that is primarily expressed in the kidney.64 However, expression data regarding this particular gene were not available (probe did not pass QC) in our data. Therefore, the functional implications of the increased methylation within the gene cannot be determined.
The DMR meta‐analysis yielded differential methylation upstream of the PEX10 gene. The region (chr1: 2344699‐2345476) is located within the promoter of the PEX10 (peroxisomal biogenesis factor 10) gene. PEX10 is a peroxisomal membrane protein that plays a role in transport of peroxisomal matrix proteins and, when mutated, leads to Zellweger syndrome.65 Interestingly, a DMR in APOB (chr2:21266500‐21267335; FDR‐adj P=7.00E‐04) was also identified in the meta‐analysis. The apolipoprotein B (ApoB) protein has a very well‐established role in low‐density lipoprotein transport and metabolism and, when mutated, can lead to familial hypercholestorelemia, which leads to premature atherosclerosis.66 Unfortunately, the APOB transcript was not available for analysis. Therefore, whether or not the aforementioned DMR plays a role in modulating its expression and contributing to atherosclerosis in our sample is unknown.
Our findings are unique when compared with 2 previous EWAS of all‐cause mortality.11, 12 Our study focused on secondary prevention patients, referred for cardiac catheterization, whereas the previous studies included healthier middle‐aged/elderly twins11 and 2 elderly cohorts (Epidemiologische Studie zu Chancen der Verhütung, Früherkennung und optimierten Therapie chronischer Erkrankungen in der älteren Bevölkerung [ESTHER] and KORA [Cooperative Health Research in the Region of Augsburg]),12 respectively. Also, both of the aforementioned studies used larger sample sizes (N=870 and N=1900). Furthermore, there might be underlying heterogeneity between the causes of death in our study and the aforementioned EWASs. Three probes from the ESTHER/KORA study12 and 1 from the twin study11 were nominally significant in our study, using a fully adjusted model, in both the discovery and validation cohorts (Table S2), but they were no longer significant after FDR adjustment. Interestingly, 2 of the 3 probes from the ESTHER/KORA study12 displayed methylation levels in the similar direction as the CATHGEN participants where cases had lower methylation levels compared with controls.
Although our findings are interesting and suggest functional consequences of the identified epigenetic modifications, some limitations should be noted. The sample size of our study is relatively small, therefore our study warrants replication. However, we did use a discovery and validation cohort to minimize type 1 error. In addition, cases used for analysis may be sicker than controls, given that they died earlier than controls, but we note that models were adjusted for potential confounders. Relatedly, controls were selected based on the absence of a subsequent coronary revascularization procedure or myocardial infarction to ensure that controls were truly free of cardiovascular disease, but this could also contribute to sampling bias. We used an FDR adjustment for multiple comparisons with a P‐value threshold of 0.10 in the validation cohort, which could be viewed as too liberal of a cutoff; thus, results placed within a more‐conservative FDR cutoff of 0.05 are also presented, and furthermore, we present meta‐analysis results which place combined stronger effects in context and maximize power. Although statistically significant, the ∆β values from both the discovery and validation cohorts were modest. Also, even though there was a statistically significant difference between the expression levels of UBIAD1 and CLSTN1 between cases and controls, we did not observe a significant direct correlation between methylation at the CASZ1 enhancer locus and expression levels of the downstream targets. Given the dynamic nature of DNA methylation and other epigenetic mechanisms, our study only demonstrates a “snapshot” of a single genomic methylation profile. Temporally, regulatory elements demonstrate changing methylation profiles and are not permanent.13, 14 Therefore, the sites of altered methylation demonstrate correlation with, rather than causation of, early‐onset death. The sample used for our study represents an overall “sick” group of patients, and as such, survival bias might be playing a role. Because all of the participants enrolled had undergone a cardiac catheterization procedure, the results may not be generalizable to population‐based cohorts.
In conclusion, using an EWAS in discovery and validation cohorts of secondary prevention patients, we found evidence of differential methylation of a regulatory element with consequent decrease in 2 of its potential targets, of which 1 has demonstrated cardioprotective benefits. Future studies are required to replicate our findings and further ascertain the potential role of UBIAD1 role in cardiovascular mortality.
Sources of Funding
This work was supported by National Heart, Lung, and Blood Institute grants 5P01‐HL036587 (Williams, Shah) and 5R01‐HL095987 (Shah).
Disclosures
None.
Supporting information
Data S1. Methods for DNA quantification and DNA qualitative assessment.
Table S1. Comb‐p DMR Meta‐Analysis Results of the Discovery and Validation Sets
Table S2. Probes With Nominal P<0.05 Found in Both Discovery and Validation Cohorts That Are Common to Previous EWAS of All‐Cause Mortality
Acknowledgments
We thank the CATHGEN participants for taking part in this study.
(J Am Heart Assoc. 2019;8:e013228 DOI: 10.1161/JAHA.119.013228.)
References
- 1. World Health Organization (WHO) . Global Health Observatory (GHO) data. Geneva, Switzerland: World Health Organization; 2018.
- 2. Heron M. Deaths: Leading causes for 2017. Natl Vital Stat Rep. 2019;68:1–77. [PubMed] [Google Scholar]
- 3. Yusuf S, Hawken S, Ounpuu S, Dans T, Avezum A, Lanas F, McQueen M, Budaj A, Pais P, Varigos J, Lisheng L; INTERHEART Study Investigators . Effect of potentially modifiable risk factors associated with myocardial infarction in 52 countries (the INTERHEART study): case‐control study. Lancet. 2004;364:937–952. [DOI] [PubMed] [Google Scholar]
- 4. Blankenberg S, Zeller T, Saarela O, Havulinna AS, Kee F, Tunstall‐Pedoe H, Kuulasmaa K, Yarnell J, Schnabel RB, Wild PS, Munzel TF, Lackner KJ, Tiret L, Evans A, Salomaa V; MORGAM Project . Contribution of 30 biomarkers to 10‐year cardiovascular risk estimation in 2 population cohorts: the MONICA, risk, genetics, archiving, and monograph (MORGAM) biomarker project. Circulation. 2010;121:2388–2397. [DOI] [PubMed] [Google Scholar]
- 5. Khera AV, Emdin CA, Drake I, Natarajan P, Bick AG, Cook NR, Chasman DI, Baber U, Mehran R, Rader DJ, Fuster V, Boerwinkle E, Melander O, Orho‐Melander M, Ridker PM, Kathiresan S. Genetic risk, adherence to a healthy lifestyle, and coronary disease. N Engl J Med. 2016;375:2349–2358. [DOI] [PMC free article] [PubMed] [Google Scholar]
- 6. Rakyan VK, Down TA, Balding DJ, Beck S. Epigenome‐wide association studies for common human diseases. Nat Rev Genet. 2011;12:529–541. [DOI] [PMC free article] [PubMed] [Google Scholar]
- 7. Berdasco M, Esteller M. Clinical epigenetics: seizing opportunities for translation. Nat Rev Genet. 2019;20:109–127. [DOI] [PubMed] [Google Scholar]
- 8. Robertson KD. DNA methylation and human disease. Nat Rev Genet. 2005;6:597–610. [DOI] [PubMed] [Google Scholar]
- 9. Aslibekyan S, Agha G, Colicino E, Do AN, Lahti J, Ligthart S, Marioni RE, Marzi C, Mendelson MM, Tanaka T, Wielscher M, Absher DM, Ferrucci L, Franco OH, Gieger C, Grallert H, Hernandez D, Huan T, Iurato S, Joehanes R, Just AC, Kunze S, Lin H, Liu C, Meigs JB, van Meurs JBJ, Moore AZ, Peters A, Prokisch H, Raikkonen K, Rathmann W, Roden M, Schramm K, Schwartz JD, Starr JM, Uitterlinden AG, Vokonas P, Waldenberger M, Yao C, Zhi D, Baccarelli AA, Bandinelli S, Deary IJ, Dehghan A, Eriksson J, Herder C, Jarvelin MR, Levy D, Arnett DK. Association of methylation signals with incident coronary heart disease in an epigenome‐wide assessment of circulating tumor necrosis factor alpha. JAMA Cardiol. 2018;3:463–472. [DOI] [PMC free article] [PubMed] [Google Scholar]
- 10. Wahl S, Drong A, Lehne B, Loh M, Scott WR, Kunze S, Tsai PC, Ried JS, Zhang W, Yang Y, Tan S, Fiorito G, Franke L, Guarrera S, Kasela S, Kriebel J, Richmond RC, Adamo M, Afzal U, Ala‐Korpela M, Albetti B, Ammerpohl O, Apperley JF, Beekman M, Bertazzi PA, Black SL, Blancher C, Bonder MJ, Brosch M, Carstensen‐Kirberg M, de Craen AJ, de Lusignan S, Dehghan A, Elkalaawy M, Fischer K, Franco OH, Gaunt TR, Hampe J, Hashemi M, Isaacs A, Jenkinson A, Jha S, Kato N, Krogh V, Laffan M, Meisinger C, Meitinger T, Mok ZY, Motta V, Ng HK, Nikolakopoulou Z, Nteliopoulos G, Panico S, Pervjakova N, Prokisch H, Rathmann W, Roden M, Rota F, Rozario MA, Sandling JK, Schafmayer C, Schramm K, Siebert R, Slagboom PE, Soininen P, Stolk L, Strauch K, Tai ES, Tarantini L, Thorand B, Tigchelaar EF, Tumino R, Uitterlinden AG, van Duijn C, van Meurs JB, Vineis P, Wickremasinghe AR, Wijmenga C, Yang TP, Yuan W, Zhernakova A, Batterham RL, Smith GD, Deloukas P, Heijmans BT, Herder C, Hofman A, Lindgren CM, Milani L, van der Harst P, Peters A, Illig T, Relton CL, Waldenberger M, Jarvelin MR, Bollati V, Soong R, Spector TD, Scott J, McCarthy MI, Elliott P, Bell JT, Matullo G, Gieger C, Kooner JS, Grallert H, Chambers JC. Epigenome‐wide association study of body mass index, and the adverse outcomes of adiposity. Nature. 2017;541:81–86. [DOI] [PMC free article] [PubMed] [Google Scholar]
- 11. Svane AM, Soerensen M, Lund J, Tan Q, Jylhava J, Wang Y, Pedersen NL, Hagg S, Debrabant B, Deary IJ, Christensen K, Christiansen L, Hjelmborg JB. DNA methylation and all‐cause mortality in middle‐aged and elderly Danish twins. Genes (Basel). 2018;9:E78. [DOI] [PMC free article] [PubMed] [Google Scholar]
- 12. Zhang Y, Wilson R, Heiss J, Breitling LP, Saum KU, Schottker B, Holleczek B, Waldenberger M, Peters A, Brenner H. DNA methylation signatures in peripheral blood strongly predict all‐cause mortality. Nat Commun. 2017;8:14617. [DOI] [PMC free article] [PubMed] [Google Scholar]
- 13. Smith E, Shilatifard A. Enhancer biology and enhanceropathies. Nat Struct Mol Biol. 2014;21:210–219. [DOI] [PubMed] [Google Scholar]
- 14. Moore AZ, Hernandez DG, Tanaka T, Pilling LC, Nalls MA, Bandinelli S, Singleton AB, Ferrucci L. Change in epigenome‐wide DNA methylation over 9 years and subsequent mortality: results from the INCHIANTI study. J Gerontol A Biol Sci Med Sci. 2016;71:1029–1035. [DOI] [PMC free article] [PubMed] [Google Scholar]
- 15. Kraus WE, Granger CB, Sketch MH Jr, Donahue MP, Ginsburg GS, Hauser ER, Haynes C, Newby LK, Hurdle M, Dowdy ZE, Shah SH. A guide for a cardiovascular genomics biorepository: the CATHGEN experience. J Cardiovasc Transl Res. 2015;8:449–457. [DOI] [PMC free article] [PubMed] [Google Scholar]
- 16. Chen H, Rangasamy M, Tan SY, Wang H, Siegfried BD. Evaluation of five methods for total DNA extraction from western corn rootworm beetles. PLoS One. 2010;5:e11963. [DOI] [PMC free article] [PubMed] [Google Scholar]
- 17. Aryee MJ, Jaffe AE, Corrada‐Bravo H, Ladd‐Acosta C, Feinberg AP, Hansen KD, Irizarry RA. Minfi: a flexible and comprehensive bioconductor package for the analysis of infinium DNA methylation microarrays. Bioinformatics. 2014;30:1363–1369. [DOI] [PMC free article] [PubMed] [Google Scholar]
- 18. Fortin JP, Triche TJ Jr, Hansen KD. Preprocessing, normalization and integration of the Illumina HumanMethylationEPIC array with minfi. Bioinformatics. 2017;33:558–560. [DOI] [PMC free article] [PubMed] [Google Scholar]
- 19. Houseman EA, Accomando WP, Koestler DC, Christensen BC, Marsit CJ, Nelson HH, Wiencke JK, Kelsey KT. DNA methylation arrays as surrogate measures of cell mixture distribution. BMC Bioinformatics. 2012;13:86. [DOI] [PMC free article] [PubMed] [Google Scholar]
- 20. Jaffe AE, Irizarry RA. Accounting for cellular heterogeneity is critical in epigenome‐wide association studies. Genome Biol. 2014;15:R31. [DOI] [PMC free article] [PubMed] [Google Scholar]
- 21. Peters TJ, Buckley MJ, Statham AL, Pidsley R, Samaras K, V Lord R, Clark SJ, Molloy PL. De novo identification of differentially methylated regions in the human genome. Epigenetics Chromatin. 2015;8:6. [DOI] [PMC free article] [PubMed] [Google Scholar]
- 22. Pidsley R, Zotenko E, Peters TJ, Lawrence MG, Risbridger GP, Molloy P, Van Djik S, Muhlhausler B, Stirzaker C, Clark SJ. Critical evaluation of the Illumina MethylationEPIC BeadChip microarray for whole‐genome DNA methylation profiling. Genome Biol. 2016;17:208. [DOI] [PMC free article] [PubMed] [Google Scholar]
- 23. Chen YA, Lemire M, Choufani S, Butcher DT, Grafodatskaya D, Zanke BW, Gallinger S, Hudson TJ, Weksberg R. Discovery of cross‐reactive probes and polymorphic CpGs in the Illumina Infinium HumanMethylation450 microarray. Epigenetics. 2013;8:203–209. [DOI] [PMC free article] [PubMed] [Google Scholar]
- 24. Ritchie ME, Phipson B, Wu D, Hu Y, Law CW, Shi W, Smyth GK. Limma powers differential expression analyses for RNA‐sequencing and microarray studies. Nucleic Acids Res. 2015;43:e47. [DOI] [PMC free article] [PubMed] [Google Scholar]
- 25. Phipson B, Lee S, Majewski IJ, Alexander WS, Smyth GK. Robust hyperparameter estimation protects against hypervariable genes and improves power to detect differential expression. Ann Appl Stat. 2016;10:946–963. [DOI] [PMC free article] [PubMed] [Google Scholar]
- 26. Benjamini Y, Hochberg Y. Controlling the false discovery rate: a practical and powerful approach to multiple testing. J R Stat Soc Series B Stat Methodol. 1995;57:289–300. [Google Scholar]
- 27. Willer CJ, Li Y, Abecasis GR. METAL: fast and efficient meta‐analysis of genomewide association scans. Bioinformatics. 2010;26:2190–2191. [DOI] [PMC free article] [PubMed] [Google Scholar]
- 28. Phipson B, Maksimovic J, Oshlack A. missMethyl: an R package for analyzing data from Illumina's HumanMethylation450 platform. Bioinformatics. 2016;32:286–288. [DOI] [PubMed] [Google Scholar]
- 29. Pedersen BS, Schwartz DA, Yang IV, Kechris KJ. Comb‐p: software for combining, analyzing, grouping and correcting spatially correlated P‐values. Bioinformatics. 2012;28:2986–2988. [DOI] [PMC free article] [PubMed] [Google Scholar]
- 30. Šidák Z. Rectangular confidence regions for the means of multivariate normal distributions. J Am Stat Assoc. 1967;62:626–633. [Google Scholar]
- 31. Mallik S, Odom GJ, Gao Z, Gomez L, Chen X, Wang L. An evaluation of supervised methods for identifying differentially methylated regions in Illumina methylation arrays. Brief Bioinform. 2018;00:1–12. [Epub ahead of print]. [DOI] [PMC free article] [PubMed] [Google Scholar]
- 32. Subramanian A, Tamayo P, Mootha VK, Mukherjee S, Ebert BL, Gillette MA, Paulovich A, Pomeroy SL, Golub TR, Lander ES, Mesirov JP. Gene set enrichment analysis: a knowledge‐based approach for interpreting genome‐wide expression profiles. Proc Natl Acad Sci USA. 2005;102:15545–15550. [DOI] [PMC free article] [PubMed] [Google Scholar]
- 33. Kraus WE, Muoio DM, Stevens R, Craig D, Bain JR, Grass E, Haynes C, Kwee L, Qin X, Slentz DH, Krupp D, Muehlbauer M, Hauser ER, Gregory SG, Newgard CB, Shah SH. Metabolomic quantitative trait loci (mQTL) mapping implicates the ubiquitin proteasome system in cardiovascular disease pathogenesis. PLoS Genet. 2015;11:e1005553. [DOI] [PMC free article] [PubMed] [Google Scholar]
- 34. Matsumoto K, Nishihara S, Kamimura M, Shiraishi T, Otoguro T, Uehara M, Maeda Y, Ogura K, Lumsden A, Ogura T. The prepattern transcription factor Irx2, a target of the FGF8/MAP kinase cascade, is involved in cerebellum formation. Nat Neurosci. 2004;7:605–612. [DOI] [PubMed] [Google Scholar]
- 35. Chen JD, Evans RM. A transcriptional co‐repressor that interacts with nuclear hormone receptors. Nature. 1995;377:454–457. [DOI] [PubMed] [Google Scholar]
- 36. Fougerousse F, Durand M, Suel L, Pourquie O, Delezoide AL, Romero NB, Abitbol M, Beckmann JS. Expression of genes (CAPN3, SGCA, SGCB, and TTN) involved in progressive muscular dystrophies during early human development. Genomics. 1998;48:145–156. [DOI] [PubMed] [Google Scholar]
- 37. Fishilevich S, Nudel R, Rappaport N, Hadar R, Plaschkes I, Iny Stein T, Rosen N, Kohn A, Twik M, Safran M, Lancet D, Cohen D. Genehancer: genome‐wide integration of enhancers and target genes in genecards. Database (Oxford). 2017;2017:1–17. [DOI] [PMC free article] [PubMed] [Google Scholar]
- 38. Stelzer G, Rosen N, Plaschkes I, Zimmerman S, Twik M, Fishilevich S, Stein TI, Nudel R, Lieder I, Mazor Y, Kaplan S, Dahary D, Warshawsky D, Guan‐Golan Y, Kohn A, Rappaport N, Safran M, Lancet D. The GeneCards suite: from gene data mining to disease genome sequence analyses. Curr Protoc Bioinformatics. 2016;54:1.30.31–1.30.33. [DOI] [PubMed] [Google Scholar]
- 39. ENCODE Project Consortium . An integrated encyclopedia of DNA elements in the human genome. Nature. 2012;489:57–74. [DOI] [PMC free article] [PubMed] [Google Scholar]
- 40. Khan A, Zhang X. dbSUPER: a database of super‐enhancers in mouse and human genome. Nucleic Acids Res. 2016;44:D164–D171. [DOI] [PMC free article] [PubMed] [Google Scholar]
- 41. Hahne F, Ivanek R. Visualizing genomic data using Gviz and bioconductor. Methods Mol Biol. 2016;1418:335–351. [DOI] [PubMed] [Google Scholar]
- 42. Kent WJ, Sugnet CW, Furey TS, Roskin KM, Pringle TH, Zahler AM, Haussler D. The human genome browser at UCSC. Genome Res. 2002;12:996–1006. [DOI] [PMC free article] [PubMed] [Google Scholar]
- 43. Liu Z, Yang X, Tan F, Cullion K, Thiele CJ. Molecular cloning and characterization of human Castor, a novel human gene upregulated during cell differentiation. Biochem Biophys Res Commun. 2006;344:834–844. [DOI] [PubMed] [Google Scholar]
- 44. Caren H, Fransson S, Ejeskar K, Kogner P, Martinsson T. Genetic and epigenetic changes in the common 1p36 deletion in neuroblastoma tumours. Br J Cancer. 2007;97:1416–1424. [DOI] [PMC free article] [PubMed] [Google Scholar]
- 45. Dorr KM, Amin NM, Kuchenbrod LM, Labiner H, Charpentier MS, Pevny LH, Wessels A, Conlon FL. Casz1 is required for cardiomyocyte G1‐to‐S phase progression during mammalian cardiac development. Development. 2015;142:2037–2047. [DOI] [PMC free article] [PubMed] [Google Scholar]
- 46. Huang RT, Xue S, Wang J, Gu JY, Xu JH, Li YJ, Li N, Yang XX, Liu H, Zhang XD, Qu XK, Xu YJ, Qiu XB, Li RG, Yang YQ. CASZ1 loss‐of‐function mutation associated with congenital heart disease. Gene. 2016;595:62–68. [DOI] [PubMed] [Google Scholar]
- 47. Qiu XB, Qu XK, Li RG, Liu H, Xu YJ, Zhang M, Shi HY, Hou XM, Liu X, Yuan F, Sun YM, Wang J, Huang RT, Xue S, Yang YQ. CASZ1 loss‐of‐function mutation contributes to familial dilated cardiomyopathy. Clin Chem Lab Med. 2017;55:1417–1425. [DOI] [PubMed] [Google Scholar]
- 48. Wain LV, Vaez A, Jansen R, Joehanes R, van der Most PJ, Erzurumluoglu AM, O'Reilly PF, Cabrera CP, Warren HR, Rose LM, Verwoert GC, Hottenga JJ, Strawbridge RJ, Esko T, Arking DE, Hwang SJ, Guo X, Kutalik Z, Trompet S, Shrine N, Teumer A, Ried JS, Bis JC, Smith AV, Amin N, Nolte IM, Lyytikainen LP, Mahajan A, Wareham NJ, Hofer E, Joshi PK, Kristiansson K, Traglia M, Havulinna AS, Goel A, Nalls MA, Sober S, Vuckovic D, Luan J, Del Greco MF, Ayers KL, Marrugat J, Ruggiero D, Lopez LM, Niiranen T, Enroth S, Jackson AU, Nelson CP, Huffman JE, Zhang W, Marten J, Gandin I, Harris SE, Zemunik T, Lu Y, Evangelou E, Shah N, de Borst MH, Mangino M, Prins BP, Campbell A, Li‐Gao R, Chauhan G, Oldmeadow C, Abecasis G, Abedi M, Barbieri CM, Barnes MR, Batini C, Beilby J, Blake T, Boehnke M, Bottinger EP, Braund PS, Brown M, Brumat M, Campbell H, Chambers JC, Cocca M, Collins F, Connell J, Cordell HJ, Damman JJ, Davies G, de Geus EJ, de Mutsert R, Deelen J, Demirkale Y, Doney ASF, Dorr M, Farrall M, Ferreira T, Franberg M, Gao H, Giedraitis V, Gieger C, Giulianini F, Gow AJ, Hamsten A, Harris TB, Hofman A, Holliday EG, Hui J, Jarvelin MR, Johansson A, Johnson AD, Jousilahti P, Jula A, Kahonen M, Kathiresan S, Khaw KT, Kolcic I, Koskinen S, Langenberg C, Larson M, Launer LJ, Lehne B, Liewald DCM, Lin L, Lind L, Mach F, Mamasoula C, Menni C, Mifsud B, Milaneschi Y, Morgan A, Morris AD, Morrison AC, Munson PJ, Nandakumar P, Nguyen QT, Nutile T, Oldehinkel AJ, Oostra BA, Org E, Padmanabhan S, Palotie A, Pare G, Pattie A, Penninx B, Poulter N, Pramstaller PP, Raitakari OT, Ren M, Rice K, Ridker PM, Riese H, Ripatti S, Robino A, Rotter JI, Rudan I, Saba Y, Saint Pierre A, Sala CF, Sarin AP, Schmidt R, Scott R, Seelen MA, Shields DC, Siscovick D, Sorice R, Stanton A, Stott DJ, Sundstrom J, Swertz M, Taylor KD, Thom S, Tzoulaki I, Tzourio C, Uitterlinden AG, Volker U, Vollenweider P, Wild S, Willemsen G, Wright AF, Yao J, Theriault S, Conen D, Attia J, Sever P, Debette S, Mook‐Kanamori DO, Zeggini E, Spector TD, van der Harst P, Palmer CNA, Vergnaud AC, Loos RJF, Polasek O, Starr JM, Girotto G, Hayward C, Kooner JS, Lindgren CM, Vitart V, Samani NJ, Tuomilehto J, Gyllensten U, Knekt P, Deary IJ, Ciullo M, Elosua R, Keavney BD, Hicks AA, Scott RA, Gasparini P, Laan M, Liu Y, Watkins H, Hartman CA, Salomaa V, Toniolo D, Perola M, Wilson JF, Schmidt H, Zhao JH, Lehtimaki T, van Duijn CM, Gudnason V, Psaty BM, Peters A, Rettig R, James A, Jukema JW, Strachan DP, Palmas W, Metspalu A, Ingelsson E, Boomsma DI, Franco OH, Bochud M, Newton‐Cheh C, Munroe PB, Elliott P, Chasman DI, Chakravarti A, Knight J, Morris AP, Levy D, Tobin MD, Snieder H, Caulfield MJ, Ehret GB. Novel blood pressure locus and gene discovery using genome‐wide association study and expression data sets from blood and the kidney. Hypertension. 2017. Jul 24. pii: HYPERTENSIONAHA.117.09438. doi: 10.1161/hypertensionaha.117.09438. [Epub ahead of print] [DOI] [PMC free article] [PubMed] [Google Scholar]
- 49. Roselli C, Chaffin MD, Weng LC, Aeschbacher S, Ahlberg G, Albert CM, Almgren P, Alonso A, Anderson CD, Aragam KG, Arking DE, Barnard J, Bartz TM, Benjamin EJ, Bihlmeyer NA, Bis JC, Bloom HL, Boerwinkle E, Bottinger EB, Brody JA, Calkins H, Campbell A, Cappola TP, Carlquist J, Chasman DI, Chen LY, Chen YI, Choi EK, Choi SH, Christophersen IE, Chung MK, Cole JW, Conen D, Cook J, Crijns HJ, Cutler MJ, Damrauer SM, Daniels BR, Darbar D, Delgado G, Denny JC, Dichgans M, Dorr M, Dudink EA, Dudley SC, Esa N, Esko T, Eskola M, Fatkin D, Felix SB, Ford I, Franco OH, Geelhoed B, Grewal RP, Gudnason V, Guo X, Gupta N, Gustafsson S, Gutmann R, Hamsten A, Harris TB, Hayward C, Heckbert SR, Hernesniemi J, Hocking LJ, Hofman A, Horimoto A, Huang J, Huang PL, Huffman J, Ingelsson E, Ipek EG, Ito K, Jimenez‐Conde J, Johnson R, Jukema JW, Kaab S, Kahonen M, Kamatani Y, Kane JP, Kastrati A, Kathiresan S, Katschnig‐Winter P, Kavousi M, Kessler T, Kietselaer BL, Kirchhof P, Kleber ME, Knight S, Krieger JE, Kubo M, Launer LJ, Laurikka J, Lehtimaki T, Leineweber K, Lemaitre RN, Li M, Lim HE, Lin HJ, Lin H, Lind L, Lindgren CM, Lokki ML, London B, Loos RJF, Low SK, Lu Y, Lyytikainen LP, Macfarlane PW, Magnusson PK, Mahajan A, Malik R, Mansur AJ, Marcus GM, Margolin L, Margulies KB, Marz W, McManus DD, Melander O, Mohanty S, Montgomery JA, Morley MP, Morris AP, Muller‐Nurasyid M, Natale A, Nazarian S, Neumann B, Newton‐Cheh C, Niemeijer MN, Nikus K, Nilsson P, Noordam R, Oellers H, Olesen MS, Orho‐Melander M, Padmanabhan S, Pak HN, Pare G, Pedersen NL, Pera J, Pereira A, Porteous D, Psaty BM, Pulit SL, Pullinger CR, Rader DJ, Refsgaard L, Ribases M, Ridker PM, Rienstra M, Risch L, Roden DM, Rosand J, Rosenberg MA, Rost N, Rotter JI, Saba S, Sandhu RK, Schnabel RB, Schramm K, Schunkert H, Schurman C, Scott SA, Seppala I, Shaffer C, Shah S, Shalaby AA, Shim J, Shoemaker MB, Siland JE, Sinisalo J, Sinner MF, Slowik A, Smith AV, Smith BH, Smith JG, Smith JD, Smith NL, Soliman EZ, Sotoodehnia N, Stricker BH, Sun A, Sun H, Svendsen JH, Tanaka T, Tanriverdi K, Taylor KD, Teder‐Laving M, Teumer A, Theriault S, Trompet S, Tucker NR, Tveit A, Uitterlinden AG, Van Der Harst P, Van Gelder IC, Van Wagoner DR, Verweij N, Vlachopoulou E, Volker U, Wang B, Weeke PE, Weijs B, Weiss R, Weiss S, Wells QS, Wiggins KL, Wong JA, Woo D, Worrall BB, Yang PS, Yao J, Yoneda ZT, Zeller T, Zeng L, Lubitz SA, Lunetta KL, Ellinor PT. Multi‐ethnic genome‐wide association study for atrial fibrillation. Nat Genet. 2018;50:1225–1233. [DOI] [PMC free article] [PubMed] [Google Scholar]
- 50. Malik R, Chauhan G, Traylor M, Sargurupremraj M, Okada Y, Mishra A, Rutten‐Jacobs L, Giese AK, van der Laan SW, Gretarsdottir S, Anderson CD, Chong M, Adams HHH, Ago T, Almgren P, Amouyel P, Ay H, Bartz TM, Benavente OR, Bevan S, Boncoraglio GB, Brown RD Jr, Butterworth AS, Carrera C, Carty CL, Chasman DI, Chen WM, Cole JW, Correa A, Cotlarciuc I, Cruchaga C, Danesh J, de Bakker PIW, DeStefano AL, den Hoed M, Duan Q, Engelter ST, Falcone GJ, Gottesman RF, Grewal RP, Gudnason V, Gustafsson S, Haessler J, Harris TB, Hassan A, Havulinna AS, Heckbert SR, Holliday EG, Howard G, Hsu FC, Hyacinth HI, Ikram MA, Ingelsson E, Irvin MR, Jian X, Jiménez‐Conde J, Johnson JA, Jukema JW, Kanai M, Keene KL, Kissela BM, Kleindorfer DO, Kooperberg C, Kubo M, Lange LA, Langefeld CD, Langenberg C, Launer LJ, Lee JM, Lemmens R, Leys D, Lewis CM, Lin WY, Lindgren AG, Lorentzen E, Magnusson PK, Maguire J, Manichaikul A, McArdle PF, Meschia JF, Mitchell BD, Mosley TH, Nalls MA, Ninomiya T, O'Donnell MJ, Psaty BM, Pulit SL, Rannikmäe K, Reiner AP, Rexrode KM, Rice K, Rich SS, Ridker PM, Rost NS, Rothwell PM, Rotter JI, Rundek T, Sacco RL, Sakaue S, Sale MM, Salomaa V, Sapkota BR, Schmidt R, Schmidt CO, Schminke U, Sharma P, Slowik A, Sudlow CLM, Tanislav C, Tatlisumak T, Taylor KD, Thijs VNS, Thorleifsson G, Thorsteinsdottir U, Tiedt S, Trompet S, Tzourio C, van Duijn CM, Walters M, Wareham NJ, Wassertheil‐Smoller S, Wilson JG, Wiggins KL, Yang Q, Yusuf S; AFGen Consortium; Cohorts for Heart and Aging Research in Genomic Epidemiology (CHARGE) Consortium; International Genomics of Blood Pressure (iGEN‐BP) Consortium; INVENT Consortium; STARNET , Bis JC, Pastinen T, Ruusalepp A, Schadt EE, Koplev S, Björkegren JLM, Codoni V, Civelek M, Smith NL, Trégouët DA, Christophersen IE, Roselli C, Lubitz SA, Ellinor PT, Tai ES, Kooner JS, Kato N, He J, van der Harst P, Elliott P, Chambers JC, Takeuchi F, Johnson AD; BioBank Japan Cooperative Hospital Group; COMPASS Consortium; EPIC‐CVD Consortium; EPIC‐InterAct Consortium; International Stroke Genetics Consortium (ISGC); METASTROKE Consortium; Neurology Working Group of the CHARGE Consortium; NINDS Stroke Genetics Network (SiGN); UK Young Lacunar DNA Study; MEGASTROKE Consortium , Sanghera DK, Melander O, Jern C, Strbian D, Fernandez‐Cadenas I, Longstreth WT Jr, Rolfs A, Hata J, Woo D, Rosand J, Pare G, Hopewell JC, Saleheen D, Stefansson K, Worrall BB, Kittner SJ, Seshadri S, Fornage M, Markus HS, Howson JMM, Kamatani Y, Debette S, Dichgans M. Multiancestry genome‐wide association study of 520,000 subjects identifies 32 loci associated with stroke and stroke subtypes. Nat Genet. 2018;50:524–537.29531354 [Google Scholar]
- 51. Nakagawa K, Hirota Y, Sawada N, Yuge N, Watanabe M, Uchino Y, Okuda N, Shimomura Y, Suhara Y, Okano T. Identification of UBIAD1 as a novel human menaquinone‐4 biosynthetic enzyme. Nature. 2010;468:117–121. [DOI] [PubMed] [Google Scholar]
- 52. Mugoni V, Postel R, Catanzaro V, De Luca E, Turco E, Digilio G, Silengo L, Murphy MP, Medana C, Stainier DY, Bakkers J, Santoro MM. Ubiad1 is an antioxidant enzyme that regulates eNOS activity by CoQ10 synthesis. Cell. 2013;152:504–518. [DOI] [PMC free article] [PubMed] [Google Scholar]
- 53. Schumacher MM, Elsabrouty R, Seemann J, Jo Y, DeBose‐Boyd RA. The prenyltransferase UBIAD1 is the target of geranylgeraniol in degradation of HMG CoA reductase. Elife. 2015;4:1–21. [DOI] [PMC free article] [PubMed] [Google Scholar]
- 54. Johnson BM, DeBose‐Boyd RA. Underlying mechanisms for sterol‐induced ubiquitination and ER‐associated degradation of HMG CoA reductase. Semin Cell Dev Biol. 2018;81:121–128. [DOI] [PMC free article] [PubMed] [Google Scholar]
- 55. Liu S, Guo W, Han X, Dai W, Diao Z, Liu W. Role of UBIAD1 in intracellular cholesterol metabolism and vascular cell calcification. PLoS One. 2016;11:e0149639. [DOI] [PMC free article] [PubMed] [Google Scholar]
- 56. Yan B, Sun Y, Wang J. Depletion of ubiA prenyltransferase domain containing 1 expression promotes angiotensin II‐induced hypertrophic response in AC16 human myocardial cells via modulating the expression levels of coenzyme Q10 and endothelial nitric oxide synthase. Mol Med Rep. 2017;16:6910–6915. [DOI] [PubMed] [Google Scholar]
- 57. Vogt L, Schrimpf SP, Meskenaite V, Frischknecht R, Kinter J, Leone DP, Ziegler U, Sonderegger P. Calsyntenin‐1, a proteolytically processed postsynaptic membrane protein with a cytoplasmic calcium‐binding domain. Mol Cell Neurosci. 2001;17:151–166. [DOI] [PubMed] [Google Scholar]
- 58. Konecna A, Frischknecht R, Kinter J, Ludwig A, Steuble M, Meskenaite V, Indermuhle M, Engel M, Cen C, Mateos JM, Streit P, Sonderegger P. Calsyntenin‐1 docks vesicular cargo to kinesin‐1. Mol Biol Cell. 2006;17:3651–3663. [DOI] [PMC free article] [PubMed] [Google Scholar]
- 59. Maunakea AK, Nagarajan RP, Bilenky M, Ballinger TJ, D'Souza C, Fouse SD, Johnson BE, Hong C, Nielsen C, Zhao Y, Turecki G, Delaney A, Varhol R, Thiessen N, Shchors K, Heine VM, Rowitch DH, Xing X, Fiore C, Schillebeeckx M, Jones SJ, Haussler D, Marra MA, Hirst M, Wang T, Costello JF. Conserved role of intragenic DNA methylation in regulating alternative promoters. Nature. 2010;466:253–257. [DOI] [PMC free article] [PubMed] [Google Scholar]
- 60. Yang X, Han H, De Carvalho DD, Lay FD, Jones PA, Liang G. Gene body methylation can alter gene expression and is a therapeutic target in cancer. Cancer Cell. 2014;26:577–590. [DOI] [PMC free article] [PubMed] [Google Scholar]
- 61. Avraham S, Jiang S, Ota S, Fu Y, Deng B, Dowler LL, White RA, Avraham H. Structural and functional studies of the intracellular tyrosine kinase MATK gene and its translated product. J Biol Chem. 1995;270:1833–1842. [DOI] [PubMed] [Google Scholar]
- 62. Advani G, Lim YC, Catimel B, Lio DSS, Ng NLY, Chueh AC, Tran M, Anasir MI, Verkade H, Zhu HJ, Turk BE, Smithgall TE, Ang CS, Griffin M, Cheng HC. Csk‐homologous kinase (Chk) is an efficient inhibitor of Src‐family kinases but a poor catalyst of phosphorylation of their C‐terminal regulatory tyrosine. Cell Commun Signal. 2017;15:29. [DOI] [PMC free article] [PubMed] [Google Scholar]
- 63. Zhu S, Bjorge JD, Cheng HC, Fujita DJ. Decreased CHK protein levels are associated with Src activation in colon cancer cells. Oncogene. 2008;27:2027–2034. [DOI] [PubMed] [Google Scholar]
- 64. Pena‐Munzenmayer G, George AT, Shull GE, Melvin JE, Catalan MA. Ae4 (Slc4a9) is an electroneutral monovalent cation‐dependent Cl‐/HCO3‐ exchanger. J Gen Physiol. 2016;147:423–436. [DOI] [PMC free article] [PubMed] [Google Scholar]
- 65. Okumoto K, Itoh R, Shimozawa N, Suzuki Y, Tamura S, Kondo N, Fujiki Y. Mutations in PEX10 is the cause of Zellweger peroxisome deficiency syndrome of complementation group B. Hum Mol Genet. 1998;7:1399–1405. [DOI] [PubMed] [Google Scholar]
- 66. Berberich AJ, Hegele RA. The complex molecular genetics of familial hypercholesterolaemia. Nat Rev Cardiol. 2019;16:9–20. [DOI] [PubMed] [Google Scholar]
Associated Data
This section collects any data citations, data availability statements, or supplementary materials included in this article.
Supplementary Materials
Data S1. Methods for DNA quantification and DNA qualitative assessment.
Table S1. Comb‐p DMR Meta‐Analysis Results of the Discovery and Validation Sets
Table S2. Probes With Nominal P<0.05 Found in Both Discovery and Validation Cohorts That Are Common to Previous EWAS of All‐Cause Mortality