

Abstract
Background
Epidemiological studies have reported a link between serum LBP (lipopolysaccharide‐binding protein) levels and lifestyle‐related diseases. However, there have been no longitudinal studies investigating the association of serum LBP levels and the incidence of cardiovascular disease (CVD) in general populations.
Methods and Results
A total of 2568 community‐dwelling Japanese individuals 40 years and older without prior CVD were followed for 10 years (2002–2012). Serum LBP levels were divided into quartiles (quartile 1: 2.20–9.68 μg/mL; quartile 2: 9.69–10.93 μg/mL; quartile 3: 10.94–12.40 μg/mL; quartile 4: 12.41–24.34 μg/mL). The hazard ratios (HRs) and their 95% CIs for the incidence of CVD were computed using a Cox proportional hazards model. During the follow‐up period, 180 individuals developed CVD. The age‐ and sex‐adjusted cumulative incidence of CVD increased significantly with higher serum LBP levels (P for trend=0.005). Individuals with higher serum LBP levels had a significantly greater risk of the development of CVD after adjusting for conventional cardiovascular risk factors (quartile 1: HR, 1.00 [reference]; quartile 2: HR, 1.04 [95% CI, 0.60–1.78]; quartile 3: HR, 1.52 [95% CI, 0.92–2.51]; and quartile 4: HR, 1.90 [95% CI, 1.17–3.09]; P for trend=0.01). This association remained significant after additional adjustment for homeostasis model assessment of insulin resistance (P for trend=0.01). However, when additional adjustment was made for high‐sensitivity C‐reactive protein, the association was attenuated to the nonsignificant level (P for trend=0.08).
Conclusions
The present findings suggest that higher serum LBP levels are associated with increased risk of the development of CVD in the general Japanese population. Low‐grade endotoxemia may contribute to the pathogenesis of CVD through chronic systemic inflammation.
Keywords: cardiovascular disease, endotoxemia, epidemiology, follow‐up studies, lipopolysaccharide‐binding protein
Subject Categories: Cardiovascular Disease, Epidemiology, Atherosclerosis
Clinical Perspective
What Is New?
This is the first prospective cohort study to examine the association between serum LBP (lipopolysaccharide‐binding protein) levels and the incidence of cardiovascular disease in a general Japanese population.
Higher serum LBP levels were significantly associated with the development of cardiovascular disease even after adjustment for conventional cardiovascular risk factors and homeostasis model assessment of insulin resistance, an index of insulin resistance.
This association was attenuated after adjustment for high‐sensitivity C‐reactive protein, a marker of low‐grade systemic inflammation.
What Are the Clinical Implications?
The findings of this study highlight that low‐grade metabolic endotoxemia may contribute to the pathogenesis of atherosclerosis and subsequent cardiovascular disease through chronic systemic inflammation.
Further investigations are needed to elucidate the mechanism underlying the association between serum LBP levels and cardiovascular risk.
Introduction
Cardiovascular disease (CVD) is the leading cause of mortality worldwide, accounting for 17.9 million deaths every year and 31% of all global deaths.1 Atherosclerotic diseases including stroke and coronary artery disease are the most common forms of CVD.2, 3 Although it has been widely acknowledged that atherosclerosis is promoted by the chronic inflammation of blood vessels,4 the causes of chronic inflammation remain unclear. In recent years, lipopolysaccharide, which is a component of the outer membrane of gram‐negative bacteria, has been noted as a potential source of chronic low‐grade systemic inflammation.5 Gram‐negative bacteria colonize as resident microbiota in the human gastrointestinal, genitourinary, and respiratory tracts, and in the oral cavity. Recently, the condition of chronically elevated serum lipopolysaccharide, in which serum levels are 10 to 50 times lower than those for patients with sepsis, has been designated “metabolic endotoxemia.”6 Several studies of mice7, 8, 9, 10 and humans11, 12, 13, 14 have shown that metabolic endotoxemia is linked with metabolic disturbances such as obesity, insulin resistance, and diabetes mellitus.
LBP (lipopolysaccharide‐binding protein), an acute‐phase protein with a molecular mass of <60 kDa, binds multimers of lipopolysaccharide in the blood and transfers monomers of lipopolysaccharide to the cellular receptor complex consisting of CD14, MD2, and Toll‐like receptor (TLR) 4, which activates immune cells through the production of proinflammatory cytokines such as tumor necrosis factor‐α, interleukin 1, interleukin 6, interleukin 8, and interferon β.5, 15, 16 When lipopolysaccharide enters into the blood even at a subclinical level of inflammation, LBP is synthesized mainly in the liver, reflecting the activation of inflammatory response.17, 18 Serum LBP concentrations in healthy individuals are in the range of ≈0.1 to 10 μg/mL, but increase more than 10‐fold during acute inflammation.11, 17 In addition, it has been reported that serum LBP concentrations reach a peak in 12 hours after a small amount of lipopolysaccharide exposure19 and LBP has a longer half‐life than lipopolysaccharide in blood.15, 19 Therefore, the serum LBP concentration is a stable indicator of exposure to lipopolysaccharide.15, 20, 21 Several epidemiological studies have reported cross‐sectional associations of serum LBP levels with the presence of atherosclerosis22, 23 and CVD.24 On the other hand, there has been only one longitudinal study addressing the influence of serum LBP levels on the development of CVD. In that hospital‐based longitudinal study, a significant association was found between serum LBP levels and cardiovascular mortality in patients with high cardiovascular risk who underwent coronary angiography.25 No population‐based studies have examined the association between serum LBP levels and the development of CVD. Herein, we investigated the association of serum LBP levels with the development of CVD on the basis of a prospective study in a general Japanese population.
Methods
The data, analytic methods, and study materials will not be made available to other researchers for purposes of reproducing the results or replicating the procedure.
Study Design and Participants
The Hisayama Study is an ongoing population‐based prospective cohort study of CVD in the town of Hisayama, which is a suburb of Fukuoka City in Japan. The detailed design of the study has been previously described.26, 27 In brief, an annual health examination of all residents 40 years and older in this town has been repeated since 1961, and the residents have been followed continuously to clarify the risk factors of CVD and other lifestyle‐related diseases. The screening survey for the present study was performed in 2002 and 2003, with a total of 3328 residents 40 years and older participating (participation rate 77.6%). After excluding 30 individuals who did not consent to participate in this study, 190 individuals with a history of stroke or coronary heart disease (CHD) at baseline, 448 individuals without available data for serum LBP concentrations, 68 individuals with blood samples in a nonfasting state, and 24 individuals with missing data on ECG or serum insulin levels, the remaining 2568 individuals (1086 men and 1482 women) were enrolled in the study. This study was approved by the Kyushu University's institutional review board for clinical research, and written informed consent was obtained from all participants.
Follow‐Up Survey
The participants were prospectively followed from the day of the screening survey to November 2012 or their death (median follow‐up, 10.2 years; interquartile range, 10.1–10.3 years). Information about new cardiovascular events, including stroke and CHD, was collected by annual health examinations and a daily monitoring system established by the study team, local physicians, and members of the Health and Welfare Office of the town. For the individuals who did not undergo yearly examination or who had moved out of town, the study team sent letters or telephoned to obtain information. When a participant died, clinical information including medical records and death certificates was collected and autopsy examinations were performed at the Department of Pathology of Kyushu University if consent for autopsy was obtained. All available information about suspected CVD events and deaths was collected and reviewed by physicians in the study team. During the follow‐up period, no participants, except for deceased cases, were lost to follow‐up and 192 (60.0%) of 320 deceased individuals underwent autopsy examinations. Among the deceased individuals, 80 died of CVDs, 115 of cancer, 46 of fatal infection (36 individuals with pneumonia, 7 individuals with sepsis, 2 individuals with nontuberculous mycobacteria, and 1 individual with tuberculosis), and 79 of other causes.
Measurement of Serum LBP Concentrations
Serum specimens collected at the baseline screening survey were stored at −80°C until serum LBP concentrations were measured in 2018. Serum LBP levels were quantitatively detected using enzyme‐linked immunosorbent assay kits (Hycult Biotech; catalog number, HK315) in accordance with the manufacturer's instructions. The participants were divided into 4 categories according to the quartiles of serum LBP levels (quartile 1: 2.20–9.68 μg/mL; quartile 2: 9.69–10.93 μg/mL; quartile 3: 10.94–12.40 μg/mL; quartile 4: 12.41–24.34 μg/mL). The quartiles were based on all participants, not separately in men and women.
Outcomes
The main outcome of the present study was the development of CVD, which was defined as a first‐ever episode of either stroke or CHD. Stroke was defined as a sudden onset of nonconvulsive and focal neurological deficit persisting for >24 hours. The diagnosis of stroke and its subtypes, including ischemic stroke and hemorrhagic stroke (intracerebral or subarachnoid hemorrhage), was determined by study team physicians using medical history, neurological examination, and available clinical data including brain imaging (computed tomography and magnetic resonance imaging) and autopsy findings. CHD was defined as either an episode of acute myocardial infarction, silent myocardial infarction, coronary artery disease followed by coronary angioplasty or coronary artery bypass graft surgery, or sudden cardiac death. Acute myocardial infarction was diagnosed when a participant met at least 2 of the following criteria: (1) typical symptoms, such as prolonged severe chest pain; (2) elevation of cardiac enzymes more than twice the upper limit of the normal range; (3) diagnostic ECG changes, including abnormal Q waves, ST elevation, and ST depression; and (4) any morphological changes—namely, local asynergy of cardiac wall motion on echocardiography, persistent regional myocardial perfusion defect on cardiac scintigraphy, or myocardial necrosis and scars >1 cm in diameter by coronary atherosclerosis at autopsy. Silent myocardial infarction was defined as myocardial scarring without any clinical symptoms or elevated cardiac enzymes. Sudden cardiac death was defined as a participant dying within 1 hour after the onset of acute illness, in the absence of any apparent cause of death other than heart disease, based on available medical history and clinical data.
Other Risk Factor Measurements
At the baseline examination, a self‐administered questionnaire was used to collect information on smoking habits, alcohol intake, physical activity, medical history, and medication for hypertension, diabetes mellitus, and dyslipidemia. Smoking habits and alcohol intake were categorized as either current use or not. Regular exercise was defined as participation in sports or other forms of physical activity at least 3 times a week during a participant's leisure time. Body height and weight were measured in light clothing without shoes, and body mass index was calculated (kg/m2). Blood pressure (BP) was measured 3 times using an automated sphygmomanometer after a rest of at least 5 minutes in a sitting position. The mean of the 3 measurements was used for analysis. Hypertension was defined as BP levels ≥140/90 mm Hg and/or current use of antihypertensive agents. ECG abnormalities were defined as left ventricular hypertrophy (Minnesota Code, 3‐1), ST depression (4‐1, 2, 3), or atrial fibrillation or atrial flutter (8‐3). Blood samples were collected from an antecubital vein after overnight fasting. Plasma glucose levels were measured by the hexokinase method, and serum insulin levels were determined by a commercial double antibody solid‐phase radioimmunoassay (Phadeseph Insulin; Pharmacia Diagnostics AB). Diabetes mellitus was determined by plasma glucose levels (fasting glucose level ≥7.0 mmol/L or 2‐hour post‐load glucose level after 75‐g oral glucose tolerance test ≥11.1 mmol/L, using the 1998 World Health Organization criteria) and/or current use of glucose‐lowering agents (ie, oral hypoglycemic agents or insulin). Insulin resistance was evaluated by homeostasis model assessment of insulin resistance (HOMA‐IR) values,28 calculated as follows: HOMA‐IR=fasting plasma glucose (mmol/L)×fasting serum insulin (μU/mL)/22.5. Serum total cholesterol, high‐density lipoprotein cholesterol, and triglyceride levels were measured enzymatically. Estimated glomerular filtration rate (eGFR) was calculated according to the Chronic Kidney Disease Epidemiology Collaboration equation for Japanese.29 Serum hs‐CRP (high‐sensitivity C‐reactive protein) concentrations were measured using a modified version of the Behring Latex‐Enhanced CRP assay on a Behring Nephelometer BN‐100 (Behring Diagnostics).
Statistical Analysis
Serum triglycerides, HOMA‐IR, and serum hs‐CRP were log‐transformed before application to the statistical models because of skewed distributions. The age‐ and sex‐adjusted mean values and frequencies for risk factors were calculated using ANCOVA and logistic regression analysis, respectively. The linear trends across serum LBP levels were tested using linear regression for mean values and logistic regression for frequencies. Correlation between serum LBP levels and risk factors was assessed using Pearson correlation for continuous variables or Spearman rank correlation for categorical variables. The age‐ and sex‐adjusted cumulative incidence of outcomes across serum LBP levels was determined on the basis of regression estimates from a Cox proportional hazards model including age and sex.30 The age‐ and sex‐adjusted incidence rate of outcomes (per person‐years) was calculated by direct method using the total examined population, which was stratified by 10‐year age groups and sex as the standard. Hazard ratios (HRs) and 95% CIs were calculated by Cox proportional hazards model. We evaluated 4 different models as follows: (1) model 1, adjusted for age and sex; (2) model 2, adjusted for age, sex, systolic BP, use of antihypertensive agents, diabetes mellitus, serum total cholesterol, serum high‐density lipoprotein cholesterol, serum triglycerides, use of lipid‐modifying agents, body mass index, eGFR, ECG abnormalities, smoking habits, alcohol intake, and regular exercise; (3) model 3, adjusted for the covariates included in model 2 plus HOMA‐IR; and (4) model 4, adjusted for the covariates included in model 2 plus hs‐CRP. The risk estimates per 1‐SD increment of the serum LBP levels were used to evaluate the association between serum LBP concentrations taken as a continuous variable and outcomes. For sensitivity analyses, we performed the analysis after excluding individuals with higher white blood cell counts (white blood cell count ≥8600/μL, 95th percentile point) to account for the influence of prior infections. In addition, we repeated the analysis after excluding individuals who had died as a result of fatal infection during follow‐up and performed a competing risk analysis of death caused by fatal infection by using the method proposed by Fine and Gray.31 The heterogeneity in the magnitude of the association of serum LBP levels with the risk of CVD across subgroups of risk factors was tested by adding a multiplicative interaction term to the relevant Cox model. All analyses were performed using SAS software package version 9.4 (SAS Institute). Two‐sided P values <0.05 were considered statistically significant in all analyses. Histograms and scatter plots were generated using Stata software package release 13 (StataCorp).
Results
The distribution of serum LBP levels in the study population was nearly normal, as shown in Figure 1. The mean value of serum LBP levels was 11.2 μg/mL (SD, 2.3 μg/mL) and the median value was 10.9 μg/mL (interquartile range, 9.7–12.4 μg/mL). The mean value of serum LBP concentrations was significantly higher in men than women (11.4 μg/mL versus 11.0 μg/mL, P<0.0001).
Figure 1.
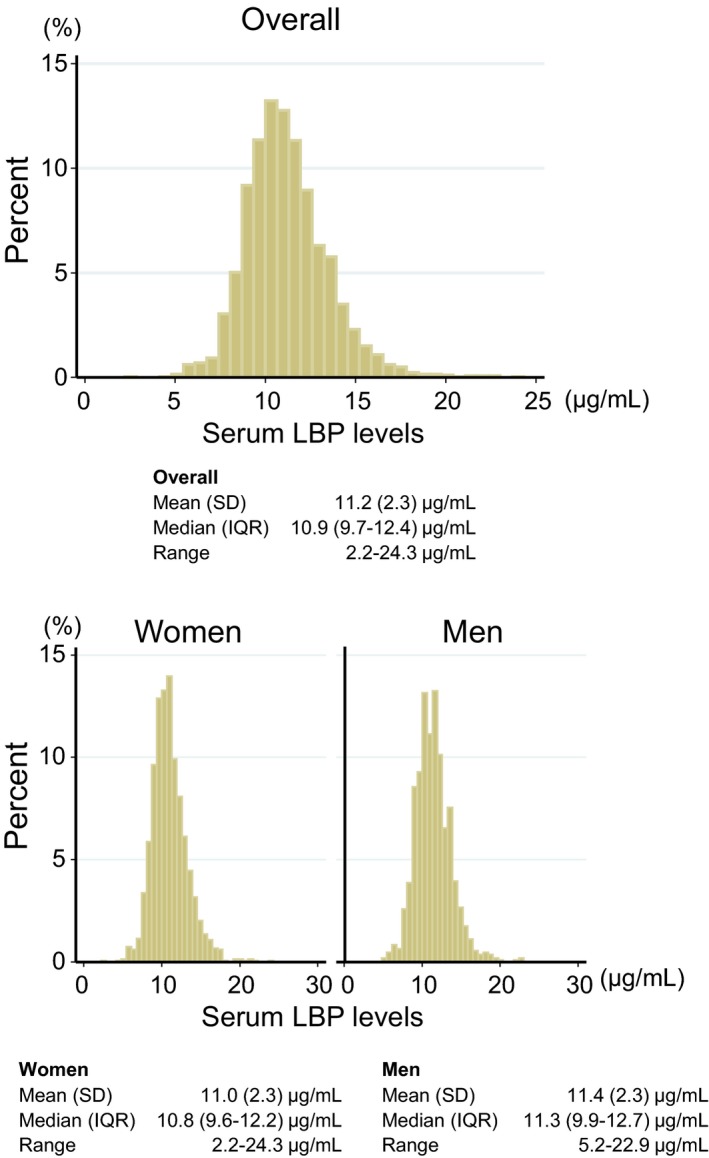
Histogram of serum concentrations of LBP (lipopolysaccharide‐binding protein) in the study population (n=2568), 2002. IQR indicates interquartile range.
The age‐ and sex‐adjusted baseline characteristics of the study population according to the quartile of serum LBP levels are summarized in Table 1. The mean values of age, systolic BP, diastolic BP, serum total cholesterol, and body mass index; the geometric mean values of serum triglyceride, HOMA‐IR, and serum hs‐CRP; the percentage of men; and the frequencies of use of antihypertensive agents, diabetes mellitus, use of lipid‐modifying agents, and ECG abnormalities were significantly increased with higher serum LBP levels. The mean value of serum high‐density lipoprotein cholesterol was significantly decreased with higher serum LBP levels. The unadjusted and age‐ and sex‐adjusted correlation coefficients between serum LBP concentrations and other variables in the study population are shown in Table S1. Among the variables, serum hs‐CRP concentration had the strongest positive correlation with serum LBP concentrations (unadjusted correlation coefficient=0.62 [P<0.0001] and age‐ and sex‐adjusted correlation coefficient=0.60 [P<0.0001]) (Figure 2 and Table S1).
Table 1.
Age‐ and Sex‐Adjusted Baseline Characteristics According to Serum LBP Levels (n=2568), 2002
| Variables | Serum LBP Levels, μg/mL | P for Trend | |||
|---|---|---|---|---|---|
| Quartile 1 | Quartile 2 | Quartile 3 | Quartile 4 | ||
| 2.20–9.68 (n=641) | 9.69–10.93 (n=643) | 10.94–12.40 (n=639) | 12.41–24.34 (n=645) | ||
| Age, mean (SE), y | 57.0 (0.5) | 60.0 (0.5) | 61.8 (0.5) | 64.2 (0.5) | <0.0001 |
| Men, % | 34.4 | 38.9 | 46.0 | 49.7 | <0.0001 |
| Systolic BP, mean (SE), mm Hg | 126.7 (0.8) | 132.4 (0.8) | 133.0 (0.8) | 134.1 (0.8) | <0.0001 |
| Diastolic BP, mean (SE), mm Hg | 75.8 (0.5) | 78.6 (0.5) | 79.3 (0.5) | 80.1 (0.5) | <0.0001 |
| Use of antihypertensive agents, % | 13.2 | 18.4 | 21.9 | 22.7 | <0.0001 |
| Diabetes mellitus, % | 8.7 | 13.2 | 16.9 | 18.6 | <0.0001 |
| Use of glucose‐lowering agents, % | 2.5 | 3.0 | 4.2 | 3.9 | 0.10 |
| Serum total cholesterol, mean (SE), mmol/L | 5.04 (0.04) | 5.35 (0.04) | 5.37 (0.04) | 5.40 (0.04) | <0.0001 |
| Serum HDL cholesterol, mean (SE), mmol/L | 1.71 (0.02) | 1.66 (0.02) | 1.60 (0.02) | 1.54 (0.02) | <0.0001 |
| Serum triglyceride, geometric mean (95% CI), mmol/L | 0.9 (0.9–1.0) | 1.2 (1.1–1.2) | 1.2 (1.2–1.3) | 1.3 (1.2–1.3) | <0.0001 |
| Use of lipid‐modifying agents, % | 4.9 | 7.7 | 8.8 | 7.7 | 0.04 |
| BMI, mean (SE), kg/m2 | 21.8 (0.1) | 22.9 (0.1) | 23.7 (0.1) | 24.0 (0.1) | <0.0001 |
| eGFR, mean (SE), mL/min per 1.73 m2 | 80.0 (0.7) | 78.9 (0.7) | 79.9 (0.7) | 78.2 (0.7) | 0.25 |
| ECG abnormalities, % | 12.1 | 14.6 | 15.3 | 16.7 | 0.02 |
| Smoking habits, % | 16.0 | 14.5 | 13.3 | 18.3 | 0.41 |
| Alcohol intake, % | 41.3 | 45.3 | 43.0 | 41.3 | 0.94 |
| Regular exercise, % | 10.4 | 10.4 | 10.4 | 10.0 | 0.80 |
| HOMA‐IR, geometric mean (95% CI) | 1.4 (1.3–1.4) | 1.7 (1.6–1.8) | 1.8 (1.7–1.9) | 2.0 (1.9–2.1) | <0.0001 |
| Serum hs‐CRP, geometric mean (95% CI), mg/L | 0.23 (0.22–0.25) | 0.36 (0.34–0.39) | 0.59 (0.55–0.64) | 1.47 (1.36–1.59) | <0.0001 |
BMI indicates body mass index; BP, blood pressure; eGFR, estimated glomerular filtration rate; HDL, high‐density lipoprotein; HOMA‐IR, homeostasis model assessment of insulin resistance; hs‐CRP, high‐sensitivity C‐reactive protein; LBP, lipopolysaccharide‐binding protein; SE, standard error.
Figure 2.
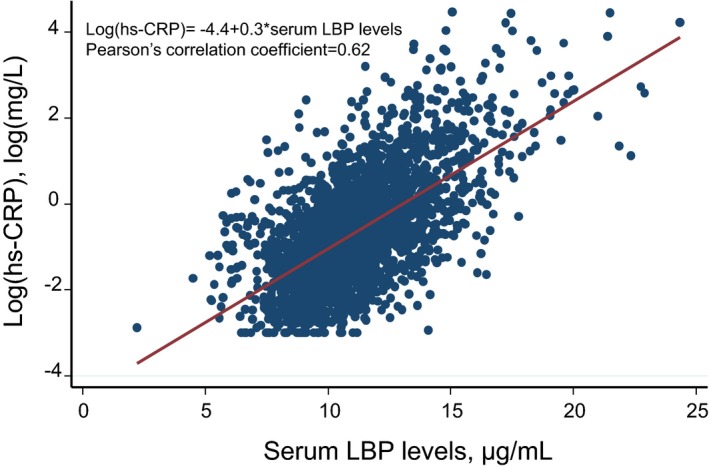
Linear correlation analysis of the association between LBP (lipopolysaccharide‐binding protein) and log‐transformed hs‐CRP (high‐sensitivity C‐reactive protein) (n=2568), 2002.
During the follow‐up period, a total of 180 individuals had a first‐ever CVD event; among them, 108 individuals experienced stroke (74 ischemic stroke and 34 hemorrhagic stroke), and 87 individuals experienced CHD. Figure 3 demonstrates the age‐ and sex‐adjusted cumulative incidence of CVD and its subtypes according to serum LBP levels. The age‐ and sex‐adjusted incidence of total CVD and stroke increased significantly with higher serum LBP levels (P for trend=0.005 and 0.01, respectively). The age‐ and sex‐adjusted cumulative incidence of CHD showed a tendency to increase with higher serum LBP levels (P for trend=0.06), and individuals in the third quartile of serum LBP level had a significantly greater risk of CHD compared with those in the first quartile (ie, the lowest serum LBP quartile). As shown in Table 2, higher serum LBP levels were significantly associated with a higher risk of the development of CVD after adjusting for conventional risk factors of CVD (model 2, P for trend=0.01): the HR increased by 1.23 (95% CI, 1.07–1.41) per 1‐SD increment in the serum LBP concentrations. Individuals in the third and fourth quartile of serum LBP had a 1.5‐ and 1.9‐fold greater risk of CVD than those in the first quartile (Figure S1). This association remained significant even after additional adjustment for HOMA‐IR (model 3, P for trend=0.01): the HR increased by 1.22 (95% CI, 1.16–3.06) per 1‐SD increment in the serum LBP concentrations. However, the additional adjustment for hs‐CRP to model 2 attenuated the association to a nonsignificant level (P for trend=0.08): the HR increased by 1.17 (95% CI, 0.98–1.39) per 1‐SD increment in the serum LBP concentrations. Individuals in the fourth quartile of serum LBP had a 1.7‐fold greater risk of CVD than those in the first quartile.
Figure 3.
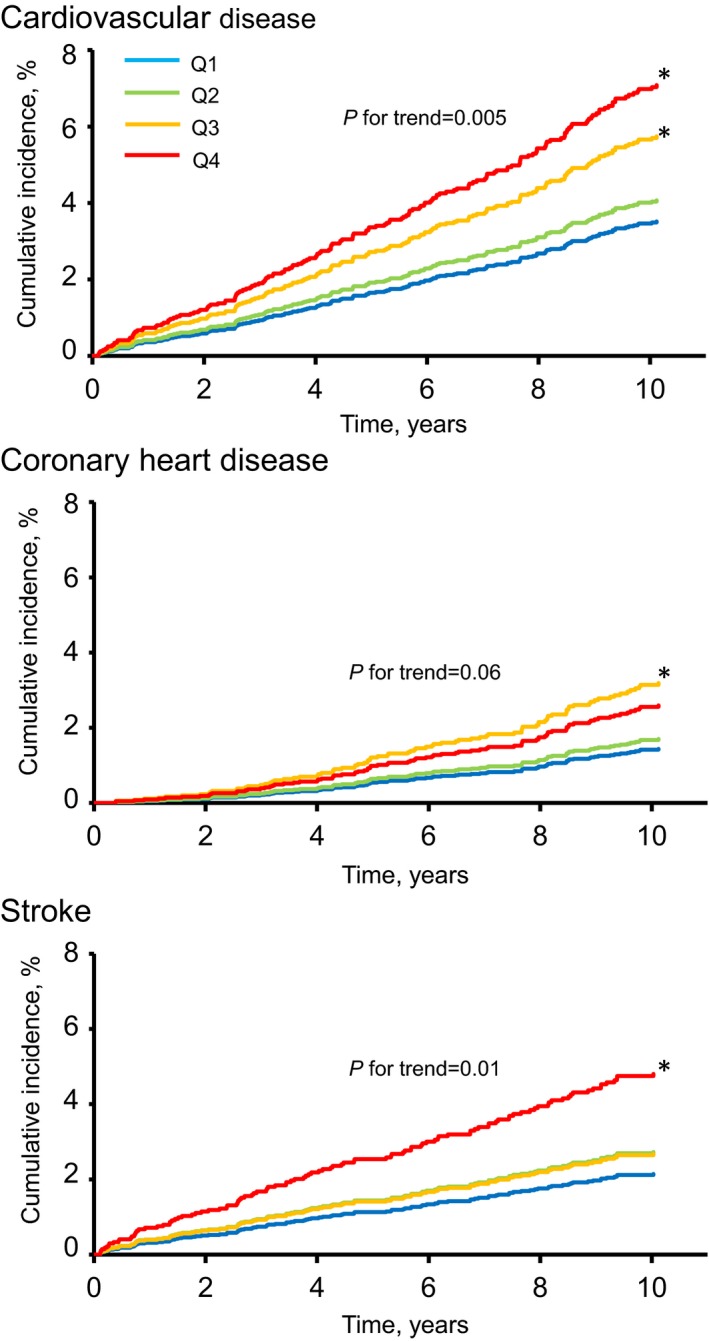
Age‐ and sex‐adjusted cumulative incidence rate of cardiovascular disease and its subtypes according to serum LBP (lipopolysaccharide‐binding protein) levels (n=2568), 2002–2012. Q1 to Q4 indicate ascending quartiles of LBP levels (Q1: 2.20–9.68 μg/mL; Q2: 9.69–10.93 μg/mL; Q3: 10.94–12.40 μg/mL; Q4: 12.41–24.34 μg/mL). *P<0.05 vs the first quartile of LBP levels.
Table 2.
Risk of CVD and its Subtypes According to Serum LBP Levels (n=2568), 2002–2012
| Serum LBP Levels, μg/mL | Individuals at Risk | No. of Events | Incidence Rate (Per 103 PYs)a | HR (95% CI) | |||
|---|---|---|---|---|---|---|---|
| Model 1 | Model 2 | Model 3 | Model 4 | ||||
| CVD | |||||||
| Quartile 1 (2.20–9.68) | 641 | 23 | 6.0 | 1.00 (reference) | 1.00 (reference) | 1.00 (reference) | 1.00 (reference) |
| Quartile 2 (9.69–10.93) | 643 | 33 | 6.3 | 1.16 (0.68–1.98) | 1.04 (0.60–1.78) | 1.04 (0.60–1.78) | 1.02 (0.59–1.75) |
| Quartile 3 (10.94–12.40) | 639 | 52 | 8.3 | 1.65 (1.01–2.71) | 1.52 (0.92–2.51) | 1.51 (0.91–2.50) | 1.44 (0.86–2.41) |
| Quartile 4 (12.41–24.34) | 645 | 72 | 8.3 | 2.05 (1.28–3.30) | 1.90 (1.17–3.09) | 1.88 (1.16–3.06) | 1.72 (1.01–2.93) |
| P for trend | 0.005 | 0.01 | 0.01 | 0.08 | |||
| Per 1‐SD increment in serum LBP concentrations | 2568 | 180 | 1.24 (1.08–1.41) | 1.23 (1.07–1.41) | 1.22 (1.07–1.40) | 1.17 (0.98–1.39) | |
| CHD | |||||||
| Quartile 1 (2.20–9.68) | 641 | 10 | 2.8 | 1.00 (reference) | 1.00 (reference) | 1.00 (reference) | 1.00 (reference) |
| Quartile 2 (9.69–10.93) | 643 | 15 | 2.8 | 1.18 (0.53–2.64) | 1.05 (0.47–2.35) | 1.04 (0.46–2.34) | 1.04 (0.46–2.33) |
| Quartile 3 (10.94–12.40) | 639 | 32 | 5.3 | 2.24 (1.10–4.57) | 1.88 (0.91–3.90) | 1.87 (0.90–3.87) | 1.84 (0.88–3.86) |
| Quartile 4 (12.41–24.34) | 645 | 30 | 3.4 | 1.82 (0.88–3.74) | 1.51 (0.72–3.16) | 1.50 (0.72–3.13) | 1.44 (0.65–3.18) |
| P for trend | 0.06 | 0.17 | 0.18 | 0.21 | |||
| Per 1‐SD increment in serum LBP concentrations | 2568 | 87 | 1.24 (1.03–1.50) | 1.19 (0.97–1.45) | 1.19 (0.97–1.45) | 1.20 (0.93–1.53) | |
| Stroke | |||||||
| Quartile 1 (2.20–9.68) | 641 | 14 | 3.5 | 1.00 (reference) | 1.00 (reference) | 1.00 (reference) | 1.00 (reference) |
| Quartile 2 (9.69–10.93) | 643 | 22 | 4.1 | 1.28 (0.65–2.50) | 1.14 (0.58–2.25) | 1.15 (0.58–2.27) | 1.10 (0.55–2.18) |
| Quartile 3 (10.94–12.40) | 639 | 24 | 3.5 | 1.25 (0.65–2.43) | 1.22 (0.62–2.40) | 1.23 (0.63–2.41) | 1.13 (0.57–2.26) |
| Quartile 4 (12.41–24.34) | 645 | 48 | 5.2 | 2.27 (1.24–4.15) | 2.30 (1.24–4.27) | 2.27 (1.22–4.22) | 1.97 (0.99–3.91) |
| P for trend | 0.01 | 0.005 | 0.007 | 0.08 | |||
| Per 1‐SD increment in serum LBP concentrations | 2568 | 108 | 1.24 (1.04–1.46) | 1.27 (1.06–1.51) | 1.26 (1.06–1.50) | 1.15 (0.92–1.44) | |
| Subtypes of stroke | |||||||
| Ischemic stroke | |||||||
| Quartile 1 (2.20–9.68) | 641 | 8 | 2.0 | 1.00 (reference) | 1.00 (reference) | 1.00 (reference) | 1.00 (reference) |
| Quartile 2 (9.69–10.93) | 643 | 16 | 3.0 | 1.62 (0.69–3.78) | 1.58 (0.67–3.73) | 1.58 (0.67–3.74) | 1.46 (0.61–3.46) |
| Quartile 3 (10.94–12.40) | 639 | 17 | 2.5 | 1.53 (0.66–3.56) | 1.60 (0.68–3.78) | 1.60 (0.68–3.77) | 1.35 (0.56–3.22) |
| Quartile 4 (12.41–24.34) | 645 | 33 | 3.3 | 2.63 (1.20–5.74) | 2.84 (1.28–6.31) | 2.81 (1.26–6.25) | 1.98 (0.82–4.77) |
| P for trend | 0.05 | 0.03 | 0.03 | 0.42 | |||
| Per 1‐SD increment in serum LBP concentrations | 2568 | 74 | 1.28 (1.05–1.57) | 1.32 (1.08–1.61) | 1.31 (1.07–1.60) | 1.10 (0.85–1.43) | |
| Hemorrhagic stroke | |||||||
| Quartile 1 (2.20–9.68) | 641 | 6 | 1.4 | 1.00 (reference) | 1.00 (reference) | 1.00 (reference) | 1.00 (reference) |
| Quartile 2 (9.69–10.93) | 643 | 6 | 1.1 | 0.83 (0.27–2.57) | 0.63 (0.20–2.00) | 0.64 (0.20–2.04) | 0.69 (0.22–2.20) |
| Quartile 3 (10.94–12.40) | 639 | 7 | 1.0 | 0.88 (0.29–2.65) | 0.77 (0.25–2.35) | 0.78 (0.26–2.40) | 0.90 (0.29–2.86) |
| Quartile 4 (12.41–24.34) | 645 | 15 | 1.8 | 1.74 (0.66–4.56) | 1.60 (0.60–4.29) | 1.58 (0.59–4.27) | 2.19 (0.72–6.64) |
| P for trend | 0.30 | 0.21 | 0.24 | 0.11 | |||
| Per 1‐SD increment in serum LBP concentrations | 2568 | 34 | 1.12 (0.81–1.54) | 1.15 (0.80–1.64) | 1.14 (0.79–1.63) | 1.29 (0.82–2.02) | |
Model 1: adjusted for age and sex. Model 2: adjusted for age, sex, systolic blood pressure, use of antihypertensive agents, diabetes mellitus, serum total cholesterol, serum high‐density lipoprotein cholesterol, serum triglycerides, use of lipid‐modifying agents, body mass index, estimated glomerular filtration rate, ECG abnormalities, smoking habits, alcohol intake, and regular exercise. Model 3: adjusted for the covariates included in model 2+homeostasis model assessment of insulin resistance. Model 4: adjusted for the covariates included in model 2+serum high‐sensitivity C‐reactive protein. CHD indicates coronary heart disease; CVD, cardiovascular disease; HR, hazard ratio; LBP, lipopolysaccharide‐binding protein; PYs, person‐years.
Age‐ and sex‐adjusted.
With regard to the subtypes of CVD, similar associations with higher serum LBP were observed for the development of stroke and CHD, but the association between higher serum LBP and CHD did not reach the level of statistical significance. With regard to stroke subtypes, higher serum LBP levels were significantly associated with an increased risk of ischemic stroke, whereas there was no evidence of a significant association between serum LBP levels and the risk of hemorrhagic stroke.
We performed the sensitivity analysis after excluding individuals with higher white blood cell counts. As a consequence, the associations between serum LBP and risk of CVD were not substantially changed (Table S2). In addition, similarly significant associations between serum LBP levels and CVD risk were also observed in the analysis excluding individuals who died as a result of fatal infection during the follow‐up (Table S3), as well as in the competing risk analysis, in which the competing event was defined as premature death caused by fatal infection (Table S4).
Table 3 shows that there was no evidence of heterogeneity in the association of per 1‐SD increment in serum LBP levels with the risk of CVD between participants with and those without risk factors (all P for heterogeneity >0.10), except for alcohol intake. The association of serum LBP levels with the risk of CVD seemed to be weaker among the current drinkers than the nondrinkers. We further investigated the influence of the amount of drinking on the association between serum LBP levels and CVD risk, by dividing current drinkers for whom drinking quantity data were available (n=1119) into 2 categories by the median drinking quantity: alcohol drinking <18 g ethanol per day (n=541) and ≥18 g ethanol per day (n=578). As a consequence, there was no significant association between serum LBP levels and the multivariable‐adjusted risk of CVD in either of the current‐drinker subgroups, and no evidence of heterogeneity among the groups with no drinking, light drinking, and heavy drinking (P for heterogeneity=0.16, Table S5).
Table 3.
Multivariable‐Adjusted HRs Per 1‐SD Increment in Serum LBP Level for CVD by the Presence or Absence of Other Cardiovascular Risk Factors (n=2568), 2002–2012
| Variables | Individuals at Risk | No. of Events | HR (95% CI) Per 1‐SD Increment in Serum LBP | P for Heterogeneity |
|---|---|---|---|---|
| Overall | 2568 | 180 | 1.23 (1.07–1.41) | |
| Age | ||||
| <70 y | 1894 | 86 | 1.35 (1.10–1.66) | 0.15 |
| ≥70 y | 674 | 94 | 1.13 (0.94–1.36) | |
| Sex | ||||
| Men | 1086 | 100 | 1.19 (0.99–1.44) | 0.83 |
| Women | 1482 | 80 | 1.29 (1.05–1.60) | |
| Hypertension | ||||
| No | 1502 | 68 | 1.22 (0.96–1.56) | 0.70 |
| Yes | 1066 | 112 | 1.21 (1.02–1.43) | |
| Diabetes mellitus | ||||
| No | 2181 | 135 | 1.28 (1.10–1.50) | 0.22 |
| Yes | 387 | 45 | 1.01 (0.73–1.40) | |
| BMI | ||||
| <25 kg/m2 | 1894 | 136 | 1.22 (1.04–1.42) | 1.00 |
| ≥25 kg/m2 | 674 | 44 | 1.23 (0.89–1.70) | |
| eGFR | ||||
| ≥60 mL/min per 1.73 m2 | 2236 | 140 | 1.21 (1.03–1.41) | 0.72 |
| <60 mL/min per 1.73 m2 | 332 | 40 | 1.32 (0.97–1.80) | |
| ECG abnormalities | ||||
| No | 2152 | 117 | 1.24 (1.05–1.46) | 0.65 |
| Yes | 416 | 63 | 1.29 (0.98–1.69) | |
| Smoking habits | ||||
| No | 1986 | 142 | 1.26 (1.08–1.47) | 0.64 |
| Yes | 582 | 38 | 1.15 (0.83–1.59) | |
| Alcohol intake | ||||
| No | 1432 | 104 | 1.36 (1.14–1.61) | 0.09 |
| Yes | 1136 | 76 | 1.08 (0.86–1.36) | |
| Regular exercise | ||||
| No | 2299 | 164 | 1.22 (1.05–1.42) | 0.64 |
| Yes | 269 | 16 | 1.54 (1.00–2.36) | |
| HOMA‐IR | ||||
| ≤1.6 | 1220 | 82 | 1.22 (1.01–1.48) | 0.95 |
| >1.6 | 1348 | 98 | 1.23 (1.00–1.50) | |
| Use of antihypertensive agents, glucose‐lowering agents, and/or lipid‐modifying agents | ||||
| No | 1895 | 52 | 1.08 (0.99–1.18) | 0.63 |
| Yes | 673 | 35 | 1.12 (1.02–1.22) | |
The model was adjusted for age, sex, systolic blood pressure, use of antihypertensive agents, diabetes mellitus, serum total cholesterol, serum high‐density lipoprotein cholesterol, serum triglycerides, use of lipid‐modifying agents, body mass index (BMI), estimated glomerular filtration rate (eGFR), ECG abnormalities, smoking habits, alcohol intake, and regular exercise. The variables relevant to the subgroup were excluded from the corresponding model. CVD indicates cardiovascular disease; HOMA‐IR, homeostasis model assessment of insulin resistance; HR, hazard ratio; LBP, lipopolysaccharide‐binding protein.
Discussion
In this prospective study of a general Japanese population, we demonstrated that higher serum LBP levels were significantly associated with the development of CVD even after adjustment for conventional cardiovascular risk factors and HOMA‐IR, an index of insulin resistance. Intriguingly, these associations were attenuated after adjustment for hs‐CRP, a marker of low‐grade systemic inflammation. With regard to the CVD subtypes, individuals with higher serum LBP levels had a significantly greater risk of stroke, especially ischemic stroke, whereas there was no statistically significant association between serum LBP levels and hemorrhagic stroke. The risk of CHD showed a tendency to increase with elevated serum LBP levels, but this association was not statistically significant, probably because the analysis lacked sufficient statistical power. Therefore, it may be reasonable to assume that chronic exposure to lipopolysaccharide plays an important role for the development of CVD through chronic systemic inflammation.
Several epidemiological studies have reported an association between serum LBP levels and the presence of atherosclerosis and CVD.22, 23, 24, 25 Two previous cross‐sectional studies showed that serum LBP levels were positively associated with atherosclerosis as assessed by carotid intima‐media thickness22 or aortic pulse wave velocity.23 One cross‐sectional study showed a significant positive association between serum LBP levels and prevalent coronary artery disease in men undergoing elective coronary angiography.24 In addition, one hospital‐based prospective study found that higher serum LBP levels were significantly associated with greater risks of all‐cause and cardiovascular mortality after adjustment for established cardiovascular risk factors in patients who had undergone coronary angiography.25 To the best of our knowledge, this is the first population‐based prospective study showing that elevated levels of serum LBP were a significant risk factor for the development of CVD in a general population.
Because this was an observational study, we cannot make interferences regarding causality. Nonetheless, several biological mechanisms could potentially explain the positive association between serum LBP levels and the development of CVD. LBP is produced primarily by the liver and helps mediate the lipopolysaccharide‐induced inflammatory response.17 Recently, metabolic concentrations of serum lipopolysaccharide have been found to trigger insulin resistance and obesity in mice7, 8 and humans.32 Previous reports have also shown that LBP is synthesized in adipocytes and plays a role in inflammation‐ and obesity‐associated adipose tissue dysfunction.33, 34 In addition, a positive association between serum LBP levels and the risk of insulin resistance or metabolic syndrome has been demonstrated in both cross‐sectional11, 14, 18, 35, 36 and prospective13, 37 studies. These findings suggest that the association between serum LBP levels and the future development of CVD might be attributable to the presence of insulin resistance, as insulin resistance has been recognized as one of the established risk factors for CVD.38 However, in the present study, a significant association between serum LBP levels and the risk of CVD remained even after adjustment for HOMA‐IR. Another possible explanation is that the association between serum LBP and future CVD involves subclinical low‐grade inflammation induced by lipopolysaccharide‐LBP complexes. Chronic low‐grade systemic inflammation has been well acknowledged to cause atherosclerosis, followed by CVD.4 Recent studies have suggested that cytokines produced by the TLR4 downstream pathway could cause chronic low‐grade inflammation.39 Genetic deficiency of TLR4 or its downstream myeloid differentiation factor 88 were reported to reduce atherosclerosis in a hypercholesterolemic mouse model.40 In human atherosclerotic plaques, expression of TLRs (TLR1, TLR2, and TLR4) was markedly enhanced.41 In the present study, the serum LBP concentration was strongly correlated with the serum hs‐CRP concentration, and the association between serum LBP and cardiovascular risk was largely attenuated after additional adjustment for hs‐CRP. These findings may suggest that serum lipopolysaccharide from microbiota in the gut or other sites in the body is a major source of chronic systemic inflammation, which, in turn, increases the risk of CVD. Nevertheless, as stated above, a marginal association between serum LBP and cardiovascular risk was still observed after adjusting for serum hs‐CRP concentrations. A previous study in mice revealed that high dietary fat composition induced low‐grade inflammation through the active transport of lipopolysaccharide.42 In addition, patients with obstructive sleep apnea had a higher serum LBP concentration than those without.43 These findings raise the possibility that residual confounders (eg, high‐fat diet, sleep apnea, and inflammatory cytokines) or other underlying mechanisms may exist in the association between serum LBP level and cardiovascular risk. Clearly, further research will be needed to elucidate the mechanism between serum LBP and cardiovascular risk.
In the present study, we found that the association between serum LBP levels and the risk of CVD was lower in current drinkers than those who do not consume alcohol, but the precise reason for this finding is unclear. A recent study reported that patients with severe alcoholic hepatitis were likely to have a higher serum LBP level than those without,44 while premature death might happen before the onset of CVD in such conditions, potentially leading to an apparent decrease in the HR for CVD. Furthermore, the favorable effect of mild‐moderate alcohol consumption on cardiovascular risk may affect the association between serum LBP levels and the risk of CVD.45 On the other hand, this finding may simply reflect the play of chance, because our additional subgroup analysis of the effect of alcohol quantity failed to reveal a significant heterogeneity across the alcohol quantity subgroups. The influence of alcohol intake on the association between serum LBP levels and CVD should be reviewed in other cohorts.
Study Strengths and Limitations
The strengths of our study include its community‐based prospective cohort study design, high rate of participation in the screening examination, perfect follow‐up of participants, and accurate diagnosis of CVD and its subtypes based on the available clinical information and autopsy findings. Several limitations should also be noted. First, serum LBP levels were based on only a single measurement at baseline. During the follow‐up period, the serum LBP levels and other risk factors may have changed, therefore misclassification was possible. This could have weakened the association demonstrated in this study. Second, although we tried to control for a wide range of confounding factors in this analysis, we could not exclude the possibility of residual confounding. Third, information on prior infections was not available in the present study. Prior infections, especially shortly before blood sampling, could have caused an acute increase in serum LBP, leading to misclassification of the chronic levels of serum LBP. However, sensitivity analysis in which individuals with higher white blood cell counts were excluded did not make any material difference in the findings. In addition, the significant associations between serum LBP levels and CVD risk were also found in the analyses accounting for the events of fatal infection during follow‐up. These findings may suggest that acute infection had little influence on our findings. Fourth, we did not have any information on gut permeability, and therefore we could not clarify the major organ that contributed to the source of increased serum lipopolysaccharide. Fifth, data on inflammatory cytokines other than hs‐CRP were not available, thus we could not perform more detailed analysis to uncover the biological mechanism. Finally, it remains unclear whether the conclusion of this Japanese population‐based study can be generalized to other ethnic populations with different genetic backgrounds and lifestyles. These results should be validated by other large‐scale, population‐based prospective cohort studies in different populations.
Conclusions
The present study clearly demonstrated that elevated serum LBP levels were associated with the development of CVD. These findings highlight that low‐grade metabolic endotoxemia may contribute to the pathogenesis of atherosclerosis and subsequent CVD through chronic systemic inflammation. However, it remains to be clarified whether serum LBP levels would be a suitable therapeutic target. Further investigations are needed to elucidate the mechanism underlying the association between serum LBP levels and cardiovascular risk.
Sources of Funding
This study was supported in part by Grants‐in‐Aid for Scientific Research (A) (JP16H02692) and (B) (JP16H05850, JP17H04126, and JP18H02737) and (C) (JP17K09114, JP17K09113, JP17K01853, JP18K07565, JP18K09412, and JP19K07890) and (Early‐Career Scientists) (JP18K17925, and JP18K17382) from the Ministry of Education, Culture, Sports, Science and Technology of Japan; by Health and Labour Sciences Research Grants of the Ministry of Health, Labour and Welfare of Japan (H29‐Junkankitou‐Ippan‐003, and H30‐Shokuhin‐[Sitei]‐005); and by the Japan Agency for Medical Research and Development (JP19dk0207025, JP19ek0210082, JP19ek0210083, JP19km0405202, JP19ek0210080, and JP19fk0108075). This study was also supported by the Suntory Global Innovation Center Limited (Kyoto, Japan).
Disclosures
Ninomiya obtained funding support from the Suntory Global Innovation Center (Kyoto, Japan). Suzuki, Watanabe, and Murayama are employed by the Suntory Global Innovation Center Limited (Kyoto, Japan). The remaining authors have no disclosures to report.
Supporting information
Table S1. Correlations Between Serum LBP Levels and Other Variables (n=2568), 2002
Table S2. Association Between Serum LBP Levels and the Development of CVD and its Subtypes After Excluding Patients With White Blood Cell Count ≥8600/μL (n=2432), 2002–2012
Table S3. Association Between Serum LBP Levels and the Development of CVD and its Subtypes After Excluding Patients Who Died of Fatal Infection During Follow‐Up (n=2522), 2002–2012
Table S4. Risk of CVD and its Subtypes According to Serum LBP Levels Using the Method Proposed by Fine and Gray (n=2568), 2002–2012
Table S5. Multivariable‐Adjusted HRs Per 1‐SD Increment in Serum LBP Level for CVD According to Amount of Alcohol Consumption Among Patients With Available Data (n=2551), 2002–2012
Figure S1. Risk of CVD and its subtypes according to serum LBP levels (n=2568), 2002–2012.
Acknowledgments
The authors thank the residents of the town of Hisayama for their participation in the survey and the staff of the Division of Health and Welfare of Hisayama for their cooperation with this study. Professor Yoshinao Oda, Professor Toru Iwaki, and their colleagues in the Department of Anatomic Pathology and Department of Neuropathology, Graduate School of Medical Sciences, Kyushu University greatly assisted our research by providing insight and expertise on the autopsy findings; we are grateful for their help. Statistical analyses were performed using the computer resources offered under the category of General Projects by the Research Institute for Information Technology, Kyushu University.
(J Am Heart Assoc. 2019;8:e013628 DOI: 10.1161/JAHA.119.013628.)
References
- 1. World Health Organization . Cardiovascular disease. World Heart Day. Available at: https://www.who.int/cardiovascular_diseases/world-heart-day/en/. Accessed June 10, 2019.
- 2. Lloyd‐Jones DM. Cardiovascular risk prediction: basic concepts, current status, and future directions. Circulation. 2010;121:1768–1777. [DOI] [PubMed] [Google Scholar]
- 3. Dahlöf B. Cardiovascular disease risk factors: epidemiology and risk assessment. Am J Cardiol. 2010;105:3A–9A. [DOI] [PubMed] [Google Scholar]
- 4. Jain S, Khera R, Corrales‐Medina VF, Townsend RR, Chirinos JA. Inflammation and arterial stiffness in humans. Atherosclerosis. 2014;237:381–390. [DOI] [PubMed] [Google Scholar]
- 5. Stoll LL, Denning GM, Weintraub NL. Potential role of endotoxin as a proinflammatory mediator of atherosclerosis. Arterioscler Thromb Vasc Biol. 2004;24:2227–2236. [DOI] [PubMed] [Google Scholar]
- 6. Boutagy NE, McMillan RP, Frisard MI, Hulver MW. Metabolic endotoxemia with obesity: is it real and is it relevant? Biochimie. 2016;124:11–20. [DOI] [PMC free article] [PubMed] [Google Scholar]
- 7. Cani PD, Amar J, Iglesias MA, Poggi M, Knauf C, Bastelica D, Neyrinck AM, Fava F, Tuohy KM, Chabo C, Waget A, Delmée E, Cousin B, Sulpice T, Chamontin B, Ferrières J, Tanti JF, Gibson GR, Casteilla L, Delzenne NM, Alessi MC, Burcelin R. Metabolic endotoxemia initiates obesity and insulin resistance. Diabetes. 2007;56:1761–1772. [DOI] [PubMed] [Google Scholar]
- 8. Cani PD, Bibiloni R, Knauf C, Waget A, Neyrinck AM, Delzenne NM, Burcelin R. Changes in gut microbiota control metabolic diet–induced obesity and diabetes in mice. Diabetes. 2008;57:1470–1481. [DOI] [PubMed] [Google Scholar]
- 9. Fei N, Zhao L. An opportunistic pathogen isolated from the gut of an obese human causes obesity in germfree mice. ISME J. 2013;7:880–884. [DOI] [PMC free article] [PubMed] [Google Scholar]
- 10. Gavaldà‐Navarro A, Moreno‐Navarrete JM, Quesada‐López T, Cairó M, Giralt M, Fernández‐Real JM, Villarroya F. Lipopolysaccharide‐binding protein is a negative regulator of adipose tissue browning in mice and humans. Diabetologia. 2016;59:2208–2218. [DOI] [PubMed] [Google Scholar]
- 11. Gonzalez‐Quintela A, Alonso M, Campos J, Vizcaino L, Loidi L, Gude F. Determinants of serum concentrations of lipopolysaccharide‐binding protein (LBP) in the adult population: the role of obesity. PLoS One. 2013;8:e54600. [DOI] [PMC free article] [PubMed] [Google Scholar]
- 12. Gomes JMG, Costa JA, Alfenas RCG. Metabolic endotoxemia and diabetes mellitus: a systematic review. Metabolism. 2016;68:133–144. [DOI] [PubMed] [Google Scholar]
- 13. Liu X, Lu L, Yao P, Ma Y, Wang F, Jin Q, Ye X, Li H, Hu FB, Sun L, Lin X. Lipopolysaccharide binding protein, obesity status and incidence of metabolic syndrome: a prospective study among middle‐aged and older Chinese. Diabetologia. 2014;57:1834–1841. [DOI] [PubMed] [Google Scholar]
- 14. Awoyemi A, Trøseid M, Arnesen H, Solheim S, Seljeflot I. Markers of metabolic endotoxemia as related to metabolic syndrome in an elderly male population at high cardiovascular risk: a cross‐sectional study. Diabetol Metab Syndr. 2018;10:59. [DOI] [PMC free article] [PubMed] [Google Scholar]
- 15. Schumann RR. Old and new findings on lipopolysaccharide‐binding protein: a soluble pattern‐recognition molecule. Biochem Soc Trans. 2011;39:989–993. [DOI] [PubMed] [Google Scholar]
- 16. Vaure C, Liu Y. A comparative review of toll‐like receptor 4 expression and functionality in different animal species. Front Immunol. 2014;5:316. [DOI] [PMC free article] [PubMed] [Google Scholar]
- 17. Grube BJ, Cochane CG, Ye RD, Green CE, McPhail ME, Ulevitch RJ, Tobias PS. Lipopolysaccharide binding protein expression in primary human hepatocytes and HepG2 hepatoma cells. J Biol Chem. 1994;269:8477–8482. [PubMed] [Google Scholar]
- 18. Ruiz AG, Casafont F, Crespo J, Cayón A, Mayorga M, Estebanez A, Fernadez‐Escalante JC, Pons‐Romero F. Lipopolysaccharide‐binding protein plasma levels and liver TNF‐alpha gene expression in obese patients: evidence for the potential role of endotoxin in the pathogenesis of non‐alcoholic steatohepatitis. Obes Surg. 2007;17:1374–1380. [DOI] [PubMed] [Google Scholar]
- 19. Hudgins LC, Parker TS, Levine DM, Gordon BR, Saal SD, Jiang XC, Seidman CE, Tremaroli JD, Lai J, Rubin AL. A single intravenous dose of endotoxin rapidly alters serum lipoproteins and lipid transfer proteins in normal volunteers. J Lipid Res. 2003;44:1489–1498. [DOI] [PubMed] [Google Scholar]
- 20. Novitsky TJ. Limitations of the Limulus amebocyte lysate test in demonstrating circulating lipopolysaccharides. Ann N Y Acad Sci. 1998;30:416–421. [DOI] [PubMed] [Google Scholar]
- 21. Citronberg JS, Wilkens LR, Lim U, Hullar MA, White E, Newcomb PA, Le Marchand L, Lampe JW. Reliability of plasma lipopolysaccharide‐binding protein (LBP) from repeated measures in healthy adults. Cancer Causes Control. 2016;27:1163–1166. [DOI] [PMC free article] [PubMed] [Google Scholar]
- 22. Serrano M, Moreno‐Navarrete JM, Puig J, Moreno M, Guerra E, Ortega F, Xifra G, Ricart W, Fernández‐Real JM. Serum lipopolysaccharide‐binding protein as a marker of atherosclerosis. Atherosclerosis. 2013;230:223–227. [DOI] [PubMed] [Google Scholar]
- 23. Sakura T, Morioka T, Shioi A, Kakutani Y, Miki Y, Yamazaki Y, Motoyama K, Mori K, Fukumoto S, Shoji T, Emoto M, Inaba M. Lipopolysaccharide‐binding protein is associated with arterial stiffness in patients with type 2 diabetes: a cross‐sectional study. Cardiovasc Diabetol. 2017;16:62. [DOI] [PMC free article] [PubMed] [Google Scholar]
- 24. Lepper PM, Schumann C, Triantafilou K, Rasche FM, Schuster T, Frank H, Schneider EM, Triantafilou M, von Eynatten M. Association of lipopolysaccharide‐binding protein and coronary artery disease in men. J Am Coll Cardiol. 2007;50:25–31. [DOI] [PubMed] [Google Scholar]
- 25. Lepper PM, Kleber ME, Grammer TB, Hoffmann K, Dietz S, Winkelmann BR, Boehm BO, März W. Lipopolysaccharide‐binding protein (LBP) is associated with total and cardiovascular mortality in individuals with or without stable coronary artery disease: results from the Ludwigshafen Risk and Cardiovascular Health Study (LURIC). Atherosclerosis. 2011;219:291–297. [DOI] [PubMed] [Google Scholar]
- 26. Hata J, Ninomiya T, Hirakawa Y, Nagata M, Mukai N, Gotoh S, Fukuhara M, Ikeda F, Shikata K, Yoshida D, Yonemoto K, Kamouchi M, Kitazono T, Kiyohara Y. Secular trends in cardiovascular disease and its risk factors in Japanese: half‐century data from the Hisayama Study (1961–2009). Circulation. 2013;128:1198–1205. [DOI] [PubMed] [Google Scholar]
- 27. Ninomiya T. Japanese legacy cohort studies: the Hisayama Study. J Epidemiol. 2018;28:444–451. [DOI] [PMC free article] [PubMed] [Google Scholar]
- 28. Matthews DR, Hosker JP, Rudenski AS, Naylor BA, Treacher DF, Turner RC. Homeostasis model assessment: insulin resistance and β‐cell function from fasting plasma glucose and insulin concentrations in man. Diabetologia. 1985;28:412–419. [DOI] [PubMed] [Google Scholar]
- 29. Horio M, Imai E, Yasuda Y, Watanabe T, Matsuo S. Modification of the CKD epidemiology collaboration (CKD‐EPI) equation for Japanese: accuracy and use for population estimates. Am J Kidney Dis. 2010;56:32–38. [DOI] [PubMed] [Google Scholar]
- 30. SAS/STAT® 14.3 User's Guide CTPP. SAS Institute Inc.; 2017:7139–7145. Available at: https://support.sas.com/documentation/onlinedoc/stat/143/phreg.pdf. Accessed June 10, 2019. [Google Scholar]
- 31. Fine JP, Gray RJ. A proportional hazards model for the subdistribution of a competing risk. J Am Stat Assoc. 1999;94:496–509. [Google Scholar]
- 32. Mehta NN, McGillicuddy FC, Anderson PD, Hinkle CC, Shah R, Pruscino L, Tabita‐Martinez J, Sellers KF, Rickels MR, Reilly MP. Experimental endotoxemia induces adipose inflammation and insulin resistance in humans. Diabetes. 2010;59:172–181. [DOI] [PMC free article] [PubMed] [Google Scholar]
- 33. Moreno‐Navarrete JM, Escoté X, Ortega F, Serino M, Campbell M, Michalski MC, Laville M, Xifra G, Luche E, Domingo P, Sabater M, Pardo G, Waget A, Salvador J, Giralt M, Rodriquez‐Hermosa JI, Camps M, Kolditz CI, Viguerie N, Galitzky J, Decaunes P, Ricart W, Frühbeck G, Villarroya F, Minqrone G, Langin D, Zorzano A, Vidal H, Vendrell J, Burcelin R, Vidal‐Puig A, Fernández‐Real JM. A role for adipocyte‐derived lipopolysaccharide‐binding protein in inflammation‐ and obesity‐associated adipose tissue association. Diabetologia. 2013;56:2524–2537. [DOI] [PubMed] [Google Scholar]
- 34. Moreno‐Navarrete JM, Escoté X, Ortega F, Camps M, Ricart W, Zorzano A, Vendrell J, Vidal‐Puig A, Fernández‐Real JM. Lipopolysaccharide‐binding protein is an adipokine involved in the resilience of the mouse adipocyte to inflammation. Diabetologia. 2015;58:2424–2434. [DOI] [PubMed] [Google Scholar]
- 35. Moreno‐Navarrete JM, Ortega F, Serino M, Luche E, Waget A, Pardo G, Salvador J, Ricart W, Frühbeck G, Burcelin G, Fernández‐Real JM. Circulating lipopolysaccharide‐binding protein (LBP) as a marker of obesity‐related insulin resistance. Int J Obes. 2012;36:1442–1449. [DOI] [PubMed] [Google Scholar]
- 36. Sun L, Yu Z, Ye X, Zou S, Li H, Yu D, Wu H, Chen Y, Dore J, Clément K, Hu FB, Lin X. A marker of endotoxemia is associated with obesity and related metabolic disorders in apparently healthy Chinese. Diabetes Care. 2010;33:1925–1932. [DOI] [PMC free article] [PubMed] [Google Scholar]
- 37. Tilves CM, Zmuda JM, Kuipers AL, Nestlerode CS, Evans RW, Bunker CH, Patrick AL, Miljkovic I. Association of lipopolysaccharide‐binding protein with aging‐related adiposity change and prediabetes among African ancestry men. Diabetes Care. 2016;39:385–391. [DOI] [PMC free article] [PubMed] [Google Scholar]
- 38. Gotoh S, Doi Y, Hata J, Ninomiya T, Mukai N, Fukuhara M, Kamouchi M, Kitazono T, Kiyohara Y. Insulin resistance and the development of cardiovascular disease in a Japanese community: the Hisayama study. J Atheroscler Thromb. 2012;19:977–985. [DOI] [PubMed] [Google Scholar]
- 39. Curtiss LK, Tobias PS. Emerging role of Toll‐like receptors in atherosclerosis. J Lipid Res. 2009;50:S340–S345. [DOI] [PMC free article] [PubMed] [Google Scholar]
- 40. Michelsen KS, Wong MH, Shah PK, Zhang W, Yano J, Doherty TM, Akira S, Rajavashisth TB, Arditi M. Lack of Toll‐like receptor 4 or myeloid differentiation factor 88 reduces atherosclerosis and alters plaque phenotype in mice deficient in apolipoprotein E. Proc Natl Acad Sci USA. 2004;101:10679–10684. [DOI] [PMC free article] [PubMed] [Google Scholar]
- 41. Edfeldt K, Swedenborg J, Hansson GK, Yan ZQ. Expression of Toll‐like receptors in human atherosclerotic lesions: a possible pathway for plaque activation. Circulation. 2002;105:1158–1161. [PubMed] [Google Scholar]
- 42. Laugerette F, Furet JP, Debard C, Daira P, Loizon E, Géloën A, Soulage CO, Simonet C, Lefils‐Lacourtablaise J, Bernoud‐Hubac N, Bodennec J, Peretti N, Vidal H, Michalski MC. Oil composition of high‐fat diet affects metabolic inflammation differently in connection with endotoxin receptors in mice. Am J Physiol Endocrinol Metab. 2012;302:E374–E386. [DOI] [PubMed] [Google Scholar]
- 43. Kong Y, Li Z, Tang T, Wu H, Liu J, Gu L, Zhao T, Huang Q. The level of lipopolysaccharide‐binding protein is elevated in adult patients with obstructive sleep apnea. BMC Pulm Med. 2018;18:90. [DOI] [PMC free article] [PubMed] [Google Scholar]
- 44. Saha B, Tornai D, Kodys K, Adejumo A, Lowe P, McClain C, Mitchell M, McCullough A, Dasarathy S, Kroll‐Desrosiers A, Barton B, Radaeva S, Szabo G. Biomarkers of macrophage activation and immune danger signals predict clinical outcomes in alcoholic hepatitis. Hepatology. 2019;70:1134–1149. [DOI] [PMC free article] [PubMed] [Google Scholar]
- 45. Ronksley PE, Brien SE, Turner BJ, Mukamal KJ, Ghali WA. Association of alcohol consumption with selected cardiovascular disease outcomes: a systematic review and meta‐analysis. BMJ. 2011;342:d671. [DOI] [PMC free article] [PubMed] [Google Scholar]
Associated Data
This section collects any data citations, data availability statements, or supplementary materials included in this article.
Supplementary Materials
Table S1. Correlations Between Serum LBP Levels and Other Variables (n=2568), 2002
Table S2. Association Between Serum LBP Levels and the Development of CVD and its Subtypes After Excluding Patients With White Blood Cell Count ≥8600/μL (n=2432), 2002–2012
Table S3. Association Between Serum LBP Levels and the Development of CVD and its Subtypes After Excluding Patients Who Died of Fatal Infection During Follow‐Up (n=2522), 2002–2012
Table S4. Risk of CVD and its Subtypes According to Serum LBP Levels Using the Method Proposed by Fine and Gray (n=2568), 2002–2012
Table S5. Multivariable‐Adjusted HRs Per 1‐SD Increment in Serum LBP Level for CVD According to Amount of Alcohol Consumption Among Patients With Available Data (n=2551), 2002–2012
Figure S1. Risk of CVD and its subtypes according to serum LBP levels (n=2568), 2002–2012.