

Abstract
Background
Whether physical activity is a determinant of peripheral artery disease (PAD) remains unclear. We therefore assessed the association of physical activity (amount and intensity) with subsequent risk of hospitalization with PAD and its severe form, critical limb ischemia, in the ARIC (Atherosclerosis Risk in Communities) study.
Methods and Results
We included 12 513 participants free of cardiovascular disease at baseline (1987–1989), with a mean age of 53.9 years, 55.3% women, and 25.0% black. Physical activity was assessed using a modified Baecke questionnaire and categorized into poor (no moderate [3 to <6 metabolic equivalents] or vigorous [≥6 metabolic equivalents] exercise), intermediate (1–74 min/wk vigorous or 1–149 min/wk moderate plus vigorous exercise), and recommended (≥75 min/wk vigorous or ≥150 min/wk moderate plus vigorous exercise). We also modeled moderate and vigorous exercise individually. All analyses applied Cox regression models. Intermediate and recommended exercise were seen in 24.7% and 38.1%, respectively. During a median follow‐up of 25.4 years, 434 incident hospitalizations with PAD (166 critical limb ischemia) were documented. Recommended versus poor activity was associated with a lower demographically adjusted PAD risk (hazard ratio, 0.68; 95% CI, 0.54–0.85) but attenuated after accounting for lifestyle factors (hazard ratio, 0.84; 95% CI, 0.66–1.05). When analyzing moderate and vigorous exercise separately, vigorous exercise was robustly related to lower risk of hospitalization with PAD, and critical limb ischemia in particular (hazard ratio, 0.72; 95% CI, 0.54–0.97 per 200 metabolic equivalents*min/wk increment in the most extended model).
Conclusions
Higher amount and intensity of physical activity were related to lower risks of hospitalization with PAD and critical limb ischemia, further highlighting the importance of engaging in physical activity for vascular health.
Keywords: critical limb ischemia, peripheral artery disease, physical activity
Subject Categories: Cardiovascular Disease, Epidemiology, Exercise, Lifestyle
Clinical Perspective
What Is New?
Recommended physical activity was associated with lower risk of peripheral artery disease and critical limb ischemia compared with those with poor levels in unadjusted and demographically adjusted models.
Although this association was attenuated once other potential confounders such as smoking status were taken into account, vigorous exercise was robustly associated with lower risk of peripheral artery disease, especially critical limb ischemia.
What Are the Clinical Implications?
Our findings provide additional evidence about the importance of physical activity for vascular health.
For a given amount of physical activity, whenever capable, engaging in vigorous physical activity for a shorter time (rather than moderate exercise for a longer time) may result in better leg vascular health.
Lower extremity peripheral artery disease (PAD) is characterized by compromised blood flow to the lower extremities caused by atherosclerosis.1 PAD affects ≈200 million adults worldwide, and its prevalence increased by 24% globally between 2000 and 2010.2 In the United States, it is estimated that ≈8.5 million (7.2%) adults have PAD.3 The presence of PAD confers a 2‐ to 5‐fold increased risk of mortality.1 In addition, PAD causes intermittent claudication and functional impairment and may progress to critical limb ischemia (CLI), sometimes resulting in leg amputation.1 Therefore, efforts at preventing and treating PAD are important.
Maintaining adequate levels of physical activity is a central approach to improve the atherosclerotic risk factor profile (eg, by means of reducing body weight or lowering blood pressure)4 and to reduce the risk of cardiovascular events. Physical activity has been found to be prospectively associated with a lower risk of some cardiovascular diseases, including coronary heart disease, heart failure, and stroke.5, 6, 7, 8, 9 However, whether and how physical activity is prospectively related to incident PAD hospitalization remains unclear. Although there are numerous cross‐sectional studies reporting the relationship between physical activity and PAD,10, 11, 12, 13, 14, 15, 16, 17, 18, 19, 20 this design is not optimal because temporality is not clear and those studies may merely reflect the effect of PAD on physical activity.21 To our knowledge, there have been only a few prospective studies exploring this study question,20, 22, 23, 24 which investigated only selected populations (only men20 or people with borderline ankle‐brachial index [ABI] 0.90–1.0024), were small (sample sizes <500),20, 22, 24 or had a follow‐up of <5 years.20, 22, 23 Also, none of these studies explored CLI. In addition, although the guideline recommends moderate and vigorous activities,25 it is not clear whether intensity of physical activity is associated with leg vascular health.
Using data from the ARIC (Atherosclerosis Risk in Communities) study, we explored the prospective association of physical activity (amount and intensity) with subsequent risk of hospitalization with PAD over 25 years. A large sample size and long follow‐up allowed us to uniquely analyze the most severe form of PAD, CLI, as well.
Methods
The study data and materials will be made available to other researchers upon request in accordance with ARIC policy.26
Study Design and Population
The ARIC study is a community‐based cohort that enrolled 15 792 participants aged 45 to 64 years during 1987 to 1989 (baseline visit) from 4 communities in the United States: Forsyth County, North Carolina; Jackson, Mississippi; suburban Minneapolis, Minnesota; and Washington County, Maryland.27 Of 15 792 participants, we excluded those who had prevalent PAD (n=746), defined as ABI <0.9, self‐reported peripheral revascularization, and intermittent claudication on the basis of the Rose questionnaire describing as a self‐reported history of calf pain occurring only on exertion but not at rest.28 We additionally excluded people who identified themselves as nonwhite/nonblack (n=48), and those who reported prevalent clinical cardiovascular disease (defined as coronary heart disease, stroke, and heart failure) at baseline (n=1443) as well as those with missing data on physical activity (n=24) or other variables of interest (detailed below in the Covariates section) (n=1018). The final analytic sample consisted of 12 513 participants. The present study followed up for incident hospitalization with PAD and CLI from baseline to December 31, 2014. The study protocol was approved by the institutional review boards of all ARIC study sites, and all participants provided written informed consent.
Physical Activity Measures
Physical activity in ARIC was assessed using a modified Baecke physical activity questionnaire, described in detail elsewhere.29 Briefly, up to 4 types of exercises or sports in the previous year were specified in the questionnaire for intensity, frequency, and duration and assigned metabolic equivalent (MET) values according to the Compendium of Physical Activities.7, 8, 9, 29, 30 Then, minutes per week of moderate (3 to <6 METs) or vigorous (≥6 METs) physical activity were estimated for each participant. We modeled physical activity as either a categorical or a continuous variable. The categorization was based on the American Heart Association guidelines4: poor, 0 min/wk of moderate or vigorous exercise; intermediate, 1 to 74 min/wk of vigorous exercise or 1 to 149 min/wk of moderate plus vigorous exercise; and recommended, ≥75 min/wk of vigorous exercise or ≥150 min/wk of moderate plus vigorous exercise. As a continuous variable, physical activity was modeled as METs score being the product of intensity and duration (METs×min/wk) for each of moderate or vigorous exercise and the total of both.
To account for confounding by physical activity from other sources, we also calculated a score ranging from 1 (low) to 5 (high) for work and leisure time physical activity based on the remaining parts of the Baecke questionnaire.7, 29 Work score was summarized from 8 work‐related questions asking about the participants’ main occupation; self‐rating of the work's vigor; frequencies of sitting, standing, walking, lifting, and sweating at work; and fatigue after work. The lowest work score was assigned to nonworking respondents. Leisure score was based on 4 questions about the frequency of watching television, walking, bicycling, and walking/biking to work or shopping.
Covariates
Information on age, sex, race, educational level, smoking and drinking status, and health insurance status were self‐reported. Educational level was classified as less than high school (<12 years), complete high school or vocational school (12 years), and more than high school (any college or graduate or professional school >12 years). Smoking and drinking status were examined as current, former, or never. Body mass index was calculated as weight (in kilograms) divided by the square of height (in meters). Systolic blood pressure and diastolic blood pressure were measured 3 times, after 5 minutes of quiet rest, with a Hawksley random‐zero sphygmomanometer (model 7076, Hawksley and Sons Limited, Sussex, England).31 The average of the second and third readings was used for the analysis. Medication use for hypertension, dyslipidemia, and diabetes mellitus within the past 2 weeks was recorded. Total cholesterol was measured using enzymatic methods.32 High‐density lipoprotein cholesterol was measured after dextran‐magnesium precipitation of non–high‐density lipoproteins.33 White blood cell count was determined from whole anticoagulated blood by automated particle Coulter counters within 24 hours after venipuncture in hematology laboratories.34 The intraclass correlations obtained by repeated testing were >0.85 for total cholesterol and high‐density lipoprotein cholesterol35 and >0.96 for white blood cell count.36 Diabetes mellitus was defined as a fasting glucose ≥126 mg/dL, nonfasting glucose ≥200 mg/dL, self‐reported physician diagnosis of diabetes mellitus, or use of glucose‐lowering medication(s). Estimated glomerular filtration rate was calculated using the Chronic Kidney Disease Epidemiology Collaboration creatinine equation.37
Outcomes
The main outcome was first hospital admission with a PAD diagnosis or leg revascularization according to the following International Classification of Diseases, Ninth Revision ICD‐9 codes based on previous literature38, 39, 40: atherosclerosis of native arteries of the extremities, unspecified (440.20); atherosclerosis of native arteries of the extremities with intermittent claudication (440.21); atherosclerosis of native arteries of the extremities with rest pain (440.22); atherosclerosis of native arteries of the extremities with ulceration (440.23); atherosclerosis of native arteries of the extremities with gangrene (440.24); other atherosclerosis of native arteries of the extremities (440.29); atherosclerosis of bypass graft of the extremities (440.3); atherosclerosis of other specified arteries (440.8); leg artery revascularization (38.18, 39.25, 39.29, 39.50). Of PAD cases, those with 440.22, 440.23, and 440.24 as well as any cases with the coexisting code of leg amputation (84.1x), lower extremity ulcer (707.1x), and gangrene (785.4) were considered as CLI. Each participant was followed from baseline to the date of incident PAD, death, loss to follow‐up, or administrative censoring at December 31, 2014, whichever came first.
Statistical Analysis
Baseline characteristics of the study population were compared across 3 different physical activity categories: poor, intermediate, and recommended.
A Poisson regression model was used to assess incidence rates of PAD over the spectrum of physical activity level. We modeled continuous total METs score as linear splines with knots at 500, 1000, and 1500 METs×min/wk, adjusting for age, sex, and race. METS scores of 500 (≈3 METs×150 minutes or ≈6 METs×75 minutes) and 1000 (≈3 METs×300 minutes or ≈6 METs×150 minutes) were selected roughly in accordance with recommended thresholds for the physical activity categories; and 1500 was set for the same exercise volume increment of 500 from 1000.
We used Cox proportional hazards models to quantify the association of the physical activity categories or continuous total METs score with incident PAD while adjusting for potential confounders. Total METs score was scaled in 200 METs×min/wk, roughly corresponding to moderate activity of 60 minutes (3 METs×60 minutes) or vigorous activity of 30 minutes (6 METs×30 minutes). In order to see whether moderate and vigorous exercise could influence the leg vascular health to the same magnitude, we further modeled moderate METs score and vigorous METs score individually in the same model. Again, we scaled each METs score in 200 units. To evaluate whether our findings were consistent across subgroups, we explored several subgroups by age (<55 versus ≥55), sex, race, smoking status, and the presence/absence of diabetes mellitus and hypertension (defined as systolic blood pressure ≥140 mm Hg, diastolic blood pressure ≥90 mm Hg, or taking any antihypertensive medication). We statistically estimated the joint effects on the multiplicative and additive scales (relative excess risks attributable to interaction).41
We used several adjusted models to account for the influence of potential confounders. In addition to the unadjusted Model 1, we adjusted for demographic variables (age, sex, and race) in Model 2 and additionally adjusted for social and lifestyle factors (educational level, health insurance status, smoking and drinking status) in Model 3. To account for physical activity from other sources, we further adjusted for work and leisure score in Model 4. In Model 5, we included clinical variables (body mass index, systolic blood pressure, total and high‐density lipoprotein cholesterol, creatinine‐derived estimated glomerular filtration rate, white blood cell count, diabetes mellitus, antihypertensive medication, cholesterol‐lowering medication, and aspirin). These clinical factors can be etiological mediators between physical activity and PAD; however, because they can be confounders as well (eg, individuals with clinical conditions may not be able to be physically active), we ran Model 5 using clinical variables measured at baseline.
We also conducted sensitivity analyses as follows: (1) additional adjustment for baseline ABI category (borderline ABI, 0.9 to <1.0; normal ABI, 1.0 to <1.3; and high ABI, ≥1.3) to make sure the association of physical activity with subsequent risk of PAD is not merely derived by participants with lower ABI (to address a concern of reverse causation); (2) censoring other incident cardiovascular diseases (defined as coronary heart disease, stroke, and heart failure) during follow‐up to minimize possibility of surveillance bias; (3) censoring PAD hospitalizations in the first 1 to 5 years of follow‐up to minimize the possibility of reverse causation; (4) assessment of 5 physical activity groups using total minutes of moderate and vigorous exercise per week (0, 1–74, 75–149, 150–299, and ≥300 min/wk) to confirm a dose‐response association for total amount of physical activity. All analyses were performed with Stata version 14.0 (StataCorp LLC, College Station, TX), and a P<0.05 was considered statistically significant.
Results
The mean age of the 12 513 participants at baseline was 53.9 (SD, 5.7) years, of whom 55.3% were women and 25.0% were black. American Heart Association–defined intermediate or recommended levels of physical activity were seen in 24.7% and 38.1%, respectively. Participants with intermediate and recommended levels of exercise were more likely to be white, have health insurance, be well educated, and have lower body mass index than those who were in the poor activity category (Table 1); in addition, they had lower proportions of current smoking, never drinking, hypertension, and diabetes mellitus.
Table 1.
Baseline Characteristics According to AHA‐Defined Categories of Physical Activity
| Characteristics | Overall | AHA Physical Activity Categorya | ||
|---|---|---|---|---|
| Poor | Intermediate | Recommended | ||
| N | 12 513 | 4656 | 3096 | 4761 |
| METs×min/wk, median (IQI) | 378.2 (0.0–1013.5) | 0.0 (0.0–0.0) | 356.2 (208.0–492.7) | 1191.7 (884.9–1703.5) |
| Age, y, mean (SD) | 53.9 (5.7) | 53.8 (5.7) | 53.8 (5.7) | 54.1 (5.8) |
| Women, N (%) | 6922 (55.3) | 2750 (59.1) | 1879 (60.7) | 2293 (48.2) |
| White race, N (%) | 9385 (75.0) | 2891 (62.1) | 2462 (79.5) | 4032 (84.7) |
| Health insurance, N (%) | 11 391 (91.0) | 4026 (86.5) | 2866 (92.6) | 4499 (94.5) |
| Education, N (%) | ||||
| <High school | 2685 (21.5) | 1464 (31.4) | 576 (18.6) | 645 (13.5) |
| High school or vocational school | 5187 (41.5) | 1954 (42.0) | 1331 (43.0) | 1902 (39.9) |
| College, graduate, or professional school | 4641 (37.1) | 1238 (26.6) | 1189 (38.4) | 2214 (46.5) |
| Smoking status, N (%) | ||||
| Current | 3110 (24.9) | 1430 (30.7) | 712 (23.0) | 968 (20.3) |
| Former | 3995 (31.9) | 1278 (27.4) | 951 (30.7) | 1766 (37.1) |
| Never | 5408 (43.2) | 1948 (41.8) | 1433 (46.3) | 2027 (42.6) |
| Drinking status | ||||
| Current | 7216 (57.7) | 2243 (48.2) | 1831 (59.1) | 3142 (66.0) |
| Former | 2205 (17.6) | 942 (20.2) | 538 (17.4) | 725 (15.2) |
| Never | 3092 (24.7) | 1471 (31.6) | 727 (23.5) | 894 (18.8) |
| BMI, kg/m2, mean (SD) | 27.5 (5.2) | 28.4 (5.7) | 27.1 (5.1) | 26.7 (4.4) |
| SBP, mm Hg, mean (SD) | 120.5 (18.2) | 122.7 (19.2) | 119.3 (17.7) | 119.1 (17.2) |
| DBP, mm Hg, mean (SD) | 73.5 (11.0) | 74.9 (11.8) | 72.7 (10.6) | 72.7 (10.4) |
| Hypertension, N (%) | 3823 (30.6) | 1696 (36.5) | 882 (28.5) | 1245 (26.2) |
| Antihypertensive medication, N (%) | 3100 (24.8) | 1346 (28.9) | 740 (23.9) | 1014 (21.3) |
| Total cholesterol, mg/dL, mean (SD) | 213.9 (41.2) | 214.4 (42.2) | 214.5 (42.3) | 213.2 (39.6) |
| HDL, mg/dL, mean (SD) | 52.3 (17.2) | 51.8 (17.3) | 52.5 (16.6) | 52.5 (17.4) |
| Cholesterol‐lowering medication, N (%) | 302 (2.4) | 87 (1.9) | 89 (2.9) | 126 (2.6) |
| eGFR, N (%) | ||||
| <60 | 120 (1.0) | 46 (1.0) | 33 (1.1) | 41 (0.9) |
| 60–89 | 1780 (14.2) | 580 (12.5) | 435 (14.1) | 765 (16.1) |
| ≥90 | 10 613 (84.8) | 4030 (86.6) | 2628 (84.9) | 3955 (83.1) |
| WBC count, mean (SD) | 6.0 (1.9) | 6.2 (2.0) | 6.0 (1.9) | 5.9 (1.8) |
| Aspirin medication, N (%) | 5655 (45.2) | 1929 (41.4) | 1509 (48.7) | 2217 (46.6) |
| Diabetes mellitus, N (%) | 1263 (10.1) | 580 (12.5) | 292 (9.4) | 391 (8.2) |
| Work index, mean (SD) | 2.2 (0.9) | 2.4 (0.9) | 2.2 (0.9) | 2.1 (0.9) |
| Sport index, mean (SD) | 2.5 (0.8) | 1.8 (0.4) | 2.5 (0.5) | 3.1 (0.7) |
| Leisure index, mean (SD) | 2.4 (0.6) | 2.1 (0.5) | 2.4 (0.5) | 2.6 (0.6) |
AHA indicates American Heart Association; BMI, body mass index; DBP, diastolic blood pressure; eGFR, estimated glomerular filtration rate; HDL, high‐density lipoprotein; METs, metabolic equivalents; SBP, systolic blood pressure; IQI, interquartile interval; WBC, white blood cell.
Poor: 0 min/wk of moderate or vigorous exercise; intermediate: 1–74 min/wk of vigorous exercise or 1–149 min/wk of moderate plus vigorous exercise; recommended: ≥75 min/wk of vigorous exercise or ≥150 min/wk of moderate plus vigorous exercise.
During a median follow‐up of 25.4 years (maximum of 28.1 years) from the ARIC baseline visit, 434 incident hospitalizations with PAD, including 166 patients with CLI, were documented (crude incident rates per 10 000 person‐years: 15.6 for total PAD and 5.9 for CLI). The incidence rate for hospitalization with PAD was highest in the poor activity category (19.3/10 000 person‐years) and approximately doubled for hospitalization with CLI when comparing the poor with the recommended category (8.7 versus 4.3/10 000 person‐years). Generally, the age‐, sex‐, and race‐adjusted incident rate of hospitalization with PAD slightly decreased along with exercise volume (Figure—Panel A). A similar pattern was seen for CLI but at a lower rate (Figure—Panel B).
Figure 1.
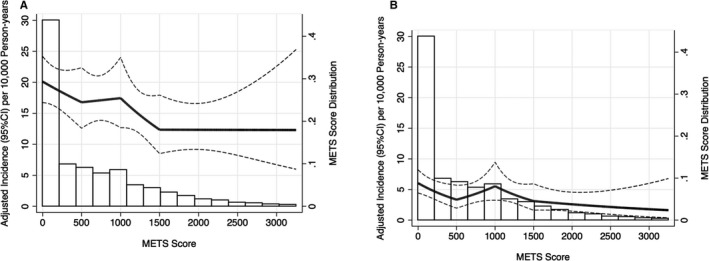
Age‐, sex‐, and race‐adjusted incident rate (95% CI) of hospitalization with PAD (A) and CLI (B) according to total METs score (METs×min/wk) at visit 1. METs score was truncated at 99th percentile and modeled as linear spline with knots at 500, 1000, and 1500 METs×min/wk. CLI indicates critical limb ischemia; METs, metabolic equivalents; PAD, peripheral artery disease.
In crude analysis, engaging in intermediate and recommended levels of physical activity was associated with 26% and 34% lower risks of incident hospitalization with PAD compared with poor levels, respectively (Model 1 in Table 2). Adjusting for demographics did not materially alter the results (Model 2 in Table 2), but after further adjustment for social and lifestyle factors (Model 3 in Table 2), these associations were no longer significant. Nonetheless, a graded (“dose‐response”) pattern was observed in Models 4 and 5 as well. We observed similar patterns for hospitalization with CLI (Table 2), with slightly more prominent hazard ratios than those seen for hospitalization with PAD in general.
Table 2.
Incidence Rates and Hazard Ratios (95% CIs) for the Associations of AHA‐Defined Physical Activity Levels With Incident Hospitalization With PAD and CLI
| Number of Participants | Number of Events | Incidence Ratea | Model 1b | Model 2c | Model 3d | Model 4e | Model 5f | |
|---|---|---|---|---|---|---|---|---|
| PAD | ||||||||
| Total METs score (per 200 METs×min/wk) | 12 513 | 434 | 15.6 (14.2–17.2) | 0.95 (0.93–0.98)g | 0.96 (0.93–0.98)g | 0.98 (0.95–1.01) | 0.98 (0.95–1.01) | 0.98 (0.96–1.01) |
| AHA physical activity categoryh | ||||||||
| Poor | 4656 | 193 | 19.3 (16.7–22.1) | 1 (ref.) | 1 (ref.) | 1 (ref.) | 1 (ref.) | 1 (ref.) |
| Intermediate | 3096 | 101 | 14.4 (11.9–17.5) | 0.74 (0.58–0.94)g | 0.80 (0.63–1.03) | 0.93 (0.72–1.19) | 0.91 (0.71–1.17) | 0.95 (0.74–1.22) |
| Recommended | 4761 | 140 | 13.0 (11.0–15.4) | 0.66 (0.53–0.83)g | 0.68 (0.54–0.85)g | 0.84 (0.66–1.05) | 0.81 (0.64–1.04) | 0.84 (0.66–1.07) |
| P value for trend | <0.001 | <0.001 | 0.126 | 0.098 | 0.155 | |||
| CLI | ||||||||
| Total METs score (per 200 METs×min/wk) | 12 513 | 166 | 5.9 (5.1–6.9) | 0.90 (0.85–0.95)g | 0.92 (0.87–0.97)g | 0.95 (0.90–1.00) | 0.95 (0.90–1.01) | 0.96 (0.91–1.02) |
| AHA physical activity categoryh | ||||||||
| Poor | 4656 | 88 | 8.7 (7.1–10.8) | 1 (ref.) | 1 (ref.) | 1 (ref.) | 1 (ref.) | 1 (ref.) |
| Intermediate | 3096 | 32 | 4.5 (3.2–6.4) | 0.51 (0.34–0.76)g | 0.64 (0.43–0.97)g | 0.76 (0.50–1.15) | 0.77 (0.51–1.17) | 0.83 (0.54–1.27) |
| Recommended | 4761 | 46 | 4.3 (3.2–5.7) | 0.48 (0.33–0.68)g | 0.60 (0.42–0.87)g | 0.76 (0.52–1.11) | 0.78 (0.52–1.16) | 0.80 (0.54–1.20) |
| P value for trend | <0.001 | 0.006 | 0.131 | 0.192 | 0.270 | |||
AHA indicates American Heart Association; CLI, critical limb ischemia; METs, metabolic equivalents; PAD, peripheral artery disease.
Crude incidence rate is per 10 000 person‐years.
Model 1: Crude model.
Model 2: Age, sex and race.
Model 3: +Education, smoking status, drinking status, and health insurance.
Model 4: +Leisure score and work score.
Model 5: +Body mass index, systolic blood pressure, total and high‐density lipoprotein cholesterol, creatinine‐derived estimated glomerular filtration rate, white blood cell count, diabetes mellitus, antihypertensive medication use, cholesterol‐lowering medication use, and aspirin use.
Statistically significant at 5%.
Poor: 0 min/wk of moderate or vigorous exercise; intermediate: 1–74 min/wk of vigorous exercise or 1–149 min/wk of moderate plus vigorous exercise; recommended: ≥75 min/wk of vigorous exercise or ≥150 min/wk of moderate plus vigorous exercise.
When time spent in moderate and vigorous exercises were examined individually in the same models, each 200 higher METs×min/wk in vigorous exercise, but not in moderate exercise, was significantly associated with a lower risk of hospitalization with PAD in Models 1 (hazard ratio 0.89) through 4 (hazard ratio, 0.93) (Table 3). This association became attenuated toward the null after further adjustment for clinical variables in Model 5 (hazard ratio, 0.95). The association of vigorous exercise was more evident for CLI and remained statistically significant even in Model 5 (hazard ratio, 0.72) (Table 3).
Table 3.
Hazard Ratios (95% CIs) of Incident Hospitalization With PAD and CLI per 200 METs×min/wk Increase in Moderate or Vigorous Physical Activity
| Physical Activity Intensity | Model 1a | Model 2b | Model 3c | Model 4d | Model 5e |
|---|---|---|---|---|---|
| PAD | |||||
| Moderate | 0.98 (0.95–1.02) | 0.98 (0.95–1.01) | 1.00 (0.97–1.03) | 0.99 (0.96–1.03) | 1.00 (0.96–1.03) |
| Vigorous | 0.89 (0.83–0.95)f | 0.90 (0.84–0.96)f | 0.93 (0.87–0.99)f | 0.93 (0.87–0.99)f | 0.95 (0.89–1.02) |
| CLI | |||||
| Moderate | 0.95 (0.89–1.01) | 0.97 (0.92–1.03) | 0.99 (0.94–1.05) | 0.99 (0.94–1.06) | 1.00 (0.94–1.06) |
| Vigorous | 0.60 (0.43–0.84)f | 0.65 (0.47–0.88)f | 0.69 (0.51–0.93)f | 0.70 (0.52–0.94)f | 0.72 (0.54–0.97)f |
CLI indicates critical limb ischemia; METs, metabolic equivalents; PAD, peripheral artery disease.
Model 1: Crude model.
Model 2: +Age, sex, race.
Model 3: +Education, smoking status, drinking status, and health insurance.
Model 4: +Leisure score and work score.
Model 5: +Body mass index, systolic blood pressure, total and high‐density lipoprotein cholesterol, creatinine‐derived estimated glomerular filtration rate, white blood cell count, diabetes mellitus, antihypertensive medication use, cholesterol‐lowering medication use, and aspirin use.
Statistically significant at 5%.
In subgroup analyses, we observed stronger associations of recommended activity with both hospitalization with PAD and CLI in women than in men (multiplicative and additive interaction P<0.05) (Table 4). We also saw significant interactions of intermediate activities for age and hypertension status, with stronger associations in younger participants, and participants with hypertension than in their counterparts (multiplicative and additive interaction, P<0.05) (Table S1). Each 200 METs score increment in vigorous exercise was consistently associated with lower PAD hospitalization risk across demographic and clinical subgroups even though the 95% CI slightly overlapped the null (Table S2). Generally similar patterns were observed for CLI, with the exception of a significant interaction for hypertension on the additive scale (P=0.002) (Table S2).
Table 4.
Hazard Ratios of Incident Hospitalization PAD and CLI, Multiplicative and Additive Interaction (95% CIs) of AHA‐Defined Recommended Physical Activity Level With Demographic and Clinical Conditions
| Recommended vs Poor Physical Activitya | β3a | P Values | RERIa | P Values | |
|---|---|---|---|---|---|
| PAD | |||||
| Sex | |||||
| Male | 1.06 (0.78–1.43) | −0.61 (−1.09 to 0.14)b | 0.011 | −0.51 (−0.90 to 0.12)b | 0.010 |
| Female | 0.57 (0.38–0.85)b | ||||
| Race | |||||
| White | 0.86 (0.64–1.14) | −0.08 (−0.58 to 0.42) | 0.759 | −0.14 (−0.69 to 0.41) | 0.610 |
| Black | 0.79 (0.51–1.22) | ||||
| Age, y | |||||
| <55 | 0.66 (0.46–0.94)b | 0.43 (−0.01 to 0.88) | 0.058 | 0.35 (0.00 to 0.71)b | 0.048 |
| ≥55 | 1.01 (0.74–1.39) | ||||
| Ever smoking | |||||
| No | 0.87 (0.56–1.34) | −0.05 (−0.54 to 0.44) | 0.850 | −0.24 (−0.88 to 0.41) | 0.467 |
| Yes | 0.83 (0.62–1.10) | ||||
| Diabetes | |||||
| No | 0.90 (0.67–1.20) | −0.22 (−0.70 to 0.26) | 0.370 | −0.95 (−2.21 to 0.30) | 0.136 |
| Yes | 0.72 (0.47–1.09) | ||||
| Hypertension | |||||
| No | 0.97 (0.69–1.36) | −0.30 (−0.75 to 0.14) | 0.183 | −0.25 (−0.64 to 0.14) | 0.214 |
| Yes | 0.72 (0.52–1.00) | ||||
| CLI | |||||
| Sex | |||||
| Male | 1.19 (0.71–1.98) | −1.04 (−1.85 to 0.22)b | 0.013 | −0.83 (−1.36 to 0.29)b | 0.002 |
| Female | 0.42 (0.21–0.84)b | ||||
| Race | |||||
| White | 0.67 (0.39–1.16) | 0.34 (−0.39 to 1.08) | 0.360 | 0.21 (−0.97 to 1.39) | 0.724 |
| Black | 0.95 (0.55–1.63) | ||||
| Age, y | |||||
| <55 | 0.80 (0.44–1.45) | −0.01 (−0.74 to 0.73) | 0.987 | −0.04 (−0.72 to 0.64) | 0.909 |
| ≥55 | 0.81 (0.48–1.32) | ||||
| Ever smoking | |||||
| No | 0.91 (0.50–1.64) | −0.22 (−0.95 to 0.51) | 0.553 | −0.31 (−1.10 to 0.48) | 0.442 |
| Yes | 0.73 (0.44–1.21) | ||||
| Diabetes | |||||
| No | 0.76 (0.44–1.32) | 0.09 (−0.63 to 0.82) | 0.798 | −0.92 (−4.19 to 2.35) | 0.581 |
| Yes | 0.83 (0.49–1.42) | ||||
| Hypertension | |||||
| No | 1.11 (0.60–2.03) | −0.53 (−1.28 to 0.22) | 0.168 | −0.61 (−1.46 to 0.24) | 0.157 |
| Yes | 0.65 (0.39–1.10) | ||||
Poor physical activity: 0 min/week of moderate or vigorous exercise; recommended physical activity: ≥75 min/week of vigorous exercise or ≥150 min/week of moderate plus vigorous exercise. AHA indicates American Heart Association; β3, coefficient of interaction term; CLI, critical limb ischemia; PAD, peripheral artery disease; RERI, relative excess risk for interaction.
All models adjusted for age, sex, race, education, smoking status, drinking status, health insurance, leisure score, work score, body mass index, systolic blood pressure, total and HDL cholesterol, creatinine‐derived eGFR, white blood cell, diabetes, antihypertensive medication use, cholesterol‐lowering medication use, aspirin use, and interaction term.
Statistically significant at 5%.
In sensitivity analyses, the association between physical activity and incident hospitalization with PAD remained similar, with additional adjustment for baseline ABI category (Tables S3 and S4) or censoring on other incident cardiovascular diseases (Tables S5 and S6). When we considered a 1‐ to 5‐year lag time after baseline, findings remained virtually the same (Tables S7 and S8). Even in the analysis with lag time of 5 years, vigorous exercise was significantly associated with lower risk of hospitalization with CLI in Model 5 (hazard ratio, 0.73 in Table S8). Finally, evaluation of total minutes of physical activity per week regardless of intensity demonstrated similar patterns as those for American Heart Association physical activity categories, with significant associations restricted to Models 1 and 2 (Table S9).
Discussion
In our study participants free of prevalent cardiovascular disease at baseline, 62% did not reach American Heart Association–recommended levels of exercise, with 37% at the poor activity level. Participants with recommended physical activity levels showed lower risk of hospitalization with PAD and CLI compared with those with poor levels in unadjusted and demographically adjusted models. This association was no longer significant once other social and lifestyle factors such as smoking status were considered. However, when we investigated moderate exercise and vigorous exercise individually, vigorous exercise was more strongly associated with lower risk of hospitalization with PAD and CLI compared with moderate exercise. Of note, the association of vigorous exercise with lower risk of CLI remained significant in the most extended model in our study, accounting for demographic, social, lifestyle, and clinical factors. The results were largely consistent in most demographic and clinical subgroups assessed, but the association between physical activity and hospitalization with PAD was especially evident in female and younger cohort participants. Taken altogether, our results further support the importance of physical activity for vascular health.
A few prospective studies have reported the inverse association between physical activity and development of PAD or ABI progression upon a demographic‐ or lifestyle‐adjusted model.20, 22, 23, 24 Our study is largely consistent with these past studies, but it expands current knowledge in several ways. First, to our knowledge, this is the first report of the association between physical activity and CLI, a devastating form of PAD, in a community‐based cohort. Second, our study had extensive follow‐up (over 25 years), which allowed us to find out that censoring PAD cases in the first 5 years did not alter the results and assure temporality. Third, we explored moderate exercise and vigorous exercise individually and observed a stronger association with vigorous exercise than moderate exercise with PAD, especially for CLI. Finally, the large sample size allowed us to evaluate the associations in understudied subgroups such as those of black race.
There are several plausible mechanisms linking exercise and lower risk of PAD. For example, higher levels of exercise correlate with other favorable lifestyles (eg, never smoking). Indeed, the exercise‐PAD relationship was attenuated with additional adjustment for social and lifestyle factors (Model 3 in Table 2). Also, regular exercise can optimize the atherosclerotic risk factor profile (eg, improving insulin sensitivity and reducing blood pressure)42 and thus prevent PAD. In addition, exercise has been shown to reduce inflammation, a pathophysiological condition known to play an important role in atherosclerotic diseases.43
In addition to the total amount of exercise, we found that intensity may play a vital role, especially for CLI. In our study, a 200 METs×min/wk increase in vigorous exercise (corresponding to ≈30 minutes of bicycle at 9.4 mph per week) was associated with a 28% lower risk of hospitalization with CLI independently of atherosclerotic risk factors. Apart from further improvement in metabolic health discussed above,44, 45, 46 exercise, when reaching a certain intensity, is known to induce angiogenesis and increase capillary density, thereby improving microcirculation.47 Interestingly, this concept is in line with the notion that microcirculation impairment plays an important role in the development of CLI.48 Nonetheless, more studies are needed to investigate the specific role of exercise intensity in improving vascular health.
A stronger inverse association of physical activity with hospitalization with PAD was shown for female than male participants and younger participants than older participants. The sex difference is consistent with some other epidemiological studies with coronary heart disease and diabetes mellitus as an outcome.5, 49 Although the underlying mechanisms behind this observation are unclear, some experts have pointed out potential contributions of anatomic and physiological differences, exercise preferences, and other lifestyles differences between women and men.49 Regarding the age difference, this pattern with a stronger association in younger than older individuals has been shown in most traditional cardiovascular risk factors (eg, blood pressure and lipids) and may simply reflect higher baseline risk with a limited contribution of a single factor to further elevate the risk. Indeed, the incidence rate of hospitalization with PAD for the older cohort participants was 2‐fold higher than that for the younger cohort participants (21.1 versus 11.7/10 000 person‐years). Of note, we tested multiple subgroups without a prior hypothesis, and therefore this analysis should be considered as hypothesis generating. Future studies are needed to confirm our observation and, if so, to explore potential mechanisms behind these differences between sex and age groups.
Although we observed some significant results, the association of physical activity with hospitalization for PAD in our study appeared weaker than that for myocardial infarction and stroke in previous ARIC studies,7, 8, 9 which merits some discussion. Although PAD, myocardial infarction, and stroke are categorized as atherosclerotic diseases, their pathophysiological processes are not identical. For example, plaque rupture is a key process for the development of myocardial infarction and stroke, which include different subtypes such as larger artery thrombosis, cardiac emboli, and lacunar stroke.50, 51 Thus, it is possible that exercise will contribute differently to these 3 major types of atherosclerotic diseases. Also, it is worth mentioning that for PAD, a higher level of physical activity may lead to a higher probability of inducing leg symptoms (eg, intermittent claudication),52 which may result in an earlier detection and hospitalization for PAD and would attenuate the observed association of physical activity with lower risk of PAD, even if they are truly associated.
There are a few clinical and public health implications from our study. First, our findings provide additional evidence about the importance of physical activity for vascular health. Second, our results indicate that intensity of exercise may be especially important for leg vascular health. Thus, for a given amount of physical activity, whenever capable, engaging in vigorous physical activity for a shorter time (rather than moderate exercise for a longer time) may result in better leg vascular health. Although confirmatory studies are needed, our observation of the link between vigorous physical activity and lower risk of CLI is important, as CLI is a devastating condition with one half of patients either dying or losing their legs within a year after its diagnosis.48
Several limitations of our study should be acknowledged. First, physical activity was assessed by a modified Baecke questionnaire on the basis of self‐report, which is subjected to recall bias and thus misclassification, and it may be imprecise in capturing sedentary behavior and low‐intensity activities.15, 20 In future studies, objective measurements (ie, accelerometer based) should be implemented to assess patterns, amount, and intensity of physical activity and their impact on PAD risk. Second, the cases of hospitalization with PAD and CLI were identified on the basis of discharge diagnosis. Thus, there was probably some misclassification in that we likely missed mild PAD cases without symptoms or under management at outpatient settings. Nonetheless, the epidemiologic profile of severe cases is important, as those cases have a poor prognosis and impact medical expenditure.53, 54 Finally, as in all observational studies, we are unable to rule out residual confounding.
In conclusion, greater physical activity was modestly associated with lower risk of hospitalization with PAD in a community‐based middle‐old age sample. Vigorous exercise was robustly associated with lower risk of hospitalization with PAD, particularly its severe form, CLI. Our results further highlight the importance of engaging in more vigorous physical activity for cardiovascular health.
Sources of Funding
The Atherosclerosis Risk in Communities study has been funded in whole or in part with federal funds from the National Heart, Lung, and Blood Institute; National Institutes of Health; and Department of Health and Human Services, under contract nos. HHSN268201700001I, HHSN268201700002I, HHSN268201700003I, HHSN268201700005I, and HHSN268201700004I. Dr Selvin was supported by NIH/NIDDK grants K24DK106414 and R01DK089174. Dr Schrack was supported by NIH/NIA grants R21AG053198 and U01AG057545. Dr Matsushita was supported by NIH/NHLBI R21 HL133694.
Disclosures
Dr Matsushita received research funding and personal fee from Fukuda Denshi outside of the work. The remaining authors have no disclosures to report.
Supporting information
Table S1. Hazard Ratios of Incident PAD and CLI, Multiplicative and Additive Interaction (95% CIs) of American Heart Association–Defined Intermediate Physical Activity Level With Demographic and Clinical Conditions
Table S2. Hazard Ratios of Incident PAD and CLI, Multiplicative and Additive Interaction (95% CIs) per 200 METs×min/wk Increase in Vigorous Physical Activity With Demographic and Clinical Conditions
Table S3. Hazard Ratios (95% CIs) for Associations Between American Heart Association–Defined Physical Activity Category With Incident PAD and CLI With Adjustment on Baseline ABI Category
Table S4. Hazard Ratios (95% CIs) of Incident PAD and CLI per 200 METs×min/wk Increase in Moderate or Vigorous Physical Activity With Adjustment on Baseline ABI Category
Table S5. Hazard Ratios (95% CIs) for Associations Between American Heart Association–Defined Physical Activity Category With Incident PAD and CLI With Additional Censoring on Incident Cardiovascular Diseases
Table S6. Hazard Ratios (95% CIs) of Incident PAD and CLI per 200 METs×min/wk Increase in Moderate or Vigorous Physical Activity With Additional Censoring on Incident Cardiovascular Diseases
Table S7. Hazard Ratios (95% CIs) for Associations Between American Heart Association–Defined Physical Activity Category With Incident PAD and CLI With Lag Years
Table S8. Hazard Ratios (95% CIs) of Incident PAD and CLI per 200 METs×min/wk Increase in Moderate or Vigorous Physical Activity With Lag Years
Table S9. Hazard Ratios (95% CIs) for Associations Between 5 Physical Activity Categories Regardless of Intensity With Incident PAD and CLI
Acknowledgments
The authors thank the staff and participants of the ARIC study for their important contributions.
(J Am Heart Assoc. 2019;8:e013534 DOI: 10.1161/JAHA.119.013534.)
References
- 1. Fowkes FG, Aboyans V, Fowkes FJ, McDermott MM, Sampson UK, Criqui MH. Peripheral artery disease: epidemiology and global perspectives. Nat Rev Cardiol. 2017;14:156–170. [DOI] [PubMed] [Google Scholar]
- 2. Fowkes FG, Rudan D, Rudan I, Aboyans V, Denenberg JO, McDermott MM, Norman PE, Sampson UK, Williams LJ, Mensah GA, Criqui MH. Comparison of global estimates of prevalence and risk factors for peripheral artery disease in 2000 and 2010: a systematic review and analysis. Lancet. 2013;382:1329–1340. [DOI] [PubMed] [Google Scholar]
- 3. Allison MA, Ho E, Denenberg JO, Langer RD, Newman AB, Fabsitz RR, Criqui MH. Ethnic‐specific prevalence of peripheral arterial disease in the United States. Am J Prev Med. 2007;32:328–333. [DOI] [PubMed] [Google Scholar]
- 4. Eckel Robert H, Jakicic John M, Ard Jamy D, de Jesus Janet M, Miller Nancy H, Van Hubbard S, Lee IM, Lichtenstein Alice H, Loria Catherine M, Millen Barbara E, Nonas Cathy A, Sacks Frank M, Smith Sidney C, Svetkey Laura P, Wadden Thomas A, Yanovski Susan Z. 2013 AHA/ACC guideline on lifestyle management to reduce cardiovascular risk. Circulation. 2014;129:S76–S99. [DOI] [PubMed] [Google Scholar]
- 5. Sattelmair J, Pertman J, Ding EL, Kohl HW III, Haskell W, Lee IM. Dose response between physical activity and risk of coronary heart disease: a meta‐analysis. Circulation. 2011;124:789–795. [DOI] [PMC free article] [PubMed] [Google Scholar]
- 6. Shiroma EJ, Lee IM. Physical activity and cardiovascular health: lessons learned from epidemiological studies across age, gender, and race/ethnicity. Circulation. 2010;122:743–752. [DOI] [PubMed] [Google Scholar]
- 7. Bell EJ, Lutsey PL, Windham BG, Folsom AR. Physical activity and cardiovascular disease in African Americans in Atherosclerosis Risk in Communities. Med Sci Sports Exerc. 2013;45:901–907. [DOI] [PMC free article] [PubMed] [Google Scholar]
- 8. Autenrieth CS, Evenson KR, Yatsuya H, Shahar E, Baggett C, Rosamond WD. Association between physical activity and risk of stroke subtypes: the Atherosclerosis Risk in Communities study. Neuroepidemiology. 2013;40:109–116. [DOI] [PMC free article] [PubMed] [Google Scholar]
- 9. Florido R, Zhao D, Ndumele CE, Lutsey PL, McEvoy JW, Windham BG, Pankow JS, Guallar E, Michos ED. Physical activity, parental history of premature coronary heart disease, and incident atherosclerotic cardiovascular disease in the Atherosclerosis Risk in Communities (ARIC) study. J Am Heart Assoc. 2016;5:e003505 DOI: 10.1161/JAHA.116.003505. [DOI] [PMC free article] [PubMed] [Google Scholar]
- 10. Alzamora MT, Fores R, Baena‐Diez JM, Pera G, Toran P, Sorribes M, Vicheto M, Reina MD, Sancho A, Albaladejo C, Llussa J. The peripheral arterial disease study (PERART/ARTPER): prevalence and risk factors in the general population. BMC Public Health. 2010;10:38.20529387 [Google Scholar]
- 11. Bertoni AG, Whitt‐Glover MC, Chung H, Le KY, Barr RG, Mahesh M, Jenny NS, Burke GL, Jacobs DR. The association between physical activity and subclinical atherosclerosis: the Multi‐Ethnic Study of Atherosclerosis. Am J Epidemiol. 2009;169:444–454. [DOI] [PMC free article] [PubMed] [Google Scholar]
- 12. Chang P, Nead KT, Olin JW, Myers J, Cooke JP, Leeper NJ. Effect of physical activity assessment on prognostication for peripheral artery disease and mortality. Mayo Clin Proc. 2015;90:339–345. [DOI] [PubMed] [Google Scholar]
- 13. Engstrom G, Ogren M, Hedblad B, Wollmer P, Janzon L. Asymptomatic leg atherosclerosis is reduced by regular physical activity. Longitudinal results from the cohort “men born in 1914”. Eur J Vasc Endovasc Surg. 2001;21:502–507. [DOI] [PubMed] [Google Scholar]
- 14. Housley E, Leng GC, Donnan PT, Fowkes FG. Physical activity and risk of peripheral arterial disease in the general population: Edinburgh Artery Study. J Epidemiol Community Health. 1993;47:475–480. [DOI] [PMC free article] [PubMed] [Google Scholar]
- 15. Kulinski JP, Sanghavi M, Ayers CR, Das SR, Banerjee S, Berry JD, Addo T, De Lemos JA, Kumbhani DJ. Association between low ankle‐brachial index and accelerometer‐derived sedentary and exercise time in the asymptomatic general population. Vasc Med. 2015;20:332–338. [DOI] [PubMed] [Google Scholar]
- 16. Loprinzi PD, Abbott K. Association of diabetic peripheral arterial disease and objectively‐measured physical activity: NHANES 2003–2004. J Diabetes Metab Disord. 2014;13:63. [DOI] [PMC free article] [PubMed] [Google Scholar]
- 17. Stein RA, Rockman CB, Guo Y, Adelman MA, Riles T, Hiatt WR, Berger JS. Association between physical activity and peripheral artery disease and carotid artery stenosis in a self‐referred population of 3 million adults. Arterioscler Thromb Vasc Biol. 2015;35:206–212. [DOI] [PMC free article] [PubMed] [Google Scholar]
- 18. Wilson AM, Sadrzadeh‐Rafie AH, Myers J, Assimes T, Nead KT, Higgins M, Gabriel A, Olin J, Cooke JP. Low lifetime recreational activity is a risk factor for peripheral arterial disease. J Vasc Surg. 2011;54:427–432, 432.e421–424. [DOI] [PMC free article] [PubMed] [Google Scholar]
- 19. Gardner AW, Sieminski DJ, Montgomery PS. Physical activity is related to ankle/brachial index in subjects without peripheral arterial occlusive disease. Angiology. 1997;48:883–891. [DOI] [PubMed] [Google Scholar]
- 20. Parsons TJ, Sartini C, Ellins EA, Halcox JP, Smith KE, Ash S, Lennon LT, Wannamethee SG, Lee IM, Whincup PH, Jefferis BJ. Objectively measured physical activity and sedentary behaviour and ankle brachial index: cross‐sectional and longitudinal associations in older men. Atherosclerosis. 2016;247:28–34. [DOI] [PMC free article] [PubMed] [Google Scholar]
- 21. Criqui MH, Aboyans V. Epidemiology of peripheral artery disease. Circ Res. 2015;116:1509–1526. [DOI] [PubMed] [Google Scholar]
- 22. Barone Gibbs B, Dobrosielski DA, Althouse AD, Stewart KJ. The effect of exercise training on ankle‐brachial index in type 2 diabetes. Atherosclerosis. 2013;230:125–130. [DOI] [PMC free article] [PubMed] [Google Scholar]
- 23. Delaney JA, Jensky NE, Criqui MH, Whitt‐Glover MC, Lima JA, Allison MA. The association between physical activity and both incident coronary artery calcification and ankle brachial index progression: the Multi‐Ethnic Study of Atherosclerosis. Atherosclerosis. 2013;230:278–283. [DOI] [PMC free article] [PubMed] [Google Scholar]
- 24. Heikkila A, Venermo M, Kautiainen H, Aarnio P, Korhonen P. Physical activity improves borderline ankle‐brachial index values in a cardiovascular risk population. Ann Vasc Surg. 2016;32:50–56. [DOI] [PubMed] [Google Scholar]
- 25. Piercy KL, Troiano RP, Ballard RM, Carlson SA, Fulton JE, Galuska DA, George SM, Olson RD. The physical activity guidelines for Americans. JAMA. 2018;320:2020–2028. [DOI] [PMC free article] [PubMed] [Google Scholar]
- 26. Atherosclerosis Risk in Communities study description. Available at: https://sites.cscc.unc.edu/aric/. Accessed May 30, 2019.
- 27. The Atherosclerosis Risk in Communities (ARIC) study: design and objectives. The ARIC investigators. Am J Epidemiol. 1989;129:687–702. [PubMed] [Google Scholar]
- 28. Rose GA. The diagnosis of ischaemic heart pain and intermittent claudication in field surveys. Bull World Health Organ. 1962;27:645–658. [PMC free article] [PubMed] [Google Scholar]
- 29. Folsom AR, Arnett DK, Hutchinson RG, Liao F, Clegg LX, Cooper LS. Physical activity and incidence of coronary heart disease in middle‐aged women and men. Med Sci Sports Exerc. 1997;29:901–909. [DOI] [PubMed] [Google Scholar]
- 30. Ainsworth BE, Haskell WL, Herrmann SD, Meckes N, Bassett DR Jr, Tudor‐Locke C, Greer JL, Vezina J, Whitt‐Glover MC, Leon AS. 2011 compendium of physical activities: a second update of codes and met values. Med Sci Sports Exerc. 2011;43:1575–1581. [DOI] [PubMed] [Google Scholar]
- 31. Atherosclerosis Risk in Colmlunities Study protocol manual 11: sitting blood pressure. Available at: https://www2.cscc.unc.edu/aric/sites/default/files/public/manuals/Sitting_Blood_Pressure_and_Postural_Changes_in_Blood_Pressure_and_Heart_Rate.1_11.pdf. Accessed May 30, 2019.
- 32. Siedel J, Hägele EO, Ziegenhorn J, Wahlefeld AW. Reagent for the enzymatic determination of serum total cholesterol with improved lipolytic efficiency. Clin Chem. 1983;29:1075. [PubMed] [Google Scholar]
- 33. Warnick GR, Benderson J, Albers JJ. Dextran sulfate‐Mg2+ precipitation procedure for quantitation of high‐density‐lipoprotein cholesterol. Clin Chem. 1982;28:1379–1388. [PubMed] [Google Scholar]
- 34. Folsom AR, Wu KK, Rosamond WD, Sharrett AR, Chambless LE. Prospective study of hemostatic factors and incidence of coronary heart disease: the Atherosclerosis Risk in Communities (ARIC) study. Circulation. 1997;96:1102–1108. [DOI] [PubMed] [Google Scholar]
- 35. Chambless LE, McMahon RP, Brown SA, Patsch W, Heiss G, Shen YL. Short‐term intraindividual variability in lipoprotein measurements: the Atherosclerosis Risk in Communities (ARIC) study. Am J Epidemiol. 1992;136:1069–1081. [DOI] [PubMed] [Google Scholar]
- 36. Nieto FJ, Szklo M, Folsom AR, Rock R, Mercuri M. Leukocyte count correlates in middle‐aged adults: the Atherosclerosis Risk in Communities (ARIC) study. Am J Epidemiol. 1992;136:525–537. [DOI] [PubMed] [Google Scholar]
- 37. Levey AS, Stevens LA, Schmid CH, Zhang YL, Castro AF III, Feldman HI, Kusek JW, Eggers P, Van Lente F, Greene T, Coresh J. A new equation to estimate glomerular filtration rate. Ann Intern Med. 2009;150:604–612. [DOI] [PMC free article] [PubMed] [Google Scholar]
- 38. Wattanakit K, Folsom AR, Selvin E, Coresh J, Hirsch AT, Weatherley BD. Kidney function and risk of peripheral arterial disease: results from the Atherosclerosis Risk in Communities (ARIC) study. J Am Soc Nephrol. 2007;18:629–636. [DOI] [PubMed] [Google Scholar]
- 39. Yang C, Kwak L, Ballew SH, Garimella PS, Jaar BG, Folsom AR, Heiss G, Selvin E, Lutsey PL, Coresh J, Matsushita K. Kidney function, bone‐mineral metabolism markers, and future risk of peripheral artery disease. Atherosclerosis. 2017;267:167–174. [DOI] [PMC free article] [PubMed] [Google Scholar]
- 40. Vart P, Coresh J, Kwak L, Ballew SH, Heiss G, Matsushita K. Socioeconomic status and incidence of hospitalization with lower‐extremity peripheral artery disease: Atherosclerosis Risk in Communities study. J Am Heart Assoc. 2017;6:e004995 DOI: 10.1161/JAHA.116.004995. [DOI] [PMC free article] [PubMed] [Google Scholar]
- 41. Li R, Chambless L. Test for additive interaction in proportional hazards models. Ann Epidemiol. 2007;17:227–236. [DOI] [PubMed] [Google Scholar]
- 42. Bassuk SS, Manson JE. Epidemiological evidence for the role of physical activity in reducing risk of type 2 diabetes and cardiovascular disease. J Appl Physiol (1985). 2005;99:1193–1204. [DOI] [PubMed] [Google Scholar]
- 43. Cassar K, Bachoo P, Ford I, Greaves M, Brittenden J. Markers of coagulation activation, endothelial stimulation and inflammation in patients with peripheral arterial disease. Eur J Vasc Endovasc Surg. 2005;29:171–176. [DOI] [PubMed] [Google Scholar]
- 44. Gebel K, Ding D, Chey T, Stamatakis E, Brown WJ, Bauman AE. Effect of moderate to vigorous physical activity on all‐cause mortality in middle‐aged and older Australians. JAMA Intern Med. 2015;175:970–977. [DOI] [PubMed] [Google Scholar]
- 45. Swain DP, Franklin BA. Comparison of cardioprotective benefits of vigorous versus moderate intensity aerobic exercise. Am J Cardiol. 2006;97:141–147. [DOI] [PubMed] [Google Scholar]
- 46. Wen CP, Wai JP, Tsai MK, Yang YC, Cheng TY, Lee MC, Chan HT, Tsao CK, Tsai SP, Wu X. Minimum amount of physical activity for reduced mortality and extended life expectancy: a prospective cohort study. Lancet. 2011;378:1244–1253. [DOI] [PubMed] [Google Scholar]
- 47. Duscha BD, Robbins JL, Jones WS, Kraus WE, Lye RJ, Sanders JM, Allen JD, Regensteiner JG, Hiatt WR, Annex BH. Angiogenesis in skeletal muscle precede improvements in peak oxygen uptake in peripheral artery disease patients. Arterioscler Thromb Vasc Biol. 2011;31:2742–2748. [DOI] [PMC free article] [PubMed] [Google Scholar]
- 48. Varu VN, Hogg ME, Kibbe MR. Critical limb ischemia. J Vasc Surg. 2010;51:230–241. [DOI] [PubMed] [Google Scholar]
- 49. Hands B, Parker H, Larkin D, Cantell M, Rose E. Male and female differences in health benefits derived from physical activity: implications for exercise prescription. J Womens Health Issues Care. 2016;5:4. [Google Scholar]
- 50. Libby P, Theroux P. Pathophysiology of coronary artery disease. Circulation. 2005;111:3481. [DOI] [PubMed] [Google Scholar]
- 51. Wardlaw JM. What causes lacunar stroke? J Neurol Neurosurg Psychiatry. 2005;76:617. [DOI] [PMC free article] [PubMed] [Google Scholar]
- 52. McDermott MM. Lower extremity manifestations of peripheral artery disease: the pathophysiologic and functional implications of leg ischemia. Circ Res. 2015;116:1540–1550. [DOI] [PMC free article] [PubMed] [Google Scholar]
- 53. Chase MR, Friedman HS, Navaratnam P, Heithoff K, Simpson RJ Jr. Comparative assessment of medical resource use and costs associated with patients with symptomatic peripheral artery disease in the United States. J Manag Care Spec Pharm. 2016;22:667–675. [DOI] [PMC free article] [PubMed] [Google Scholar]
- 54. Hirsch AT, Hartman L, Town RJ, Virnig BA. National health care costs of peripheral arterial disease in the Medicare population. Vasc Med. 2008;13:209–215. [DOI] [PubMed] [Google Scholar]
Associated Data
This section collects any data citations, data availability statements, or supplementary materials included in this article.
Supplementary Materials
Table S1. Hazard Ratios of Incident PAD and CLI, Multiplicative and Additive Interaction (95% CIs) of American Heart Association–Defined Intermediate Physical Activity Level With Demographic and Clinical Conditions
Table S2. Hazard Ratios of Incident PAD and CLI, Multiplicative and Additive Interaction (95% CIs) per 200 METs×min/wk Increase in Vigorous Physical Activity With Demographic and Clinical Conditions
Table S3. Hazard Ratios (95% CIs) for Associations Between American Heart Association–Defined Physical Activity Category With Incident PAD and CLI With Adjustment on Baseline ABI Category
Table S4. Hazard Ratios (95% CIs) of Incident PAD and CLI per 200 METs×min/wk Increase in Moderate or Vigorous Physical Activity With Adjustment on Baseline ABI Category
Table S5. Hazard Ratios (95% CIs) for Associations Between American Heart Association–Defined Physical Activity Category With Incident PAD and CLI With Additional Censoring on Incident Cardiovascular Diseases
Table S6. Hazard Ratios (95% CIs) of Incident PAD and CLI per 200 METs×min/wk Increase in Moderate or Vigorous Physical Activity With Additional Censoring on Incident Cardiovascular Diseases
Table S7. Hazard Ratios (95% CIs) for Associations Between American Heart Association–Defined Physical Activity Category With Incident PAD and CLI With Lag Years
Table S8. Hazard Ratios (95% CIs) of Incident PAD and CLI per 200 METs×min/wk Increase in Moderate or Vigorous Physical Activity With Lag Years
Table S9. Hazard Ratios (95% CIs) for Associations Between 5 Physical Activity Categories Regardless of Intensity With Incident PAD and CLI