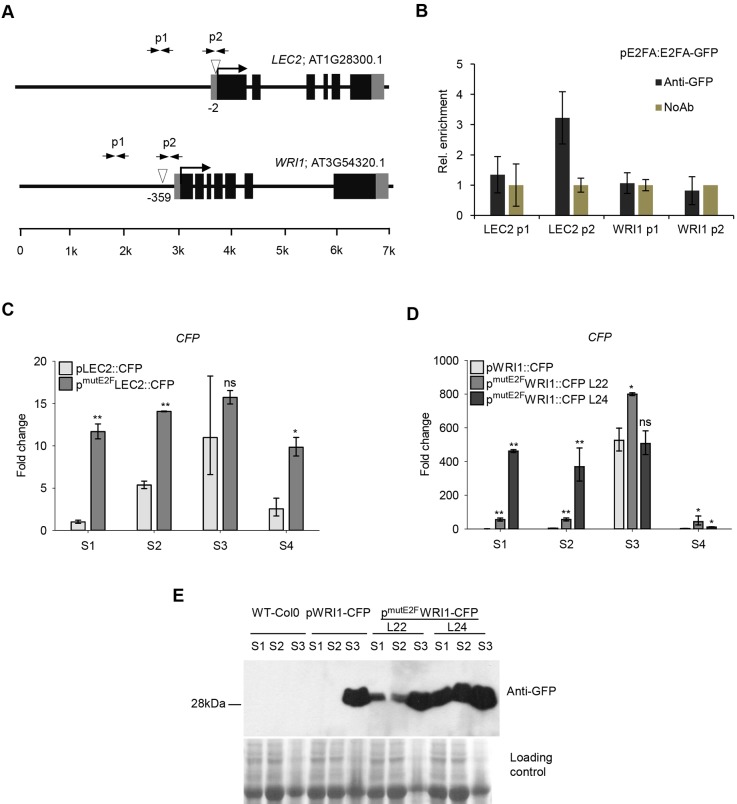
Fig. 6.
E2Fs could regulate the temporal control of LEC2 and WRI1 genes during silique development. (A) Schematic of the LEC2 and WRI1 promoters; arrows labelled p1 and p2 indicate the position of the primer pairs used for qPCR analysis. The position of the canonical E2F elements (white arrowheads) and their distance from the start codon (ATG) are depicted. (B) ChIP followed by qRT-PCR was carried out on chromatin isolated from developing green siliques (6-10 DAP) of the pgE2FA-GFP transgenic line using a polyclonal anti-rabbit GFP antibody (Ab). The graph shows the results of a representative experiment with three biological replicates. Non-parametric Mann–Whitney U-test was used for statistical analysis between values of Ab and NoAb samples (P<0.05). The labels p1 and p2 on the x-axis refer to the regions indicated in A. (C,D) The expression levels of reporter LEC2 (C) and WRI1 (D) constructs either under the control of the intact (pLEC2::CFP, pWRI1::CFP, respectively) or the E2F-binding-site-mutant promoter version (pmutE2FLEC2::CFP, pmutE2FWRI::CFP, respectively) were determined by qRT-PCR in the developing siliques (S1-S4). L22 and L24 represent two independent E2F-binding-site-mutant promoter lines (D). Values represent fold changes normalised to the value of the intact promoter construct at the S1 silique stage (set arbitrarily at 1). Data are mean±s.d., n=3 biological repeats. *P≤0.05, **P≤0.01 (two-tailed, paired t-test between the corresponding mutant and the intact promoter construct, at a given silique stage). ns, non-significant. (E) Immunoblot assay using anti-GFP antibody showing the CFP protein level in developing siliques (S1-S3) of the same transgenic lines shown in D, as indicated. Molecular weight of the CFP protein (28 kDa) is indicated on the left. The Coomassie-stained proteins were used as loading control.

