Abstract
Purpose:
Most digital breast tomosynthesis (DBT) reconstruction methods neglect the blurring of the projection views caused by the finite size or motion of the x-ray focal spot. This paper studies the effect of source blur on the spatial resolution of reconstructed DBT using analytical calculation and simulation, and compares the influence of source blur over a range of blurred source sizes.
Methods:
Mathematically derived formulas describe the point spread function (PSF) of source blur on the detector plane as a function of the spatial locations of the finite-sized source and the object. By using the available technical parameters of some clinical DBT systems, we estimated the effective source sizes over a range of exposure time and DBT scan geometries. We used the CatSim simulation tool (GE Global Research, NY) to generate digital phantoms containing line pairs and beads at different locations and imaged with sources of four different sizes covering the range of potential source blur. By analyzing the relative contrasts of the test objects in the reconstructed images, we studied the effect of the source blur on the spatial resolution of DBT. Furthermore, we simulated a detector that rotated in synchrony with the source about the rotation center and calculated the spatial distribution of the blurring distance in the imaged volume to estimate its influence on source blur.
Results:
Calculations demonstrate that the PSF is highly shift-variant, making it challenging to accurately implement during reconstruction. The results of the simulated phantoms demonstrated that a typical finite-sized focal spot (~0.3 mm) will not affect the reconstructed image resolution if the x-ray tube is stationary during data acquisition. If the x-ray tube moves during exposure, the extra blur due to the source motion may degrade image resolution, depending on the effective size of the source along the direction of the motion. A detector that rotates in synchrony with the source does not reduce the influence of source blur substantially.
Conclusions:
This study demonstrates that the extra source blur due to the motion of the x-ray tube during image acquisition substantially degrades the reconstructed image resolution. This effect cannot be alleviated by rotating the detector in synchrony with the source. The simulation results suggest that there are potential benefits of modeling the source blur in image reconstruction for DBT systems using continuous-motion acquisition mode.
Keywords: digital breast tomosynthesis, image reconstruction, x-ray focal spot blur, geometric unsharpness, spatial resolution
1. Introduction
DBT reconstruction methods usually neglect the blurring of the projection views (PVs) caused by the finite size of the x-ray focal spot. In a DBT system, the focal spot of the x-ray tube has a nominal size of around 0.3 mm1–4. To date, the U.S. Drug & Food Administration (FDA) has approved four breast imaging systems for tomosynthesis. These systems are SenoClaire (or the new model Pristina) by GE Healthcare, Selenia Dimensions by Hologic, Mammomat Inspiration by Siemens and Aspire Cristalle by Fujifilm. The GE Pristina system operates in the step-and-shoot mode where the x-ray tube essentially stops at each angular location and exposes the projection image. The other three systems operate in a continuous-motion mode where the x-rays are generated within a short pulse at each angle while the gantry is continuously moving during a DBT scan. While the continuous-motion mode can potentially reduce the total scan time and the motion blur, it may cause additional source blur along the direction of the source motion. This effect has been found to be an image-quality degrading factor in several studies5–9. A pure step-and-shoot mode can alleviate this problem. However, the time that the x-ray tube can be stationary is always limited. If the x-ray exposure time exceeds the time that the x-ray tube is stationary, there can be some extra source blur although the amount of motion blur is still less than that in continuous-motion DBT systems7, 8.
Several studies examined source blur in CT reconstruction. For fan-beam CT, Hofmann et al. studied the effect of modeling the source’s ray profile10, 11. They used a simulated phantom to estimate the critical size for the focal spot that affects the image reconstruction quality and concluded that for common fan-beam CT systems, the size of the focal spot can be neglected in image reconstruction. Tilley et al. studied the effect of modeling the source blur and detector blur for flat-panel cone-beam CT (FP-CBCT)12, 13 and demonstrated that modeling the source blur can significantly improve the reconstructed image quality. The reconstruction method proposed in their study considered the source blur to be shift-invariant, greatly simplifying its implementation in the system model. A DBT system also uses cone-beam x-ray and a flat-panel detector, but the geometry of DBT is very different from that of FP-CBCT. In DBT, the imaged volume is closer to the detector and the imaged object is much thinner than those in body CT, so the magnification factor and its variation over the depth of the imaged volume are smaller. The spatial resolution requirement for DBT is much higher than in CBCT because microcalcifications have a size range of about 0.1 to 0.5 mm.
This paper describes our study of the effect of source blur on image quality for DBT through analytical calculation and simulation. We first define parameters that describe the geometry of the finite-sized x-ray source. We choose our simulated blurred source sizes based on the range estimated from the three commercial DBT systems that use the continuous-motion data acquisition mode. We then demonstrate by analytical calculation the spatial variance of the source blur over the detector field of view (FOV). Next, we report our CatSim11, 14 simulations of DBT imaging systems with a finite-sized focal spot. Two phantoms with line pairs and beads (BB) are configured and imaged with four focal spot sizes for evaluation of the reconstructed image resolution. We analyze the relative contrast curves of these objects in the reconstructed DBT when different-sized sources are used to simulate the projections in comparison to those obtained from an ideal point-source DBT system, which can be considered a DBT reconstruction with perfect system modeling to correct for the source blur. For DBT systems with a continuous-motion x-ray source and a detector moving in synchrony with the source about the rotation center, the source blur may be partly reduced although both the x-ray source and the detector still move relative to the objects being imaged. We compare the source blur of DBT systems with moving detector and stationary detector by analyzing the spatial distributions of geometric unsharpness in the imaged volume at different projection angles. These results illustrate constraints in designing DBT systems and under what conditions modeling the finite-sized x-ray source may improve the reconstructed image quality.
2. Materials and Methods
2.1. Simplified model for the source blur
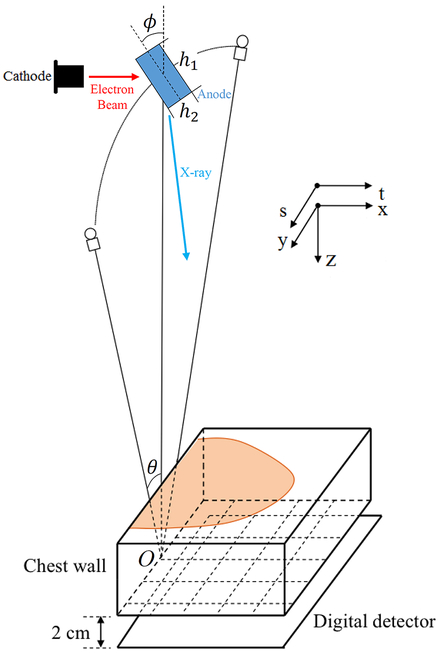
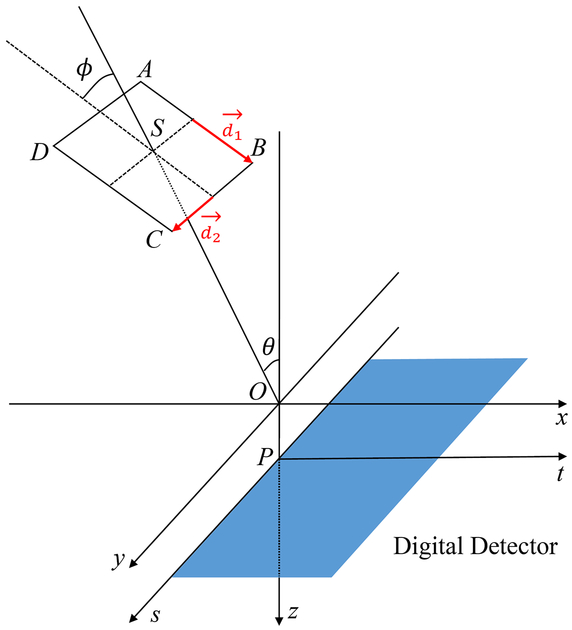
Figure 1 shows the geometry of a typical DBT system where the source rotates in a plane tangential to the chest wall of the patient. This study uses a simplified model for source blur that treats the x-ray source as a rectangle with uniform x-ray emission on the anode surface, shown as the blue rectangle. We define x-y-z coordinates for the imaged volume and t-s coordinates for the detector. The origin x,y,z = 0 (marked as O in Figure 1) is the rotation center (the point where the rotation axis intersects with the rotation plane of the source) and t,s = 0 is its perpendicular projection on the detector. We denote dso and dod the distance from the x-ray source to the rotation center and the distance from the rotation center to the detector, respectively. The center of the finite-sized x-ray source is at the original location of the ideal point source. The rectangle of the focal spot is described with three parameters: its sizes along two directions h1 and h2 and the target angle ϕ. ϕ is usually smaller than 45°. Figure 1 shows the case where the projection angle θ is 0°. If the projection angle θ is not 0°, the blue rectangle will tilt by the same angle θ such that the h2 edge of the rectangle is parallel to the direction that the x-ray source is moving.
Figure 1.
The simplified model for the finite-sized focal spot and the definition of parameters. The projection angle θ is positive when the focal spot is in the positive side of y-direction.
2.2. Estimation of the h1 and h2 for DBT systems with continuous-motion data acquisition
For commercial DBT systems that use a continuous-motion mode, the nominal size of the focal spot, hnominal, can be found in their technical documents (see Table A1 in Appendix A). The nominal focal spot size refers to the effective size of the focal spot of the central ray (i.e., the ray perpendicular to the detector plane when the scan angle is 0°) when the source is stationary. Therefore h1 can be calculated given hnominal and the target angle ϕ:
| (1) |
The value of h1 remains the same even when we consider the motion of the source. The effective h2, on the other hand, depends on the motion of the source. For DBT systems with continuous-motion x-ray source, the motion during data acquisition results in additional blurring of the finite-sized focal spot and increasing the effective h2. Assuming the source is moving with a constant speed, the source blur along the direction of the motion can be approximated by the convolution of two rectangle functions, one with the width of hnominal and the other with the width of the distance that the source moves, denoted as hmotion. The result of the convolution is trapezoidal and occasionally triangular (when hmotion = hnominal). For the worst-case scenario, we consider the width of the non-zero part of the convolution result to be the effective h2:
| (2) |
Therefore, for simplicity, we simulated the focal spot to be a rectangle at the x-ray anode location (Figure 1) with an effective width of h2 in the motion direction given by Eq. (2) to approximate the total effect of convolving the focal spot blur function with the motion blur function in the CatSim simulation to produce the projection images used in our study. This rectangular focal spot, however, will produce focal spot point spread function (PSF) that is spatially variant on the detector plane, as described in Section 2.3 and Section 3.1.
Assuming a constant speed of the source for continuous-motion DBT systems, we can estimate the speed given the distance from the source to the rotation center, the total acquisition angle and the total exposure time. We obtained the typical total current-time product (mAs) of the three commercial systems for different breast thicknesses from their quality control documents or FDA’s summary of safety and effectiveness data (SSED) online. The exposure time per PV can be estimated from the total mAs, the current and the total number of projections. The distance that the source travels during the exposure of one PV (hmotion) is the product of the speed of the source and the exposure time per PV. Tables A1 – A4 in Appendix A show the geometric parameters, technical details and the references for the three commercial DBT systems. For most breast thicknesses, the source motion contributes significantly to the effective h2, which can be as large as 1.6 mm according to these calculations. Although the technique factors may not be exactly the same as those used clinically, the estimated h2 values provide a reference range for our study.
As seen in Tables A1–A4, the design parameters of commercial DBT systems vary and it is difficult to compare the relative impact of source blur on image resolution in the presence of other confounding factors from different scanning geometries or system design parameters. As it is not our purpose to analyze or compare commercial DBT systems, we instead simulate a fixed DBT system geometry that has a range of effective x-ray focal spot sizes covering the potential motion range of the source estimated in the tables. We then demonstrate the spatial variance of source blur and compare the impact of different degrees of source blur on image resolution under the same image acquisition and reconstruction conditions.
2.3. Spatial variance of the source blur PSF for DBT system
We used a pinhole array that was parallel to the detector plane to calculate the effective shape and size of the focal spot as seen on the detector plane. A pinhole is traditionally used to experimentally measure the x-ray focal spot size15, 16. The projection of a finite-sized source through the pinhole represents the blurring for a point object at the pinhole’s location due to geometric unsharpness and can be considered to be the source blur PSF for the location. Such a source blur PSF depends on the distance from the detector and the spatial location of the object on the x-y plane. Therefore, the projection image with source blur cannot be obtained by convolution of a PSF with the ideal projection image of a whole volume.
We modeled the imaging geometry of the GE second generation (GEN2) prototype DBT system and the spatial variance of the source blur PSF. Different DBT systems may have different geometry (e.g., scan angle, angular increments) but the observed trends of the effects of the source blur PSF should be applicable to other geometries. For this system, the x-ray tube rotates in 3° increments to acquire 21 projection images within ±30°. The digital detector is stationary during the acquisition, i.e., hmotion=0. The system uses a CsI phosphor/a:Si active matrix flat panel detector with a pixel size of 0.1 × 0.1 mm2. The distance from the source to the rotation center, denoted as dso,GEN2, is 64 cm. The distance from the imaged volume to the digital detector is 2 cm, denoted as dod,GEN2. The target angle is ϕGEN2 = 22.5°.
During image reconstruction, the x- and y-dimensions of the voxel were both chosen to be 0.1 mm, the same as the pixel size of the detector and the z-dimension of the voxel is chosen to be 1 mm. We chose this voxel size because it is a typical size used for DBT reconstruction in the literature and was also used in several of our previous studies17–20. Even if reconstruction at smaller pixel size such as 0.05 × 0.05 mm2 in-plane resolution can be performed to take advantage of super-resolution19, 21 or for DBT systems with actual detector pixels smaller than 0.1 × 0.1 mm2 (Table A1), such high resolution has not been implemented in routine clinical use due to consideration of many factors such as data set size and workflow efficiency. In addition, due to geometric magnification the Nyquist frequency at a specific plane of the reconstructed volume is higher than the Nyquist frequency of the detector, making a smaller reconstruction voxel size desirable for some applications. However, since our purpose is to evaluate the source blur that may affect commercial systems, the study of source blur at high resolution reconstruction is beyond the scope of the current study.
We analytically calculate the source blur PSF over the detector plane for the GEN2 System (see Appendix B for the formulas). Instead of using the detector size 192.0 × 230.4 mm2 of the system, the detector size is set to be 240.0 × 300.0 mm2, which is closer to the detector size of commercial DBT systems4. The nominal size of the x-ray source is 0.3 mm. Therefore we can derive the values for h1 and h2:
| (3) |
Starting from the point t = 10 mm, s = 0 mm, we set up an array of locations every 20 mm along both the t- and s-direction. To illustrate the spatial variations in the source blur PSF, we calculate the PSFs for each location of this array. Using zpinhole to denote the plane of the pinhole array, we study the following two conditions:
Condition A: h1 = 0.78 mm, h2 = 0.3 mm, ϕ = 22.5°, depending on the projection angle θ;
Condition B: h1 = 0.78 mm, h2 = 0.3 mm, zpinhole = −50mm.
For Condition A we used a large zpinhole value to illustrate the geometry shape variation of the source PSF over the object plane. In Condition B the source size was chosen to be the typical 0.3 mm. zpinhole was also chosen to simulate a typical depth of the object in a DBT scan.
2.4. Configuration of CatSim simulation
As the results in Section 3.1 show, the source blur PSF is highly variant in DBT, making modeling this effect very challenging in image reconstruction. Therefore we used CatSim11, 14 (GE Global Research, NY) to simulate projection images in DBT with finite-sized x-ray sources to study the effect of source blur on the reconstructed images. A range of effective focal spot sizes was used to simulate projections of objects at different spatial locations for a wide range of projection angles. The analysis of the resolution of the resulting reconstructed images provides useful information of the limitation of the effective focal spot size (or source motion) on the design of DBT systems and the potential benefits of trying to correct for source blur in DBT reconstruction under certain imaging conditions.
We simulated four sets of parameters for the source as specified in Table 1. As a reference point, Source 0 was the ideal point source. Source 1 had the standard nominal size and the target angle of the GEN2 System, as expressed in Eq. (3). For Source 2 and Source 3, we increased the value of h2 to 1.0 mm and 2.0 mm to simulate the influence of the source motion during the image acquisition, since the effective h2 could be as large as 1.6 mm according to Table A2 and Table A4. Given the uncertainties in those estimates, we chose h2 = 2.0 mm as an upper bound of the source blur. The comparison of Source 1, Source 2 and Source 3 will demonstrate the effect of the source motion on the reconstructed image resolution, while the comparison between Source 0 and the other three sources will indicate the potential improvement in resolution by modeling the source blur in DBT reconstruction.
Table 1.
X-ray sources simulated in this study. Source 0 simulated an ideal point source although it still had a finite physical size as required by CatSim.
| Name | Source 0 | Source 1 | Source 2 | Source 3 |
|---|---|---|---|---|
| Oversampling rate | 1 | 6 | 6 | 6 |
| Target angle (ϕ) | 22.5° | 22.5° | 22.5° | 22.5° |
| h1 (mm) | 0.001 | 0.784 | 0.784 | 0.784 |
| h2 (mm) | 0.001 | 0.3 | 1.0 | 2.0 |
We configured the geometry of the GEN2 DBT system in CatSim. We simulated a complete set of 21 projections every 3° from −30° to 30°. The detector pixel pitch was 0.1 × 0.1 mm2, and had a size of 2400 × 3000 pixels. The x-ray source was an Rh target/Rh filter x-ray tube and the kilovoltage was set to 29 kV. We used an oversampling rate of 10 × 10 per pixel for the detector. The oversampling rate was the number of rays traced per pixel or per object to simulate a high resolution analog projection image with CatSim19, 22. The oversampling rate for Sources 1–3 was set to 6 since our simulation showed that a higher oversampling rate provided negligible improvement in the simulation accuracy.
We configured two digital phantoms in this study. The first phantom contained lead line pairs (LP) and lead beads (BBs), referred to as the LPBB phantom. The second phantom only contained BBs of calcium carbonate to simulate the microcalcifications (MC) in DBT, referred to as the MC phantom. Both phantoms were analytically specified in configuration files using the FORBILD syntax11. The quantum noise, detector blur and noise, and the scattered radiation were turned off (assumed to be 0) and the detector absorbed all incident photons so that we could focus on the investigation of the effects of the source blur on DBT reconstruction.
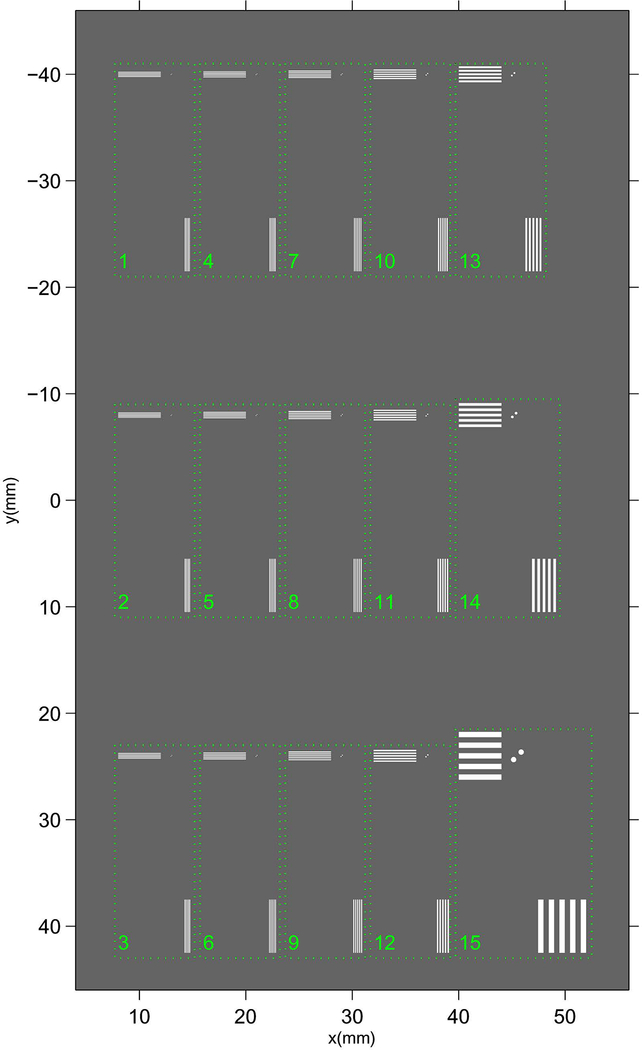
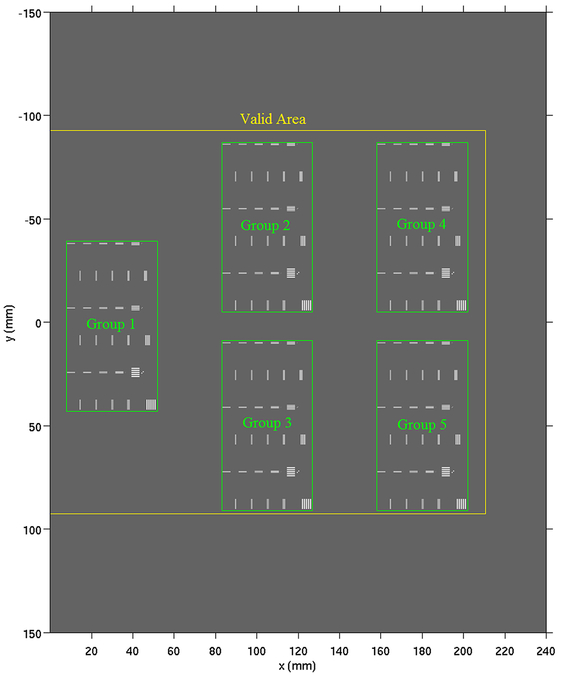
To study the location dependence of the source blur, we placed multiple groups of high-contrast LPs and BB pairs at different locations. We first configured a group of objects called the base group (Figure 2). Then we shifted the base group to different locations to generate multiple groups of the same objects (Figure 3).
Figure 2.
Setup of a digitally generated resolution phantom. Each set (marked by box) contains three types of objects: horizontal line pairs, vertical line pairs, and two lead spheres (BBs). The sizes of all objects are shown in Table 2.
Figure 3.
The in-plane locations of the objects for the LPBB phantom. Group 1 is the base group and Groups 2–5 are the derived groups.
Figure 2 shows the base group of the LPBB phantom containing 15 sets of objects. The distance from each object to the bottom of the imaged volume was chosen to be 50.6 mm so that the objects were located approximately at the center of the in-focus slice (slice 51 from the bottom of the imaged volume or the breast support plate) when the DBT was reconstructed at a slice thickness of 1 mm. Each set contained a pair of small BBs with their center-to-center line oriented at 45° to the x-direction and two sets of line pairs along the x- and y-direction with the same spatial frequency. Each group of line pairs consisted of five lead bars and four spacings, i.e., 4.5 line pairs, with the width of the lead bar the same as the width of the spacing. The line pairs were used to study the spatial resolution along the two directions under various source blur conditions. The two spheres were arranged along a 45° line relative to the pixel grid to demonstrate the spatial resolution for small objects, at a representative angle (e.g., diagonal) to the voxel grid, which combined the effect of the spatial resolution in the x- and y-directions. Table 2 shows the line pair frequency and the sizes of the individual bars and spheres. The background material was configured as breast tissue with 50% glandular/50% fat based on the data from ICRU report 4623. The thickness of the background material was set to be 6 cm. The thickness of the lead line pairs is configured to be 0.03 mm in our simulation, similar to the thickness of commercial lead line pair phantoms for testing spatial resolution of mammography systems.
Table 2.
Objects sizes (mm) in the digital phantom. The object set number corresponds to the number next to each box in Figure 2. The center-to-center distance between the two BBs in a pair is equal to 2 times the BB diameter.
| Object Set Number | 1 | 4 | 7 | 10 | 13 |
|---|---|---|---|---|---|
| line pairs/mm | 9.5 | 8.0 | 6.5 | 5.0 | 3.0 |
| Line or space width | 0.053 | 0.063 | 0.077 | 0.100 | 0.167 |
| BB Diameter | 0.053 | 0.063 | 0.077 | 0.100 | 0.167 |
| Object Set Number | 2 | 5 | 8 | 11 | 14 |
| line pairs/mm | 9.0 | 7.5 | 6.0 | 4.5 | 2.0 |
| Line or space width | 0.056 | 0.067 | 0.083 | 0.111 | 0.250 |
| BB Diameter | 0.056 | 0.067 | 0.083 | 0.111 | 0.250 |
| Object Set Number | 3 | 6 | 9 | 12 | 15 |
| line pairs/mm | 8.5 | 7.0 | 5.5 | 4.0 | 1.0 |
| Line or space width | 0.059 | 0.071 | 0.091 | 0.125 | 0.500 |
| BB Diameter | 0.059 | 0.071 | 0.091 | 0.125 | 0.500 |
Figure 3 shows the LPBB phantom with five groups of test objects. Group 1 was the base group centered at y=0. The other four “derived” groups were obtained by shifting Group 1 to different locations on the plane; Group 2: x-shift =75 mm, y-shift = −48 mm; Group 3: x-shift = 75 mm, y-shift= +48 mm; Group 4: x-shift = 150 mm, y-shift = −48 mm; Group 5: x-shift = 150 mm, y-shift = +48 mm. We chose these shift distances such that all groups were within the ‘valid area’ of the slice, which we defined as the area where an object would be imaged within the detector FOV at all projection angles. If an object was too far from the rotation center (outside the valid area), its image would be projected outside the detector FOV at some or all of the projection angles. Their reconstructed images would be in the region of truncation artifacts that would affect its contrast18. The combined effect of source blur and reconstruction truncation artifacts is out of the scope of this study.
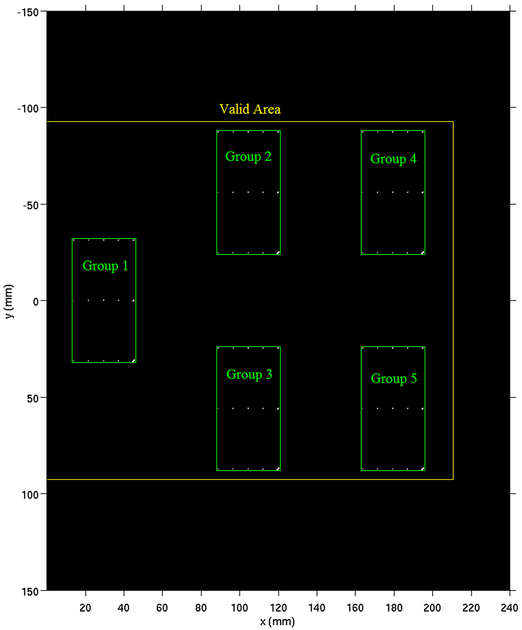
The MC phantom contained only BBs of calcium carbonate (CaCO3) to simulate MCs in DBT. Similar to the LPBB phantom, we configured 15 pairs of BBs for this phantom at 50.6 mm from the bottom of the imaged volume with 50% glandular/50% fat tissue background. The diameters of the BBs were identical to those in the LPBB phantom. Figure 4 shows the base group of objects and the four derived groups. The x-shift locations of the four derived groups were the same as those in the LPBB phantom but the y-shift was ±56 mm. The y-dimension of each group was smaller in the MC phantom than that of the LPBB phantom so that the four groups could be separated farther along the y-direction to fully use the “valid area”.
Figure 4.
The in-plane locations of the objects for the MC phantom.
Due to the discrete sampling in digital imaging, the alignment of the objects relative to the pixel grid of the detector affects the resolution and contrast of the reconstructed object images, especially for objects of sizes close to the pixel size. The alignment affects the different objects in the phantom to different degrees because of their different locations relative to the pixel grid. To compare different amount of source blurs, it is more useful to study the “average” effect when objects are imaged by a DBT system without knowledge of their imaged location relative to the pixel grid. We simulated this average effect by generating projections with the test patterns placed at 5 × 5 locations with respect to the pixel grid, each of which was shifted by 1/5 pixel (0.02 mm) along either the x- or y-direction. We then reconstructed the DBT at each shift location and calculated the line pair contrasts from the reconstructed images. The contrasts of the same line pair were averaged over the different alignments. More details were described in our previous study of the segmented separable footprint projector for DBT reconstruction19.
2.5. Figures of merit
To quantitatively analyze the image quality with different source blurs, we defined figures of merits (FOM) for the line pairs and BBs, similar to those in our previous study19. For each set of line pairs, we extracted nine profiles at the central part of the line pairs and took the average. For each pair of BBs, we extracted one profile through the line that passed through the centers of the two spheres, which were calculated from the analytical locations of the objects as defined in the configuration of the phantom.
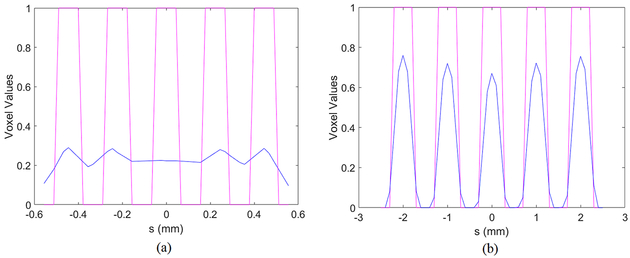
To calculate the contrast of the line pairs, we first calculated the ideal profile of the corresponding line pair in the high resolution phantom to identify the spatial boundaries of the peak and valley regions of the line pairs, as shown in the examples in Figure 5. The blue curves show the reconstructed profile and the magenta curves show the ideal profile with a normalized voxel value of 1 in the peak regions. As seen from the line profile that was well resolved in the reconstructed images (Figure 5(b)), the peaks and valleys of the reconstructed profile matched well with those of the ideal profile. The peak and valley regions in the ideal profile were used to define the corresponding regions in the reconstructed profile where the mean peak and valley values should be calculated even when they were not well resolved, as shown in Figure 5(a). The contrast was then calculated as the difference between these two mean values, normalized to the contrast value of the line pairs in the ideal profile, which had the same constant value for all line pair frequencies as the lead line pairs had a constant thickness of 0.03 mm. The calculated ideal contrast might not be accurate due to factors such as beam hardening in our simulation. However, the inaccuracy would not affect the relative contrast comparisons in this study because all curves being compared used the same phantom setup and were normalized to the same reference value.
Figure 5.
Examples for determining the peak and valley regions for calculating the mean contrast values. The blue curve shows the profile of the reconstructed horizontal line pairs for Source 2. The magenta curve shows the ideal profile of the line pairs with the normalized peak voxel value of 1. The spatial frequencies are (a) f = 4.5/mm, (b) f = 1/mm. The slopes of the ideal profiles are not perfectly vertical because of the finite sampling rate of the profiles.
We calculated the BB contrast based on the detected peaks along the profile. If 2 peaks and 1 valley were detected, we used the following equation to define the relative contrast of the BB:
| (4) |
Where p1 and p2 were the values at two peaks, v was the value at the valley and b is the background voxel value. Otherwise, the contrast was considered to be 0. We used the relative contrast instead of the absolute contrast because BBs with different diameters have different thicknesses along the z-direction and some might be split into more than one slice. There are large differences between the absolute contrasts of BBs of different diameters, making the contrast-versus-diameter curve less meaningful. As defined in Eq. (4), the relative contrast represents whether the two BBs can be resolved and a perfectly separate BB pair will have the maximum value of 1. When the two peaks are not equal, we used the larger one of the two peaks in the denominator to be conservative in estimating the relative contrast. For simplicity, the relative contrast is referred to as “contrast” in the following discussion.
These contrast-versus-frequency curves are similar to the commonly used modulation transfer function (MTF) in x-ray imaging, but they are calculated with rectangular waves instead of sinusoidal functions. Despite the difference, these curves still reflect the relative spatial resolution of the reconstruction with the influence of source blur and other factors.
2.6. Comparison of source blur effects between moving detector and stationary detector
To discuss the influence on source blur of a moving detector compared with a stationary detector, we use the geometry of the Hologic Selenia Dimensions system, which uses a moving detector, as an example. For this system, the distance between the source rotation center and the detector is 0 such that the rotation axis is within the detector plane1. Our simulation rotates the detector synchronously with the source about the rotation axis by the same angle of the source so the central ray of the x-ray beam remains normal to the detector plane during image acquisition.
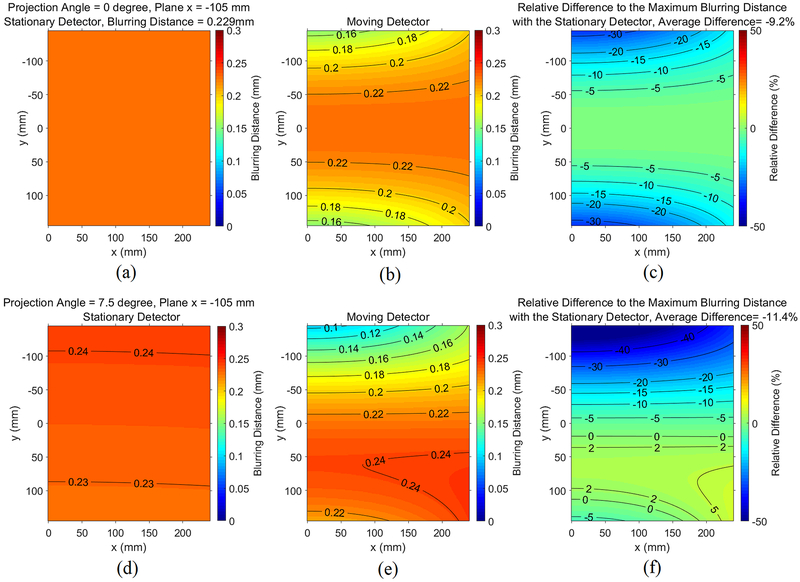
We investigated the influence of the moving detector on source blur by a simplified model using a point source. We simulated 1.3 mm source motion during the exposure of each projection, corresponding to the maximum motion estimated in Table A2. Therefore, the effective focal spot is a 1.3-mm-wide one-dimensional line source parallel to the source motion. At the central projection angle, the line source is parallel to the y-direction. Given that the distance from the source to the rotation center is 700 mm, a source size of ±0.65mm corresponds to an angular span of ±0.053° and the detector also rotates by 0.106° during the exposure of each projection. The projected location of a point in the imaged volume on the detector plane will change with the small source motion. Geometrically calculating this location before and after the motion, leads to the distance between these two points. This “blurring distance” represents the amount of blurring for one point in the imaged volume due to the source motion. The blurring distance can be calculated as a distribution in the imaged volume for the moving detector or for the stationary detector. Such a comparison indicates the effect of the moving detector on the source blur.
3. Results and discussions
3.1. Spatial Distribution of Source Blur PSF
3.1.1. Condition A – Illustration of Spatially Variant Shape
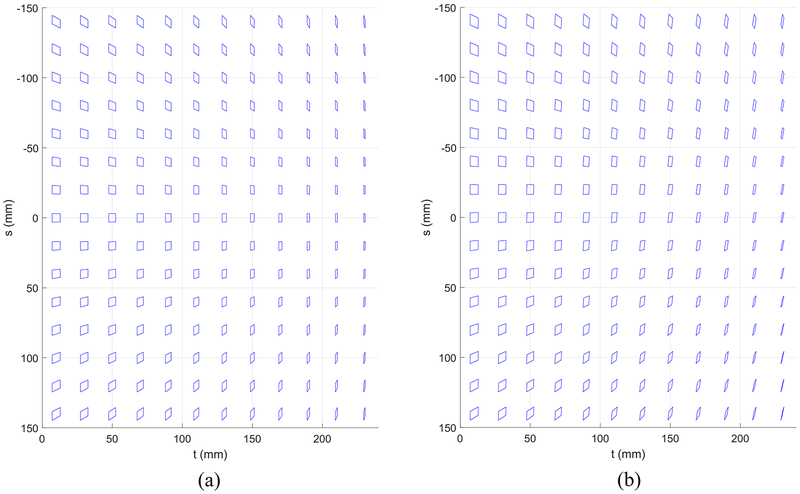
We projected the focal spot through a pinhole array to the detector plane to illustrate the spatially variant shape of the focal spot PSF. To facilitate visualization, we enlarged each projected focal spot by a factor of 20 while fixing its center at the original projected location in the figures. Figure 6(a) shows the source blur PSF at the projection angle θ = 0°. As expected, the distribution of the PSF is symmetrical along the s = 0 axis. The PSF closest to the central ray at t = 10 mm, s = 0 mm is approximately the shape of a square. This is reasonable considering that the nominal focal spot size is measured with the central beam at t = 0 mm, s = 0 mm. For most PSFs that are not close to the rotation axis, their shape is more similar to a parallelogram. The area of the PSF decreases when t increases. Figure 6(b) shows the source blur PSF at a projection angle θ = 30°. Most PSFs are of the shape similar to a parallelogram but their two sides perpendicular to the anode-cathode axis are not necessarily parallel to the s-axis. It can be observed that the PSF of the source blur changes gradually throughout the detector plane and is highly shift-variant.
Figure 6.
The source blur PSFs for a source of nominal size of 0.3 mm for pinholes at with different projection angles: (a) θ = 0°; (b) θ = 30°. We enlarged each projected focal spot shape by a factor of 20 while fixing its center at the original projected location to facilitate visualization.
3.1.2. Condition B – Typical Focal Spot Size in DBT Systems
Condition B shows the shape of each of the PSFs of a type focal spot of size 0.3 mm. The PSF is similar to that at the same location in Figure 6 except that the actual projected size is plotted. Figure 7 and Figure 8 show the PSF at four locations for the projection angles θ = 0° and θ = 30° in, respectively. The PSFs in Figure 8 are generally larger than that of Figure 7, since the distance from the source to the detector is smaller for Figure 8, resulting in greater geometric unsharpness.
Figure 7.
The source blur PSFs for a source of nominal size of 0.3 mm for pinholes at depth zpinhole = −50 mm at the projection angle θ = 0° at four different locations: (a) t = 10 mm, s = 0 mm; (b) t = 230 mm, s = 0 mm; (c) t = 10 mm, s = 140 mm; (d) t = 230 mm, s = 140 mm.
Figure 8.
The source blur PSFs for a source of nominal size of 0.3 mm for pinholes at depth zpinhole = −50 mm at the projection angle θ = 30° at four different locations: (a) t = 10 mm, s = 0 mm; (b) t = 230 mm, s = 0 mm; (c) t = 10 mm, s = 140 mm; (d) t = 230 mm, s = 140 mm.
Figure 7 and Figure 8 show that the size of the PSFs is on average about 0.04 mm along one direction. For DBT systems with a detector pixel size of 0.1 mm, the source blur PSF will not strongly affect the spatial resolution of the projection images if the effective h2 stays as 0.3 mm such as an ideal step-and-shoot system. On the other hand, for DBT systems designed with continuous scanning motion and pulsed x-ray exposure during the acquisition of the projections, the effective h2 can be as large as 1.6 mm, as shown in Table A2 and Table A4. For these systems, the effect of the source blur on image reconstruction may not be negligible, as discussed in the next section.
3.2. Simulating the Effect of Source Blur with CatSim
We quantitatively analyzed the objects reconstructed from projection images simulated with different source sizes. DBT reconstruction was performed with the simultaneous algebraic reconstruction technique (SART) with five iterations for all conditions17. Three types of objects (horizontal line pairs, vertical line pairs and BBs) were analyzed. The FOMs described in Section 2.5 were calculated. The plotted curves were the average of all the shifted locations for the same objects imaged under the same conditions. The mean contrast curves were compared for the different test objects and different source blur conditions.
3.2.1. Horizontal line pairs in the LPBB phantom
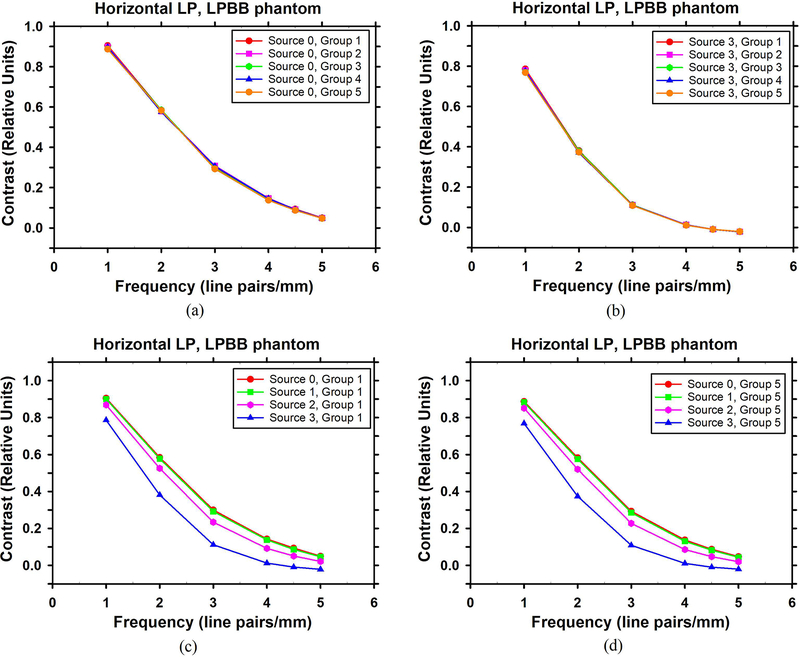
Figure 9 shows the contrast as a function of spatial frequency for the horizontal line pairs in the reconstructed in-focus slice of the LPBB phantom DBT. The horizontal line pairs are perpendicular to the source motion direction. For all sources studied (Source 0 to Source 3), the line pairs in the different groups of objects had similar contrast at each spatial frequency, indicating that the contrast does not depend on the locations. We plotted only Source 0 and Source 3 in Figure 9(a) and 9(b), respectively, as examples. The resolution of the horizontal line pairs is mainly affected by the focal spot size in the source motion direction, which changes relatively slowly (see Figure 7 and Figure 8 that shifted by 140 mm) within the ±48 mm shifts in locations between Group 2 and Group 3, or between Group 4 and Group 5. Although the effective focal spot size changes rapidly along the direction of the anode-cathode axis, it does not affect the horizontal line pairs as they are constant in this direction. As a result, for the same spatial frequency, the contrast of a set of horizontal line pairs does not change much among different groups of objects. Because of the limited “valid” region that is free of truncation artifacts, we are not able to compare the horizontal resolution in the regions near the two ends of the imaged volume, so it is unknown whether this observation still holds in those regions.
Figure 9.
Dependence of the mean contrast of the horizontal line pairs in the LPBB phantom on the group location and the source: (a) dependence on the group location for Source 0 (ideal point source); (b) dependence on the group location for Source 3; (c) dependence on the source for Group 1; (d) dependence on the source for Group 5.
Figure 9(c) and 9(d) show the dependence of the line pair contrast on the source for the horizontal line pairs in Group 1 and Group 5. The contrast of horizontal line pairs is almost identical for Source 0 and Source 1 at different frequencies and spatial locations. Since Source 1 has a typical focal spot size of a DBT system (~0.3 mm) if the source is stationary at exposure, Figure 9(c) and 9(d) indicate that treating the 0.3 mm source as a point source has a negligible effect on the reconstructed quality for the horizontal line pairs if the pixel size of the detector or at reconstruction is 0.1 mm.
Figure 9(c) and 9(d) also show that the contrast of horizontal line pairs decreases if Source 2 or Source 3 is used. For Source 3, the contrast of the horizontal line pairs becomes negative at spatial frequencies higher than about 4 line pairs/mm, indicating that the reconstructed line pairs has a phase shift of about 180° compared with the ideal profile of the line pairs. In other words, the negative contrast indicates that the peaks and valleys of the line pairs reverse their polarity in the reconstructed images. The difference between Source 0 and Source 2 is smaller than the difference between Source 2 and Source 3.
In summary, the spatial resolution in the direction of source motion is sensitive to the extra source blur from the motion. It can be substantially degraded in the range of pulsed exposure time used by DBT systems with continuous-motion acquisition mode.
3.2.2. Vertical line pairs in LPBB phantom
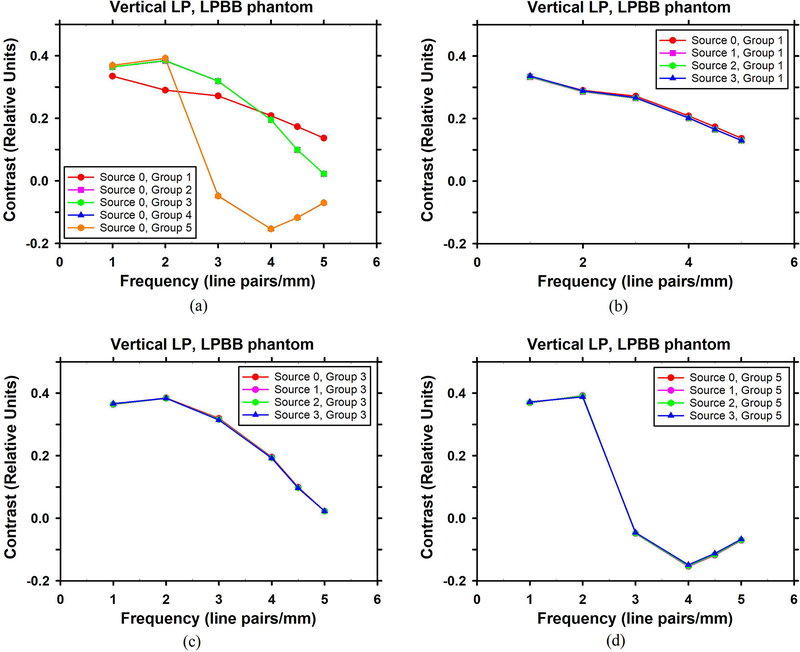
Figure 10 shows the contrast curves as a function of the frequency for the vertical line pairs in the reconstructed in-focus slice of the LPBB phantom DBT. Figure 10(a) shows the dependence of the contrast of the vertical line pairs on the group location with Source 0 used in the simulation of the projection images. It can be seen that the curves of Group 2 and Group 3 are not distinguishable. The curves of Group 4 and Group 5 are also almost identical. However, the contrast curve of Group 1 is very different from those of Group 2 and Group 3, as well as those of Group 4 and Group 5. Group 4 and Group 5 have negative contrast for spatial frequencies higher than about 3 line pairs/mm. Generally, Figure 10(a) shows that the vertical line pairs of high spatial frequencies are less resolvable if they are farther away from the chest wall even though the focal spot dimension perpendicular to the line pairs decreases as the distances from the chest wall (x-direction) increases. The rapid reduction in resolution in this direction is likely caused by the reconstruction leakage from the diverging cone-beam x-rays. Due to the finite thickness of the reconstructed slices, the intensity of high-contrast objects would leak to the adjacent voxels along the ray path, thus reducing the contrast of the line pairs. The influence on the adjacent voxels increases with increasing distance from the chest wall because the angle of the x-ray path intersecting the DBT slice increases. Another possible cause of the rapid reduction in resolution is the increasingly sparse sampling in these planes due to the cone-beam geometry as their distances from the chest wall increase. A future study to explore this possibility using a Defrise phantom may be of interest.
Figure 10.
Dependence of the mean contrast of the vertical line pairs on the group location and the source in the LPBB phantom: (a) dependence on the group location for Source 0; (b) dependence on the source for Group 1; (c) dependence on the source for Group 3; (d) dependence on the source for Group 5.
Figure 10(b) – 10(d) show that, unlike the horizontal line pairs, the contrast of the vertical line pairs is essentially independent of the source blur. This is expected because, in comparison to Source 1, the extra blur caused by the source motion as simulated by Source 2 and Source 3 is mainly along the vertical direction. Blurring the vertical line pairs along the vertical direction does not affect its contrast.
The only noticeable difference among the sources can be observed in Figure 10(b), where the contrast curve for Source 0 is slightly higher than the overlapping contrast curves for Sources 1 to 3. The finite-sized sources have the same target angle ϕ and size h1 (Table 1), which cause the same amount of source blur along the horizontal direction that affects the vertical line pairs. The difference between the point source and the finite-sized sources diminishes for Group 3 (Figure 10(c)) and Group 5 (Figure 10(d)) because the effective source blur along the horizontal direction is smaller for locations farther away from the chest wall.
In summary, if the source is of a typical focal spot size (~0.3 mm) and is stationary during exposure, treating the finite-sized source as a point source does not affect the reconstructed quality for the vertical line pairs if the pixel size of the detector or at reconstruction is 0.1 mm. Even if the source is not stationary such that the effective size of the source blur is as large as 1 mm (Source 2) or 2 mm (Source 3) along the source scanning direction, there is essentially no change in the reconstructed contrast of vertical line pairs.
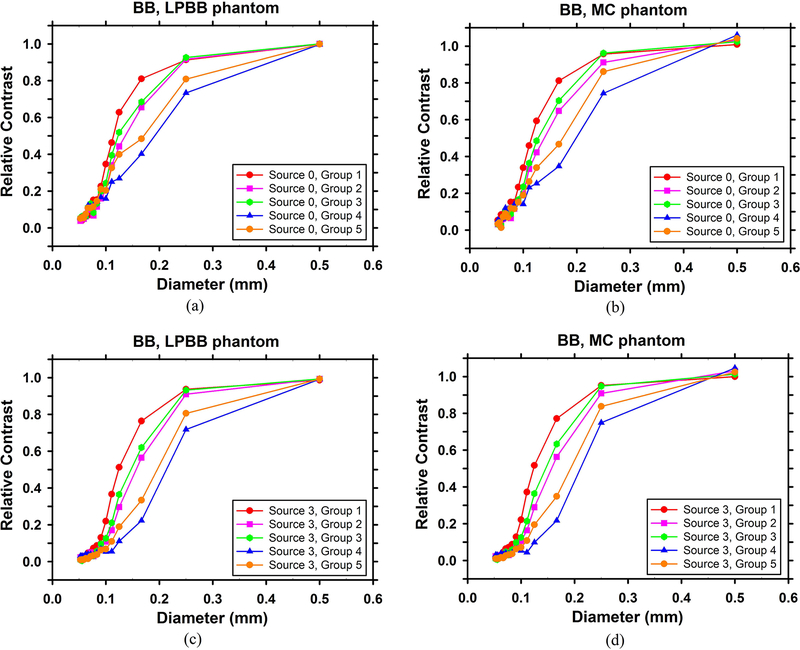
3.2.3. BBs in LPBB phantom and MC phantom
Figure 11 shows the dependence of the contrast of BBs on the group location for Source 0 and Source 3 in the LPBB phantom and the MC phantom. For both sources in either phantom, the contrast of the BBs has strong dependence on the group locations. Generally speaking, the contrast of the BBs is higher in Group 1 than in Group 2/Group 3 and it further decreases in Group 4/Group 5, indicating that the contrast of the BBs decreases as their distance from the chest wall plane increases. The dependence of the contrast of the BBs on the group location is not as strong as that of the vertical line pairs shown in Figure 10(a) but much stronger than that in Figure 9(a), where the contrast of horizontal line pairs is almost independent of the group location. This is expected because the BBs are two dimensional objects that are affected by the resolution of the imaging system in both the horizontal and the vertical directions.
Figure 11.
Dependence of the mean contrast of the BBs on group location for: (a) Source 0, LPBB phantom; (b) Source 0, MC phantom; (c) Source 3, LPBB phantom; (d) Source 3, MC phantom.
Another interesting observation in Figure 11 is that, for either source or with either phantom, the contrast of the BBs in Group 3 is higher than that in Group 2, and the contrast of BBs in Group 5 is also consistently higher than that in Group 4. Note that Group 2 and Group 4 are in the upper half while Group 3 and Group 5 are in the lower half of the imaging field (Figure 4). The center-to-center lines of all BB pairs are oriented in the same direction. The center-to-center lines of the BBs in Group 2 and Group 4 are generally more in line with the cone-beam x-ray paths of all projections. Similar to the contrast loss of the vertical line pairs discussed above, the lower contrast of the BBs in Group 2 and Group 4 may be attributed to the leakage along the x-ray paths of a high-intensity object to the adjacent voxels in the reconstructed slice, thus reducing the valley between the pair of BB.
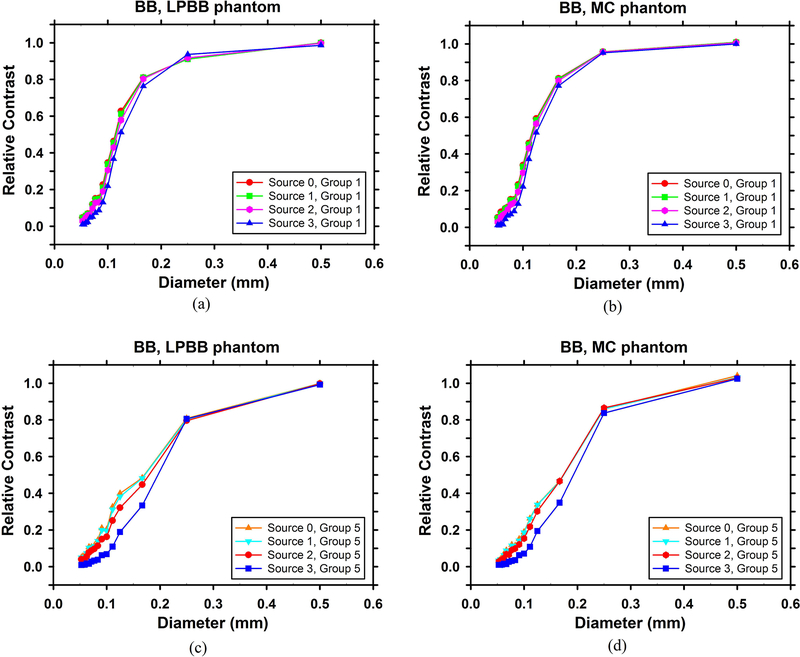
Figure 12 compares the contrast of the BBs obtained with the four sources for Group 1 and Group 5. Figures 12(a) and 12(b)) show that in Group 1 the BB pairs with a diameter larger than about 0.15 mm are highly resolvable with a contrast close to or higher than 0.8 and the difference among the four sources is small. For BBs with a diameter smaller than 0.15 mm, the decrease in contrast with Source 2 and Source 3 becomes noticeable, especially with Source 3. For example, in the LPBB phantom, the contrast of the 0.1-mm-diameter BBs is 0.347 for Source 0. The contrast decreases by 12% to 0.306 for Source 2 and by 37% to 0.219 for Source 3. Figure 12(c) and 12(d) show that the contrast of the BBs in Group 5 is much lower than the corresponding pairs in Group 1. The difference between Source 0 and Source 2 is smaller than the difference between Source 2 and Source 3. Comparing the contrast curves for Source 0 and Source 2, for the BBs of diameters from 0.053 mm to 0.125 mm, the contrast is reduced by 16% to 33% in the LPBB phantom and by 5% to 33% in the MC phantom. Overall, the dependence of the resolution of the BBs on the spatial location on the image plane is stronger than the dependence on the source blur over the range of source sizes studied.
Figure 12.
Comparison of the mean contrast of the BBs for the four sources: (a) Group 1 of the LPBB phantom; (b) Group 1 of the MC phantom; (c) Group 5 of the LPBB phantom; (d) Group 5 of the MC phantom.
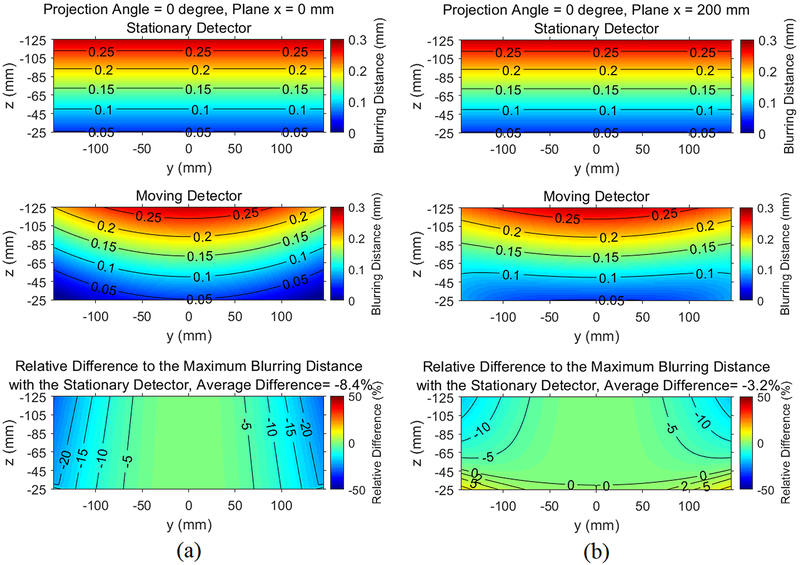
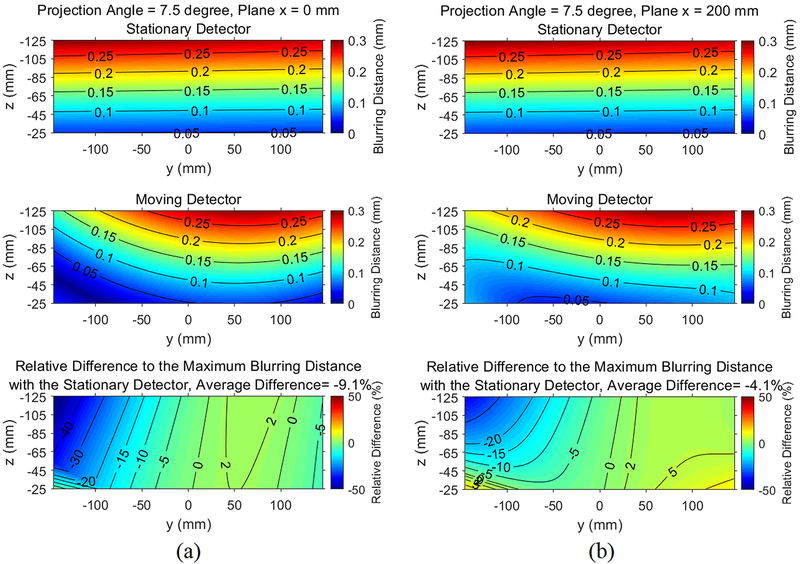
3.3. Comparison of source blur effects between moving detector and stationary detector
To compare the influence of moving detector and stationary detector on source blur effect, the distributions of the blurring distance for two projection angles (0° and 7.5°) and two y-z planes (x = 0 and x = 200 mm) are calculated and shown in Figure 13 and Figure 14. Similar to Figure 1, we still use the rotation center as the origin of the coordinate system. The z-coordinate of the imaged volume then starts from −25 mm, since the distance from the rotation center to the imaged volume is 25 mm according to Sechopoulos et al.1. The sizes of the imaged volume along the y- and z-directions are 290 mm and 100 mm, respectively, assuming that the thickness of the imaged volume is 100 mm and that the imaged volume has the same size as the detector in image reconstruction1.
Figure 13.
Contour plots illustrating the spatial dependence of the blurring distance on a y-z plane for the central projection angle (θ = 0°) for (a) x = 0 (chest wall); (b) x = 200 mm. The third row shows the relative difference of the blurring distance between the moving detector and the stationary detector. A negative relative difference indicates that the moving detector reduces the blurring distance.
Figure 14.
Contour plots illustrating the spatial dependence of the blurring distance on a y-z plane for the maximum projection angle (θ = 7.5°) for (a) x = 0 (chest wall); (b) x = 200 mm. The third row shows the relative difference of the blurring distance between the moving detector and the stationary detector. A negative relative difference means that the moving detector reduces the blurring distance.
The first rows of Figure 13 and Figure 14 show the distribution of the blurring distance with a stationary detector. The second rows show the distribution with a moving detector. The third rows show their relative difference calculated by subtracting the first rows from the second rows (moving detector – stationary detector) and dividing the results by the maximum blurring distance with the stationary detector. A negative value in the third rows therefore indicates that the moving detector reduces the blurring distance. The same color bar settings were used in Figure 13 and Figure 14.
Figure 13 shows the distribution of the blurring distance for the central projection angle. As expected, the distribution is symmetric about y = 0 for both detectors on both y-z planes. For the stationary detector, the distribution of the blurring distance does not depend on the x- or y-coordinate because the 1-D line source blur is parallel to the detector plane for the stationary detector at the central projection angle. The blurring distance increases when the location is farther away from the detector plane, reaching a maximum value of 0.28 mm at z = −125 mm, which corresponds to the top of a 10-cm-thick breast. This is expected considering that the geometric unsharpness increases as the object-to-detector distance increases. For a moving detector, for the x = 0 plane at the chest wall, the blurring distance reduces by 0% to 29.3% compared with the stationary detector. The average relative reduction of the blurring distance is 8.4%.
As shown in the second row of Figure 13, the blurring distance is not negligible even with the moving detector, especially for the top slices. The maximum blurring distance is 0.28 mm at y = 0, z = −125 mm, which is the same as that for the stationary detector. The blurring distance also increases for the planes farther away from the chest wall. At x = 200 mm, the blurring distance of the moving detector can exceed that of the stationary detector in the bottom slices, as indicated by a positive relative difference. On average, the moving detector reduces the blurring distance by 3.2%.
Figure 14 shows the comparison for projection angle θ = 7.5° (the maximum projection angle of the Hologic DBT system). For the x = 0 plane, the moving detector can reduce the blurring distance by as much as 52.0%, as observed in the upper-left corner in the third row of Figure 14(a). The average relative reduction of the blurring distance is 9.1%. The maximum blurring distance with the moving detector is 0.29 mm, which is slightly larger than that at the central projection angle. For the x = 200 mm plane, the blurring distance of the moving detector is larger than that of the stationary detector on the right half of the plane, as shown in the third row of Figure 14(b). The average reduction of the blurring distance is 4.1%, mainly contributed by the left half of the plane. As a result, at this projection angle, the moving detector reduces the source blur more than that at the central projection angle, but the variation of the source blur over the imaged volume is large and asymmetric.
Figure 15 compares the moving detector and the stationary detector in an x-y plane at z = −105 mm, which is 80 mm from the bottom of the imaged volume. At the central projection angle shown in Figure 15(a), the distribution of the blurring distance for the stationary detector is uniform. This is because the equivalent finite-sized source is 1-D and is parallel to the detector, as explained above for first row of Figure 13. On the other hand, the blurring distance is non-uniform with the moving detector, decreasing from the center to the two sides of the FOV. The average reduction of blurring distance is 9.2%. At a projection angle of 7.5°, the average reduction is 11.4%, but the blurring distance actually increases locally by more than 5% in the lower-right corner in Figure 15(f).
Figure 15.
Contour plots illustrating the spatial dependence of the blurring distance in an x-y plane (z = −105 mm) for: (a)–(c): projection angle θ = 0°; (d)-(f): projection angle θ = 7.5°. (a) does not show contours since it is uniform with a blurring distance = 0.229 mm.
In summary, these calculations indicate that the additional source blur caused by the motion of the x-ray tube during data acquisition cannot be neglected even when using a detector moving in synchrony with the source. It is likely that the general trends observed in our analysis of spatial resolution with the CatSim simulation (Section 3.2) using the stationary detector also apply to a moving detector, although this conjecture needs to be confirmed in a future study.
4. Discussion
4.1. Summary of the Influence of Source Blur
Our simulation results indicate that for a stationary source of a typical focal spot size (~0.3 mm), treating the finite-sized source as a point source has negligible effect on the reconstructed image resolution in both the directions parallel and perpendicular to the source motion direction as shown by the horizontal and vertical line pairs and BBs. If the source is not stationary such that the effective size of the source blur (h2) increases to about 1 mm (Source 2), the spatial resolution in the direction parallel to the source motion (the relative contrast of horizontal line pairs) and BBs will degrade noticeably. If the effective size of the source blur is 2 mm (Source 3), the contrast of horizontal line pairs and BBs will decrease substantially and the degradation increases from the chest wall to the anterior of the FOV. How much source blur is tolerable depends on the specific imaging task and other factors in the imaging and reconstruction processes.
Although we estimated the potential source blur of the commercial DBT systems (Tables A1–A4) based on the published system parameters, typical exposure techniques, and simple constant motion of the x-ray source, we did not investigate the many possible combinations of parameters for the various systems. For example, the number of PVs, acquisition angle, detector pixel size, reconstruction voxel size and reconstruction algorithm etc. differ among systems. The Hologic system uses a moving detector (non-stationary) and the Fujifilm system uses a detector with hexagonal elements, which are very different from our CatSim simulation. The design of a DBT system involves many factors besides minimizing the source blur. In addition, we did not include other image quality degrading factors such as detector blur, noise or scattered radiation, making it more difficult to predict the relative influence of source blur on the reconstructed image quality and the overall benefit of modeling the source blur in image reconstruction in practice for a specific system. Nevertheless, we will make some general discussion based on our simulation results as a reference that might be helpful for other researchers and DBT manufacturers.
For DBT systems that use a step-and-shoot scanning mode such as the GE SenoClaire or Pristina DBT system, our simulation shows that treating a finite-sized source as a point source causes minimal loss in resolution if the focal spot size is about 0.3 mm, the detector has a pixel size of 0.1 mm and the reconstructed voxel size is 0.1×0.1×1 mm3. Neglecting the source blur may not affect the reconstructed image quality. The benefit of modeling the source blur in reconstruction for this type of systems appears to be limited.
For narrow-angle DBT systems that use a continuous-motion scanning x-ray source with a moving detector such as the Hologic Selenia Dimensions system, our simulation shows that the source motion blur is substantial and the moving detector does not greatly reduce the source blur, especially if small pixel size such as 0.07 mm is used. If the detector pixel size is binned to 0.14 mm in the reconstructed DBT1, the relative impact of the source motion blur is reduced. According to our estimates in Table A2, the effective h2 is about 1.3 mm for 6-cm-thick breasts and 1.6 mm for 8-cm-thick breasts. If we consider the size of the source blur relative to the pixel size, a source blur of 1.3 mm is comparable to a source blur of about 0.8 mm and 1.6 mm is about 1 mm (Source 2) in our simulation that uses a pixel size of 0.1 mm. The source blur is therefore not negligible in DBT for slightly above-average to thick breasts and modeling the source blur in reconstruction may be beneficial. The experimental study by Qian et al.24 supports our conclusion, where replacing the rotating x-ray tube in the Hologic Selenia Dimensions DBT system with a stationary carbon nanotube x-ray source array demonstrates increased system spatial resolution.
For wide-angle DBT systems with a continuous-motion scanning x-ray source and a stationary detector, the impact of motion source blur is strong unless the source moves at a relatively slow speed such as the Siemens Mammomat Inspiration system. According to our estimates in Table A3, the effective h2 is 1.2 mm for thick breasts (thickness ~ 10 cm). The pixel size is 0.085 mm for this system1. For a 10-cm-thick breast, an effective h2 of 1.2 mm is between Source 2 and Source 3 in our simulation. For a 5-cm-thick breast, the effective h2 is 0.8 mm, which is comparable to Source 2. Our simulation shows that the source motion noticeably degrades image quality for average to thick breasts. Modeling the source blur may improve the image quality. Modeling the source blur may also allow the system to scan with faster motion of the x-ray source, which would decrease the potential motion blur of the breast and improve the comfort of DBT imaging.
For narrow-angle DBT systems with continuous x-ray source motion and a stationary detector the source motion blur can be substantial, especially when the detector is stationary and the pixel size is small such as the Fujifilm Aspire Cristalle system. This system has a detector with hexagonal pixels with a side length of 0.05 mm25, 26, which is equivalent by pixel area to a square pixel of 0.08 mm. If we simply assume a square pixel of 0.08 mm for the system, then the effective h2 = 1.6 mm for thick breasts (thickness ~ 9 cm) is comparable to Source 3 in our simulation and could result in substantial degradation in spatial resolution. Modeling the source blur in reconstruction may therefore improve the image quality. In general, reducing the scan speed or reducing the x-ray pulse width will alleviate the problem of source motion blur but it depends on other system design considerations. Furthermore, increasing the total scan time also increases the possibility of motion blur of the breast.
In summary, our simulation results indicate that the step-and-shoot approach may suffice to preserve the resolution of objects despite the finite size of the focal spot in typical DBT systems. The continuous motion approach will be the main contributor to the source blur and may cause different levels of image quality degradation depending on the thickness of the breast and other parameters of the DBT system. The latter type of DBT systems may benefit from modeling source blur in reconstruction but the specific gain in image quality should be studied by considering other system design and imaging factors that may also affect image quality.
4.2. Limitations of the study
This study compared the relative effects of source blur on the spatial resolution of DBT under the same image acquisition and reconstruction conditions. There are several limitations. First, we used only SART with 21 projections in reconstruction. It may be of interest to study DBT systems with different geometries and reconstructions by other algorithms to evaluate how source blur depends on these parameters. Second, we simulated a fixed detector and reconstruction pixel size. Since the pixel size and the reconstruction projector have strong impacts on the reconstructed image resolution19, 20, it will be useful to study how the effect of source blur may interact with these factors. Third, our simulation neglected quantum noise, readout noise, detector blur, scattered radiation and other factors. A comparison between the ideal point source and a finite-sized source taking into account these factors will better gauge the significance of modeling source blur in DBT reconstruction. DBT image quality involves a large number of factors in the imaging chain and reconstruction process but we can only explore a small part of the parameter space in one study. Despite the limitations, we believe that the simulation results improve our understanding and provide some meaningful information on the effects of source blur in DBT reconstruction.
5. Conclusion
This paper used analytical calculations and CatSim simulations to study the effect of the source blur on the spatial resolution of DBT reconstructions. Our analytical calculations demonstrated that the PSF of source blur is highly shift-variant. The shape of the PSF of the source blur also strongly depends on the spatial location over the image plane, making it challenging to be implemented precisely in a system model. We used CatSim to simulate phantoms containing line pairs and BBs at different locations with sources of four different sizes. The reconstructed results of the simulated phantoms demonstrate that a typical finite-sized focal spot (~ 0.3 mm) will not have a substantial impact on the image quality if the x-ray tube is stationary during data acquisition. If the x-ray tube is moving, the extra source blur due to the motion may degrade image resolution, depending on the effective size of the source along the direction of the motion. Our simulation results suggest that there are potential benefits of modeling the source blur in image reconstruction for DBT systems using continuous-motion acquisition mode.
Acknowledgement
This work is supported by National Institutes of Health awards R01 CA214981 and R01 CA151443. The authors are grateful to GE Global Research for sharing the CatSim simulation tools.
Appendix A. Geometry, scanning parameters and typical exposure techniques for three commercial DBT systems
Table A1.
Geometry and scanning parameters of three commercial DBT system using continuous-motion scanning mode.
| Hologic Selenia Dimensions | Siemens Mammomat Inspiration | Fujifilm Aspire Cristalle | |
|---|---|---|---|
| Ref.1, 2, 27 | Ref.1, 3 | Ref.25, 26, 28 | |
| Pixel size | 0.07 mm (detector) 0.14 mm (2×2 binning) |
0.085 mm | 0.05 mm (hexagonal), ~ 0.08 mm (square) |
| Number of projections | 15 | 25 | 15 |
| Distance from source to the rotation center (mm) | 700 | 608 | 650 |
| Acquisition angle (degree) | 15 | 50 | 15 |
| Total acquisition time (s) | 3.7 | 25 | 4.0 |
| Total motion of the source (mm) | 183 | 530.6 | 170 |
| Speed of the source (mm/s) | 49.5 | 21.2 | 42.5 |
| Nominal focal spot size (mm) | 0.3 | 0.3 | 0.3 |
Table A2.
Estimation of the source blur h2 for Hologic Selenia Dimensions system. We used the maximum current of the x-ray tube in the vendor’s user guide2 as the current for each thickness of the breast, ignoring the possible dependence of the current on kV setting. The Hologic system bins 2 × 2 pixels during the image reconstruction. Therefore, the pixel size is 0.14 mm for this system.
| Breast Thickness (mm) | Kilovoltage (kV) | Total Current-Time Product (mAs) | Current (mA) | Total Exposure Time (s) | Exposure Time per PV (s) | Source Motion of one PV (mm) | Source Blur h2 (mm) |
|---|---|---|---|---|---|---|---|
| 20 | 26 | 32 | 200 | 0.160 | 0.011 | 0.5 | 0.8 |
| 40 | 29 | 43 | 200 | 0.215 | 0.014 | 0.7 | 1.0 |
| 60 | 33 | 60 | 200 | 0.300 | 0.020 | 1.0 | 1.3 |
| 80 | 38 | 81 | 200 | 0.405 | 0.027 | 1.3 | 1.6 |
Table A3.
Estimation of source blur h2 for Siemens Mammomat Inspiration system. The current cannot be found in the technical documents and is therefore estimated with the voltage and the fixed power output of the x-ray tube, which is 5 kW according to the vendor’s information3.
| Breast Thickness (mm) | Kilovoltage (kV) | Total Current-Time Product (mAs) | Current (mA) | Total Exposure Time (s) | Exposure Time per PV (s) | Source Motion of one PV (mm) | Source Blur h2 (mm) |
|---|---|---|---|---|---|---|---|
| 20 | 25 | 50 | 200 | 0.250 | 0.010 | 0.2 | 0.5 |
| 30 | 26 | 70 | 192 | 0.364 | 0.015 | 0.3 | 0.6 |
| 40 | 26 | 90 | 192 | 0.468 | 0.019 | 0.4 | 0.7 |
| 50 | 27 | 110 | 185 | 0.594 | 0.024 | 0.5 | 0.8 |
| 60 | 28 | 120 | 179 | 0.672 | 0.027 | 0.6 | 0.9 |
| 70 | 29 | 130 | 172 | 0.754 | 0.030 | 0.6 | 0.9 |
| 80 | 30 | 140 | 167 | 0.840 | 0.034 | 0.7 | 1.0 |
| 90 | 30 | 160 | 167 | 0.960 | 0.038 | 0.8 | 1.1 |
| 100 | 31 | 180 | 161 | 1.116 | 0.045 | 0.9 | 1.2 |
Table A4.
Estimation of source blur h2 for the Fujifilm Aspire Cristalle system. The current cannot be found in the technical documents and is therefore estimated with the kilovoltage and the fixed power output of the x-ray tube, which is 4.9 kW according to the x-ray tube vendor’s information29. The breast thickness is converted from the PMMA phantom used in the Fujifilm quality control manual by interpolating curve of the equivalent breast thickness to the PMMA phantom thickness28. The digital detector uses an array of hexagonal pixels of a side width of 0.05mm. The area of a hexagonal pixel is the same as a square pixel of 0.08 mm, so we estimate the equivalent pixel size to be 0.08 mm.
| Breast Thickness (mm) | Kilovoltage (kV) | Total Current-Time Product (mAs) | Current (mA) | Total Exposure Time (s) | Exposure Time per PV (s) | Source Motion of one PV (mm) | Source Blur h2 (mm) |
|---|---|---|---|---|---|---|---|
| 21.0 | 26 | 36 | 188 | 0.191 | 0.013 | 0.5 | 0.8 |
| 33.0 | 28 | 32 | 175 | 0.183 | 0.012 | 0.5 | 0.8 |
| 45.0 | 30 | 40 | 163 | 0.245 | 0.016 | 0.7 | 1.0 |
| 52.5 | 32 | 40 | 153 | 0.261 | 0.017 | 0.7 | 1.0 |
| 60.0 | 33 | 42 | 148 | 0.283 | 0.019 | 0.8 | 1.1 |
| 75.0 | 36 | 50 | 136 | 0.367 | 0.024 | 1.0 | 1.3 |
| 90.0 | 37 | 63 | 132 | 0.476 | 0.032 | 1.3 | 1.6 |
Appendix B. Analytical Calculation of Source Blur PSF
With the simplified source blur model described in Section 2.1, the projection of the rectangular source through a pinhole can be analytically calculated on the detector plane. We first introduce the following lemma:
Lemma 1:
The projection of a straight line segment l1 on a plane P through a point O is contained in a straight line.
Proof:
Let A denote an arbitrary point on l1. The projection of A on the plane P through O is contained in the plane determined by l1 and O. Let Q denote this plane. Obviously the projection of A on P is contained in P. Because the intersection of P and Q is a straight line and A is an arbitrary point on l1, the projections of all the points on l1 are contained in the same straight line.
Because of Lemma 1, the projection of a rectangular source on a plane through a pinhole can be obtained by calculating the projections of only the four corners. We simply need to connect the projections of the four corners to get the shape of the PSF of the source blur.
We derive the locations of the four corners of the rectangular focal spot and their projections. The finite-sized focal spot shown in Figure 1 is enlarged in Figure 16 to illustrate the locations of its corners. Let dSO denote the distance from the center of the source (denoted as S) to the rotation center (denoted as O) and dOP denote the distance from the rotation center to the origin of the detector (denoted as P). The center of the source (S) is located at:
| (5) |
The locations of the four corners (A, B, C and D in Figure 16) of the rectangular source are:
| (6) |
where and are vectors of lengths and along the h1 and h2 directions in Figure 1, shown as red arrows in Figure 16.
Figure 16.
Derivation of the vectors along the edges of the rectangular source ( and ). The blue rectangle shows the location of the digital detector.
The expressions of and are derived based on solid geometry. We have: and are are along the directions of and . They are perpendicular to each other and their lengths are and . If we can derive the direction vectors of and , denoted as and and can be obtained by multiplying these direction vectors with and .
We first derive is parallel to the y-z plane and perpendicular to . The direction vectors of the y-z plane and are:
| (7) |
| (8) |
Therefore can be obtained by calculating their cross product:
| (9) |
Next we derive is perpendicular to . We also know that the angle between and is ϕ. Therefore we have the follow equations:
| (10) |
| (11) |
| (12) |
where Eq. (12) is the constraint for the length of the direction vector. is the opposite direction of , where is known as shown in Eq. (8). is shown in Eq. (9). Therefore, by solving Eq. (10) – (12), we have:
| (13) |
Multiplying and with and leads to the expressions of and in Eq. (14):
| (14) |
Using solid geometry, the projection of an arbitrary location on the detector plane is:
| (15) |
where the operator · denotes inner product, is the known location of the pinhole and the two vectors that describe the detector plane are:
| (16) |
| (17) |
With Eq. (5), (6) and (14) – (17), we can analytically calculate the PSF of the source blur given the location of the pinhole .
References
- 1.Sechopoulos I, “A review of breast tomosynthesis. Part I. The image acquisition process,” Medical Physics 40, 014301 (2013). [DOI] [PMC free article] [PubMed] [Google Scholar]
- 2.Hologic Selenia Dimensions User Guide MAN 04197 Revision 0002.
- 3.Siemens AG, “MAMMOMAT Inspiration Tomosynthesis Option,”
- 4.Healthcare GE, “Senographe Pristina Qualtiy Control Manual 5762778–8EN Revision 3,” (2016).
- 5.Hu Y-H, Zhao B, and Zhao W, “Image artifacts in digital breast tomosynthesis: Investigation of the effects of system geometry and reconstruction parameters using a linear system approach,” Medical Physics 35, 5242–5252 (2008). [DOI] [PMC free article] [PubMed] [Google Scholar]
- 6.Peng R, Zeng R, O’Bryan E, Marini-Bettolo C, Sahiner B, Myers KJ, and Jennings RJ, “An Experimental Comparison of Continuous Motion and Step-and-Shoot Modes in Digital Breast Tomosynthesis,” Breast Imaging. IWDM 2012. Lecture Notes in Computer Science 7361, 650–657 (2012). [Google Scholar]
- 7.Shaheen E, Marshall N, and Bosmans H, “Investigation of the effect of tube motion in breast tomosynthesis: continuous or step and shoot?,” Proc SPIE 7961, 79611E (2011). [Google Scholar]
- 8.Ghani MU, Wu D, Wong MD, Ren L, Zheng B, Yang K, Wu X, and Liu H, “Quantitative comparison of spatial resolution in step-and-shoot and continuous motion digital breast tomosynthesis,” Proc SPIE 9783, 97836D (2016). [Google Scholar]
- 9.Michielsen K, Van Slambrouck K, Jerebko A, and Nuyts J, “Patchwork reconstruction with resolution modeling for digital breast tomosynthesis,” Medical Physics 40, 031105 (2013). [DOI] [PubMed] [Google Scholar]
- 10.Hofmann C, Knaup M, and Kachelriess M, “Effects of ray profile modeling on resolution recovery in clinical CT,” Medical Physics 41, 021907 (2014). [DOI] [PubMed] [Google Scholar]
- 11.De Man B, Pack J, FitzGerald P, and Wu M, CatSim Manual Version 6 .0, (GE Global Research, 2015). [Google Scholar]
- 12.Tilley S, Siewerdsen JH, and Stayman JW, “Model-based iterative reconstruction for flat-panel cone-beam CT with focal spot blur, detector blur, and correlated noise,” Physics in Medicine and Biology 61, 296–319 (2016). [DOI] [PMC free article] [PubMed] [Google Scholar]
- 13.Tilley S, Jacobson M, Cao Q, Brehler M, Sisniega A, Zbijewski W, and Stayman JW, “Penalized-Likelihood Reconstruction with High-Fidelity Measurement Models for High-Resolution Cone-Beam Imaging,” IEEE Transactions on Medical Imaging 37, 988–999 (2017). [DOI] [PMC free article] [PubMed] [Google Scholar]
- 14.De Man B, Basu S, Chandra N, Dunham B, Edic P, Iatrou M, McOlash S, Sainath P, Shaughnessy C, Tower B, and Williams E, “Catsim : a new computer assisted tomography simulation environment,” Proc. SPIE 6510, 65102G (2007). [Google Scholar]
- 15.Robinson A and Grimshaw GM, “Measurement of the focal spot size of diagnostic x-ray tubes--a comparison of pinhole and resolution methods,” Br J Radiol 48, 572–580 (1975). [DOI] [PubMed] [Google Scholar]
- 16.Nielsen B, “Measurement of the focal spot size of diagnostic X-ray tubes by the pinhole camera technique. The influence of the pinhole on the measured focal spot size,” Health Phys 38, 683–686 (1980). [PubMed] [Google Scholar]
- 17.Zhang Y, Chan H-P, Sahiner B, Wei J, Goodsitt MM, Hadjiiski LM, Ge J, and Zhou C, “A comparative study of limited-angle cone-beam reconstruction methods for breast tomosynthesis,” Medical Physics 33, 3781–3795 (2006). [DOI] [PMC free article] [PubMed] [Google Scholar]
- 18.Lu Y, Chan HP, Wei J, and Hadjiiski LM, “A diffusion-based truncated projection artifact reduction method for iterative digital breast tomosynthesis reconstruction,” Physics in Medicine and Biology 58, 569–587 (2013). [DOI] [PMC free article] [PubMed] [Google Scholar]
- 19.Zheng J, Fessler JA, and Chan HP, “Segmented separable footprint projector for digital breast tomosynthesis and its application for subpixel reconstruction,” Medical Physics 44, 986–1001 (2017). [DOI] [PMC free article] [PubMed] [Google Scholar]
- 20.Zheng J, Fessler JA, and Chan HP, “Detector Blur and Correlated Noise Modeling for Digital Breast Tomosynthesis Reconstruction,” IEEE Trans Med Imaging (2017). [DOI] [PMC free article] [PubMed] [Google Scholar]
- 21.Acciavatti RJ and Maidment ADA, “Observation of super-resolution in digital breast tomosynthesis,” Medical Physics 39, 7518–7539 (2012). [DOI] [PMC free article] [PubMed] [Google Scholar]
- 22.Carvalho PM, “Low-Dose 3D Quantitative Vascular X-ray Imaging of the Breast,” Ph.D. Dissertation, University of Paris-Sud; (2014) [Google Scholar]
- 23.ICRU, International Commission on Radiation Units and Measurements (ICRU).Medical Imaging - The Assessment of Image Quality, Report 54 Bethesda, MD, 1996). [Google Scholar]
- 24.Qian X, Tucker A, Gidcumb E, Shan J, Yang G, Calderon-Colon X, Sultana S, Lu JP, Zhou O, Spronk D, Sprenger F, Zhang YH, Kennedy D, Farbizio T, and Jing ZX, “High resolution stationary digital breast tomosynthesis using distributed carbon nanotube x-ray source array,” Medical Physics 39, 2090–2099 (2012). [DOI] [PMC free article] [PubMed] [Google Scholar]
- 25.Fujifilm Corporation, “FUJIFILM Medial Systems Product Profiles,”
- 26.U.S. Food and Drug Administration, “Summary of Safety and Effectiveness for Aspire Crstalle DBT Option,”
- 27.Baker JA and Lo JY, “Breast Tomosynthesis: State-of-the-Art and Review of the Literature,” Academic Radiology 18, 1298–1310 (2011). [DOI] [PubMed] [Google Scholar]
- 28.Fujifilm Corporation, “ASPIRE Cristalle Quality Control Program Manual (2nd Edition),” [Google Scholar]
- 29.Varian Medical Systems, “Product Details of Varian M-113 Rotating Anode X-ray Tube,”


