

Abstract
OBJECTIVES
We aimed to study the ability of automated myocardial perfusion imaging analysis in comparison to visual analysis in major adverse cardiac events (MACE) prediction.
BACKGROUND
Quantitative analysis has not been compared to clinical visual analysis in prognostic studies.
METHODS
From the multi-center REgistry of Fast Myocardial Perfusion Imaging with NExt generation SPECT (REFINE SPECT), 19,495 patients (64±12 years, 56% male) undergoing stress Tc-99m SPECT-MPI were followed for 4.5±1.7 years for MACE. Perfusion abnormalities were assessed visually and categorized as normal, probably normal, equivocal, and abnormal. Stress total perfusion deficit (TPD), quantified automatically was categorized as TPD=0%, 0%<TPD<1%, 1%≤TPD<3%, 3%≤TPD<5%, 5%≤TPD≤10%, and TPD>10%. MACE consisted of death, nonfatal myocardial infarction, unstable angina, or late revascularization (>90days). Kaplan-Meier and Cox proportional hazards analyses were performed to test the performance of visual and quantitative assessment in predicting MACE.
RESULTS
During the follow-up, 2,760 MACE occurred (14.2%). MACE rates increased with worsening of visual assessment: normal (2.0%), probably normal (3.2%), equivocal (4.2%), and abnormal (7.4%) (all p<0.001). MACE rates increased with increasing stress TPD from 1.3% (TPD=0%) to 7.8% (TPD>10%) (p<0.0001). Adjusted hazard ratio (HR) for MACE increased even in equivocal assessment (HR1.56 95% confidence interval (CI) [1.37, 1.78] and 3%≤TPD<5% (HR1.74 95%CI [1.41, 2.14]) (all p<0.001). MACE in patients with normal visual assessment still increased from 1.3% (TPD=0%) to 3.4% (TPD≥5%) (p<0.0001).
CONCLUSIONS
Quantitative analysis allows precise granular risk stratification in comparison to visual reading, even for cases with normal clinical reading.
Keywords: Quantification, myocardial perfusion imaging, major adverse cardiac event, prognosis
CONDENSED ABSTRACT
In a multicenter study of 19,495 patients with myocardial perfusion imaging, major adverse cardiovascular events (MACE) rates increased progressively with increasing of stress total perfusion deficit on a fine granular scale over long-term follow-up in both unadjusted and adjusted multivariable analyses. Quantitative analysis further stratified risk in patients with normal visual perfusion assessment. Automated quantitative analysis of myocardial perfusion imaging is a valuable independent marker of MACE, providing objective information to the physicians in addition to the overall visual findings.
INTRODUCTION
Single photon emission computed tomography (SPECT) myocardial perfusion imaging (MPI) has been widely used as a noninvasive cardiac imaging modality to evaluate coronary artery disease (CAD) with over 6.4 million studies performed each year in the US (1) and 15–20 million worldwide (2). Previous studies have shown the prognostic value of visual perfusion abnormalities defined by expert readers on SPECT-MPI for mortality or cardiac events in single (3–10) or multi-center studies (11,12). Automated quantitative analysis provides an independent and objective evaluation of MPI on a continuous scale and can grade perfusion defects below abnormality threshold. To date, however, the value of quantitative analysis of MPI has not been compared to visual reading in prediction of patient outcomes.
Our primary objective of this study was to evaluate the prognostic value of quantitative analysis including images with subtle defects (with findings below standard visual or quantitative abnormality thresholds) using the multi-center NIH sponsored REgistry of Fast Myocardial Perfusion Imaging with NExt generation SPECT (REFINE SPECT) (13)–a large registry with recent MPI image data from the latest generation of SPECT scanners. The secondary objective was to compare quantitative analysis to clinical on-site visual reporting in all population and patients without known CAD.
METHODS
Study Population
The studied dataset was collected under the REFINE SPECT registry, which includes 20,418 consecutive patients referred for clinically indicated exercise or pharmacologic stress MPI using high-efficiency cameras at five sites (US and international) from 2009 to 2014 (13). All patients with available clinical reports were accepted in the registry. Histories of prior myocardial infarction, percutaneous coronary intervention (PCI), coronary bypass grafting (CABG), cardiac transplantation, non-coronary heart surgery and transcatheter aortic valve replacement were verified by cardiologists at each site based on symptoms, ECG changes, cardiac biomarkers, imaging modalities such as echocardiography, stress test, computed tomography angiography and invasive angiography on medical records including office visits, ER visits, hospital admission and discharge. All provided data including clinical information, stress test, and SPECT image data was checked for errors by experienced nuclear cardiologists at Cedars-Sinai Medical Center. After excluding patients with early revascularization (≤ 90 days of MPI) (n=696), without gated SPECT data (n=23) or with lack of visual perfusion assessment (n=4), with missing outcome interval (n=4), with prior cardiac transplantation (n=96), with prior other non-coronary heart surgery (n=98), and with prior transcatheter aortic valve replacement (n=46), 19,495 patients were included in the analysis. Sub-analysis was performed in subgroups of patients with suspected CAD (n=14,192). Suspected CAD was defined as having no history of prior myocardial infarction, percutaneous coronary intervention (PCI), or coronary bypass grafting (CABG). The study was approved by the institutional review boards at each participating institution as well as at the core laboratory at Cedars-Sinai Medical Center.
Stress and Acquisition Protocols
SPECT-MPI was performed using Tc-99m sestamibi or Tc-99m tetrofosmin on scanners with solid-state detectors: D-SPECT scanners (Spectrum-Dynamics, Haifa, Israel) (14) or Discovery NM 530c scanners (GE Healthcare, Haifa, Israel) (15). Imaging times were 4–6 minutes for both scanners (13). One day rest-stress, stress-rest, stress-only or two day-stress-rest protocols were performed according to site-specific protocols. Patients underwent symptom-limited standard exercise treadmill testing or pharmacologic stress (16).
Visual Analysis
Visual perfusion abnormality for SPECT imaging at stress (short axis, horizontal long axis and vertical long axis) was assessed as part of the clinical reporting by experienced board-certified nuclear cardiologists at each site with knowledge of all available data, including gated functional data and all clinical information according to routine local protocols. Quantitative perfusion and functional results at stress and rest on available positions (obtained with site-specific quantification software) were integrated for the final visual determination for the clinical report. The clinical reading scores were provided by overall visual assessment as normal, probably normal, equivocal, or abnormal in sites that did not use segmental scoring (13). For sites using the 17-segment model (16,17) (n=13,553), the summed stress score (SSS) was grouped as normal (SSS=0), probably normal (SSS=1), equivocal (SSS=2–3), or abnormal (SSS≥4) (9).
Automated Quantification
All image datasets were de-identified and transferred to Cedars-Sinai Medical Center, where quality control was performed by experienced core laboratory technologists without the knowledge of the clinical data. Automatically generated myocardial contours by Quantitative Perfusion SPECT (QPS)/ Quantitative Gated SPECT (QGS) software (Cedars-Sinai Medical Center, Los Angeles, CA) were evaluated, and when necessary, contours were adjusted to correspond to the myocardium by an experienced core laboratory technologist (13). Stress and rest images were analyzed as previously described using total perfusion deficit (TPD)(18,19). TPD was derived from upright position for D-SPECT scanners and from supine position for Discovery NM 530c scanners since these positions were recommended defaults for these scanners. Ischemic TPD was defined as a difference of TPD at stress and rest. Ejection fraction (EF) at stress was derived by standard QGS software.
Outcomes
The first endpoint was MACE, which consisted of all-cause mortality, nonfatal myocardial infarction, unstable angina, or late coronary revascularization (PCI or CABG) (13). The second endpoint was defined as hard events including all-cause mortality and nonfatal myocardial infarction. All-cause mortality was determined from the Social Security Death Index for the US sites, the Ministry of Health National Death Database for Israel, and chart review including hospital and medical doctor’s office (through the OACIS Clinical Information System) for Canada. All information related to myocardial infarction, unstable angina, and late revascularization including symptoms, ECG changes, cardiac biomarkers, and imaging modalities such as echocardiography, stress test, computed tomography angiography and invasive angiography was collected by direct patient interview, telephone contact, or review of medical record. Cardiologists at each participating center verified these events based on all above available information. The first event which occurred among the above components of MACE, or separately as the first hard event, was considered as the main event for this analysis.
Statistical Analysis
Categorical variables are presented as frequencies and continuous variables as mean ± SD or median and interquartile ranges. Variables were compared using a χ2 statistic for categorical variables and a Wilcoxon rank sum test for continuous variables.
Rates of events were calculated using a Kaplan-Meier analysis for both stratification by visual assessment and TPD in the overall population and in subgroups of suspected CAD. Log-rank test was used to assess any differences in event risk with the worsening of visual perfusion or quantitative perfusion assessment among the classified groups. We considered integer values for TPD analysis. Stress TPD≥5% has been previously established as the threshold for diagnostic abnormality (18,19). SSS≥4 was considered equivalent to TPD≥5% since it is used as an abnormal threshold during clinical reading (10). The visual score SSS<1 (or SSS=0) was considered as an approximate equivalent to TPD<1%. Since the integer TPD for SSS=1 is calculated to be approximately SSS/68×100=1.47%, the closest integer value is 1%. The 3% threshold was used as a median between 1% and 5% and approximately corresponds to SSS=2–3 (equivocal) (9). The threshold of 10% abnormal myocardium was used as it has been used as a standard threshold of previously in prognostic analysis (20) with SSS ≥ 7 approximately equivalent for visual scoring. In addition, TPD=0.0% (no defects at all no matter how small) was added as the special category which could be considered “super normal”. Although integer TPD values are shown in the visual interface, continuous TPD values (floating point numbers) are exported by the software for the study analysis. The software reports the global TPD from all the pixels on the polar maps (approximately 1000 pixels) and not from the 17 segmental scores which allows to report continuous TPD values between 0.0 % and 1.0 %. Subsequently, for the Kaplan-Meier and annual event rates, stress TPD was categorized to 6 groups (TPD=0, 0<TPD<1, 1≤TPD<3, 3≤TPD<5, 5≤TPD≤10, TPD>10), while SSS was categorized to 5 groups (0, 1, 2–3, 4–6, 7–68). First, an univariable Cox proportional hazards analysis was performed to assess the association of visual and quantitative perfusion assessment with MACE. Next, two different multivariable Cox proportional hazards analyses considering age, gender, BMI≥30kg/m2, CAD risk factors (hypertension, diabetes mellitus, dyslipidemia, family history of CAD, and currently smoking), typical angina, peripheral artery disease, prior CAD, and stress EF<45% were performed in all patients and patients with suspected CAD to determine the relation between perfusion stratification (Model 1: stratifications of visual perfusion assessment, and Model 2: stress TPD stratification) and MACE. Multivariable analysis in patients with suspected CAD was adjusted for the same cofounders (except prior CAD) as in all patients. A hazard ratio (HR) and 95% confidence interval (CI) were calculated from the Cox models. The assumption of proportional hazards was checked via Schoenfeld residuals.
For the annual event rate analyses, all patients were categorized into 16 (4×4) groups. Stress TPD was divided into 4 quantitative categories: 0%≤TPD<1%, 1%≤TPD<3%, 3%≤TPD<5%, and TPD≥5%, equivalent to the 4 visual perfusion categories (normal, probably normal, equivocal and abnormal). TPD=0% and 0%<TPD<1% were combined to match visual assessment category of normal or SSS =0, equivalent to TPD <1% (continuous variable). Similarly, the population in which SSS was provided, was also categorized into 16 (4×4) groups by 4 quantitative categories and 4 summed stress score categories. The area under the receiver operating characteristic curve (AUC) by visual assessment with clinical variables or continuous TPD with clinical variables was compared with the model combining visual assessment, TPD and clinical variables. Clinical variables included age, male gender, number of cardiovascular risk factors (hypertension, hyperlipidemia, diabetes mellitus, smoking and family history of coronary artery disease (CAD)) and prior CAD history (prior myocardial infarction, percutaneous coronary intervention and coronary artery bypass graft). For the sake of head to head comparison, visual, 4 quantitative categories and combined model were compared using pairwise AUC comparisons (21). Separate analysis was performed also using ischemic TPD (difference of stress and rest TPD) and rest TPD, in the population who had stress and rest TPD. A two-tailed P-value <0.05 was considered statistically significant. STATA version 13 was used for all analyses (Stata Corp, College Station, TX).
RESULTS
MPI Protocols
MPI protocols in the registry are shown in Table 1. D-SPECT scanners (43%) were used for three sites and Discovery NM 530c scanners (57%) were used for two sites. Most patients underwent one day rest-stress (58%) or stress-rest (27%) imaging protocol, while stress-only (14%) and two day stress-rest image protocols (1%) were performed in a smaller proportion of the patients. Symptom-limited Bruce protocol treadmill exercise testing was performed in 48% of the patients and pharmacologic stress testing was performed in the remaining 52%. Weight-adjusted injected dose is shown in Table 2. Myocardial contour correction was performed in 4.9% of the cases by the experienced core laboratory technologist.
Table 1.
Prevalence of Myocardial Perfusion Imaging Protocols, Radiotracer, Stress Type and Pharmacologic Agent in Overall Population (n=19,495)
| SPECT Protocols | |
|---|---|
| One Day-Rest-Stress | 58% |
| One Day-Stress-Rest | 27% |
| Stress-Only | 14% |
| Two Day | 1% |
| Radiotracer | |
| Tc-99m sestamibi | 83% |
| Tc-99m tetrofosmin | 17% |
| Stress Type | |
| Exercise Stress | 48% |
| Pharmacologic Stress | 52% |
| Pharmacologic Agent | |
| Dipyridamole | 57% |
| Regadenoson | 25% |
| Adenosine | 17% |
| Dobutamine | 1% |
Table 2.
Weight-adjusted Injected Dose by SPECT Protocols in Overall Population (n=19,495)
| SPECT Protocols | Weight Adjusted Stress Dose | Weight Adjusted Rest Dose |
|---|---|---|
| One Day-Rest-Stress | 933 ± 396 MBq (25 ± 11 mCi) |
256 ± 97 MBq (7 ± 3 mCi) |
| One Day-Stress-Rest | 292 ± 76 MBq (8 ± 2 mCi) |
821 ± 182 MBq (22 ± 5 mCi) |
| Stress-Only | 299 ± 186 MBq (8 ± 5 mCi) |
N/A |
| Two Day | 777 ± 413 MBq (21 ± 11 mCi) |
567 ± 519 MBq (15 ± 14 mCi) |
Values are mean ± standard deviation.
MBq: megabecquerel, mci: millicurie
Clinical Characteristics
Overall population
Patient characteristics of overall population with and without MACE are shown in Table 3. When compared to the group of patients without MACE, the MACE group was older and consisted of more males. Pharmacologic stress testing was more commonly used for patients with MACE and the incidence of ischemic ECG changes was higher in patients who had MACE than patients who did not have MACE. The patients with typical chest pain, hypertension, diabetes, and dyslipidemia were more frequent in the MACE group. Histories of peripheral artery disease and prior CAD were more common in the MACE group.
Table 3.
Patient Characteristics in Overall Population
| Overall Population | ||||
|---|---|---|---|---|
| Total | MACE | No MACE | p value | |
| Number | 19,495 | 2,760 | 16,735 | − |
| Age, years | 64(56−73) | 69(61−78) | 63(55−72) | <0.0001 |
| Male | 56% | 68% | 54% | <0.001 |
| BMI, kg/m2 | 27(25−31) | 27(24−31) | 27(25−31) | 0.10 |
| Hypertension | 63% | 75% | 61% | <0.001 |
| Diabetes | 25% | 37% | 23% | <0.001 |
| Dyslipidemia | 63% | 72% | 61% | <0.001 |
| Family History of CAD | 28% | 23% | 29% | <0.001 |
| Current Smoker | 19% | 19% | 19% | 0.44 |
| History of PAD | 12% | 18% | 11% | <0.001 |
| Typical Chest Pain | 5% | 8% | 5% | <0.001 |
| Atypical Chest Pain | 22% | 21% | 22% | 0.12 |
| Nonanginal Chest Pain | 25% | 19% | 26% | <0.001 |
| Asymptomatic | 47% | 53% | 46% | <0.001 |
| Prior CAD | 27% | 49% | 24% | <0.001 |
| Pharmacologic Stress | 52% | 69% | 49% | <0.001 |
| Exercise Stress | 48% | 31% | 51% | <0.001 |
| Ischemic ECG Change at Exercise Stress | 15% | 20% | 15% | 0.001 |
Categorical value is expressed as frequency and continuous value is expressed as median (interquartile range).
BMI = body mass index, CAD = coronary artery disease, ECG = electrocardiogram, MACE = major adverse cardiac events, PAD = peripheral artery disease
Suspected CAD population
Patients with history of CAD (n=5,303, 27%) included those who had a prior myocardial infarction (n=2,577, 13%), PCI (n=3,709, 19%), and CABG (n=1,576, 8%). Suspected CAD was defined as having no history of CAD as described above. Patient characteristics for patients with suspected CAD are shown in Supplemental Table 1. The clinical characteristics of patients with suspected CAD were similar to those of the overall population with the exception of an increased frequency of atypical chest pain in the MACE group.
Outcome events
The follow-up time of patients was 4.5±1.7 years (mean ± SD). 2,760 MACE were recorded, including 1,341 deaths, 187 myocardial infarctions, 207 unstable anginas and 1,025 late revascularizations. 1,756 hard events occurred, including 1,420 deaths and 336 nonfatal myocardial infarctions.
Kaplan-Meier Analysis
Overall Population
In the overall population, MACE risk was predicted by visual perfusion assessment. The annual MACE rates increased with each step increase of visual perfusion assessment category (p<0.0001, Figure 1). Similarly, MACE risk was predicted by stress TPD. The annual MACE rates increased with each step increase of the stress TPD category (p<0.0001, Figure 2), including several categories below diagnostic abnormality threshold. For the population in which visual segmental scoring was provided (n=13,533), MACE risk was also predicted by SSS and stress TPD. The annual MACE rates increased with increase of SSS and stress TPD categories including several categories below diagnostic abnormality threshold (p<0.0001, Figure 3).
Figure 1. Survival Curves and MACE Rates by Visual Assessment in Overall Population.
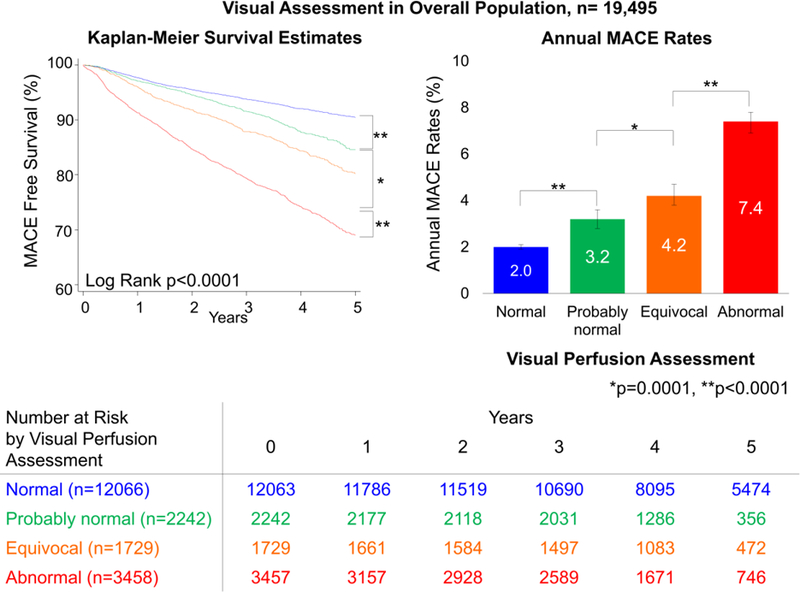
Worsening of visual perfusion assessment was associated with greater MACE risk over time in all population. Bottom chart shows number at MACE risk by visual perfusion assessment.
MACE = major adverse cardiac events.
Figure 2. Survival Curves and MACE Rates by Quantitative Assessment in Overall Population.
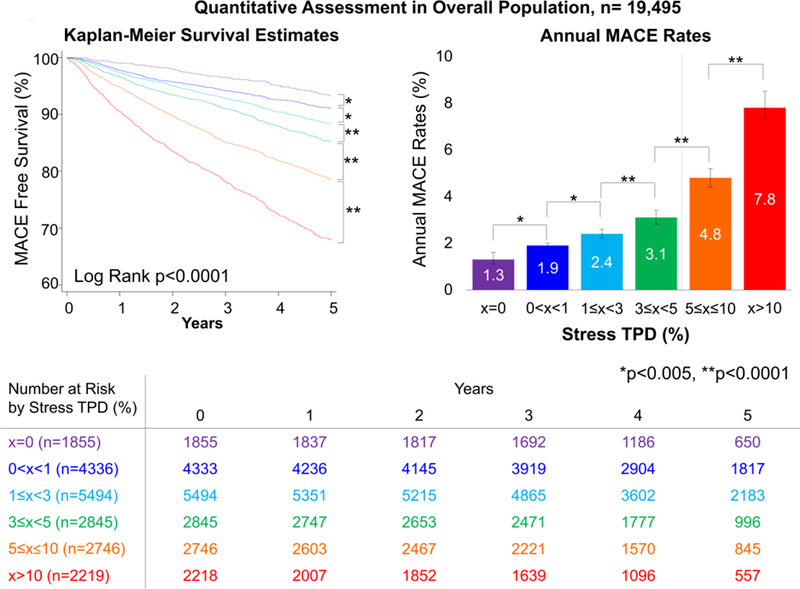
Increase of stress TPD was associated with greater MACE risk over time. Bottom chart shows number at MACE risk by quantitative perfusion assessment. Dash line on the right bar graph shows the abnormal threshold of stress TPD (5%) (18,19). MACE = major adverse cardiac events, TPD = total perfusion deficit.
Figure 3. Survival Curves and MACE Rates by Segmental Visual and Quantitative Assessment in the Subpopulation whose SSS was Provided.
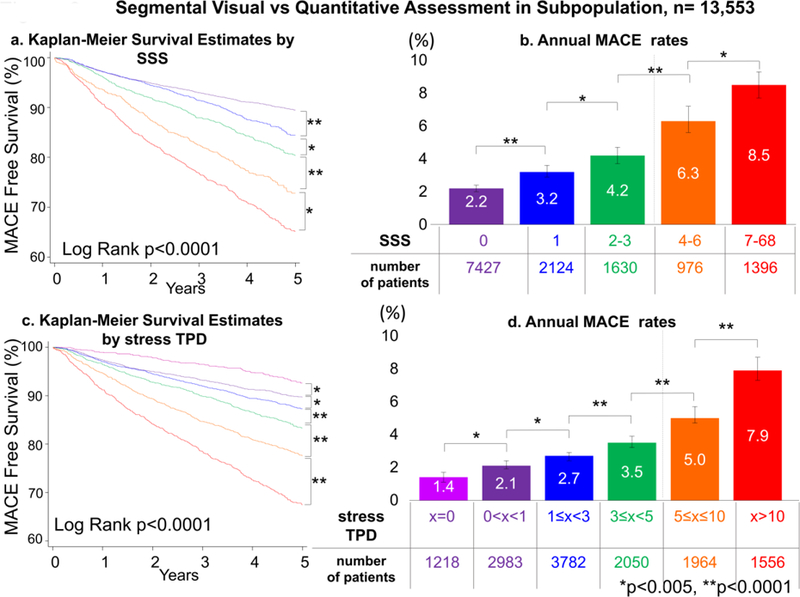
Kapan Meier survival estimates (a: SSS, b: stress TPD) and annual MACE rates (c: SSS, d: stress TPD) by SSS and stress TPD categories are shown. Increase of SSS and stress TPD was associated with greater MACE risk over time. Dash lines on the right bar graphs show the abnormal threshold of SSS ≥4 (9) and stress TPD ≥5% (18,19). MACE = major adverse cardiac events, SSS = summed stress score, TPD = total perfusion deficit.
Suspected CAD population
In patients with suspected CAD, MACE risk was predicted by visual perfusion assessment. The annual MACE rates increased with each step increase of visual perfusion assessment category (p<0.0001, Supplemental Figure 1). Similarly, MACE risk was predicted by stress TPD. The annual MACE rates increased with each step increase of the stress TPD category (p<0.0001, Supplemental Figure 2), also in several categories below diagnostic abnormality threshold.
Cox Proportional Hazards Analysis
By both unadjusted and adjusted Cox models, visual perfusion assessment demonstrated hazards ratios for MACE progressively increasing with worsening of perfusion abnormalities in overall population (Table 4) and among patients with suspected CAD (Supplemental Table 2). Similarly, in both unadjusted and adjusted Cox proportional analyses, higher rates of MACE were associated with increases of stress TPD in the overall population (Table 4) and among patients with suspected CAD (Supplemental Table 2).
Table 4.
Unadjusted and Adjusted Hazard Ratios for MACE by Visual and Quantitative Perfusion Assessment Categories in Overall Population
| Overall population (n=19,495) |
||||
|---|---|---|---|---|
| Unadjusted HR [95%CI] |
p value |
Adjusted HR* [95%CI] |
p value |
|
| Model1: Visual Perfusion Assessment | ||||
| Normal | 1.00 | Reference | 1.00 | Reference |
| probably normal | 1.56 [1.37, 1.77] |
<0.001 | 1.29 [1.13, 1.46] |
<0.001 |
| Equivocal | 2.08 [1.84, 2.36] |
<0.001 | 1.56 [1.37, 1.78] |
<0.001 |
| abnormal | 3.63 [3.34, 3.96] |
<0.001 | 1.78 [1.60, 1.98] |
<0.001 |
| Model2: Quantitative Perfusion Assessment, stress TPD (%) | ||||
| TPD=0 | 1.00 | Reference | 1.00 | Reference |
| 0<TPD<1 | 1.41 [1.15, 1.74] |
0.001 | 1.34 [1.09, 1.65] |
0.006 |
| 1≤TPD<3 | 1.80 [1.48, 2.20] |
<0.001 | 1.54 [1.26, 1.88] |
<0.001 |
| 3≤TPD<5 | 2.36 [1.92, 2.90] |
<0.001 | 1.74 [1.41, 2.14] |
<0.001 |
| 5≤TPD≤10 | 3.58 [2.93, 4.38] |
<0.001 | 2.24 [1.82, 2.75] |
<0.001 |
| TPD>10 | 5.85 [4.80, 7.13] |
<0.001 | 2.46 [1.99, 3.05] |
<0.001 |
CI = confidence interval, HR= hazards ratio, TPD = total perfusion deficit, MACE = major adverse cardiac events
Adjusted models were also devised including multivariable stepwise models adjusting for age, male, BMI≥30kg/m2, cardiac risk factors, typical angina, history of peripheral artery disease and stress EF<45%.
MACE and Hard Event Rates in Visual and Quantitative Perfusion Categories
Central Illustration shows annual MACE rates and number of patients by categories of both visual and quantitative perfusion assessment stratifications. For each level of visual abnormality, the annual MACE increased with increasing quantitative perfusion assessment, including those with normal visual assessment. In 1,062 patients with normal visual perfusion read and stress TPD ≥5% (5.4% of the overall population, 8.8% of the patients with normal read), the MACE risk was increased over 2 times as compared to those with TPD <1% (MACE risk 1.6% vs 3.4%, p<0.0001). Similarly, in patients with normal stress TPD, the MACE rates also increased with increasing visual assessment of abnormality. In 14% of 12,066 (n=1,724) scans visually read as normal who had also stress TPD=0% could be assigned significantly lower risk than that predicted by visual reading alone (MACE risk 1.3% for normal read with stress TPD=0% vs 2.0% for normal read (n=12,066), p <0.05). The annual MACE rates as a function of stress TPD and visual SSS categories are shown in Figure 4. For each level of visual abnormality, the annual MACE increased with increasing quantitative perfusion assessment, including those with SSS=0. When compared to the model of visual assessment with clinical variables (AUC; all combined model: 0.721 vs. visual + clinical variables: 0.718, p<0.0001) or the model of TPD with clinical variables (AUC; all combined model: 0.721 vs. TPD + clinical variables: 0.718, p<0.05), the AUC by all combined model (visual assessment and TPD with clinical variables) significantly improved MACE prediction. By 4 grades TPD classification, the AUC were similar in MACE prediction compared to qualitative visual assessment (AUC; visual:0.635 vs. TPD:0.641, p=0.25). The combined model of the two significantly improved visual assessment or 4 grades TPD assessment (AUC; visual+TPD:0.658, p for comparison with TPD or visual <0.0001).
Central Illustration. Annual MACE Rates by Visual and Quantitative Perfusion Categories in Overall Population.
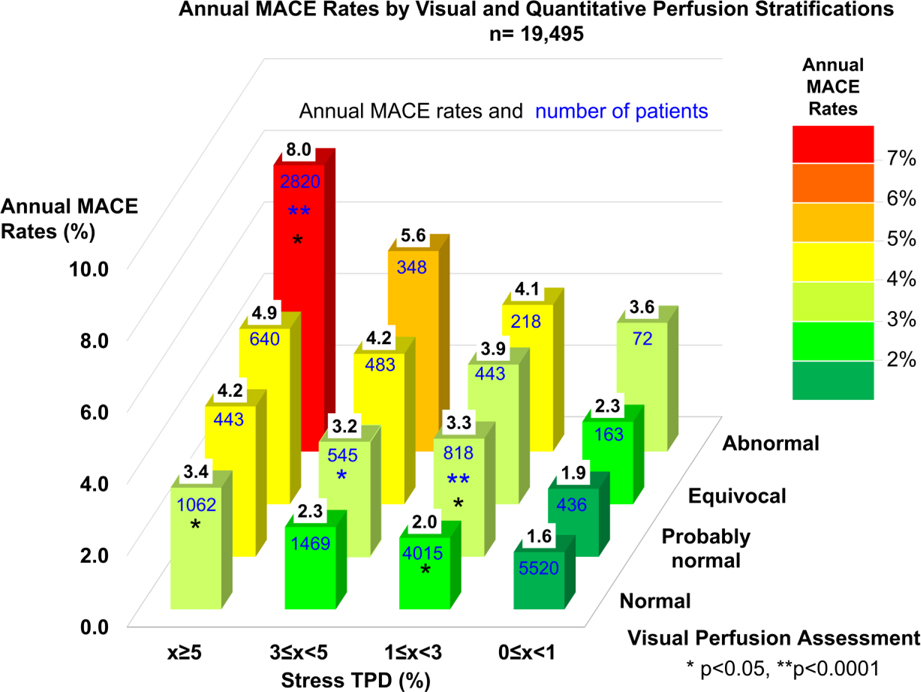
Annual MACE rates are shown as values in black on top of bars and numbers of patients are shown as values in blue on the surface of bars. Color scale on the right shows the range of annual MACE rates. Significant increase as compared to the immediate lower category is shown by an asterisk (Blue: compared to lower visual perfusion category, Black: compared to lower quantitative perfusion category).
MACE = major adverse cardiac events, TPD = total perfusion deficit.
Figure 4. Annual MACE Rates by Segmental Visual score and Quantitative Perfusion Categories.
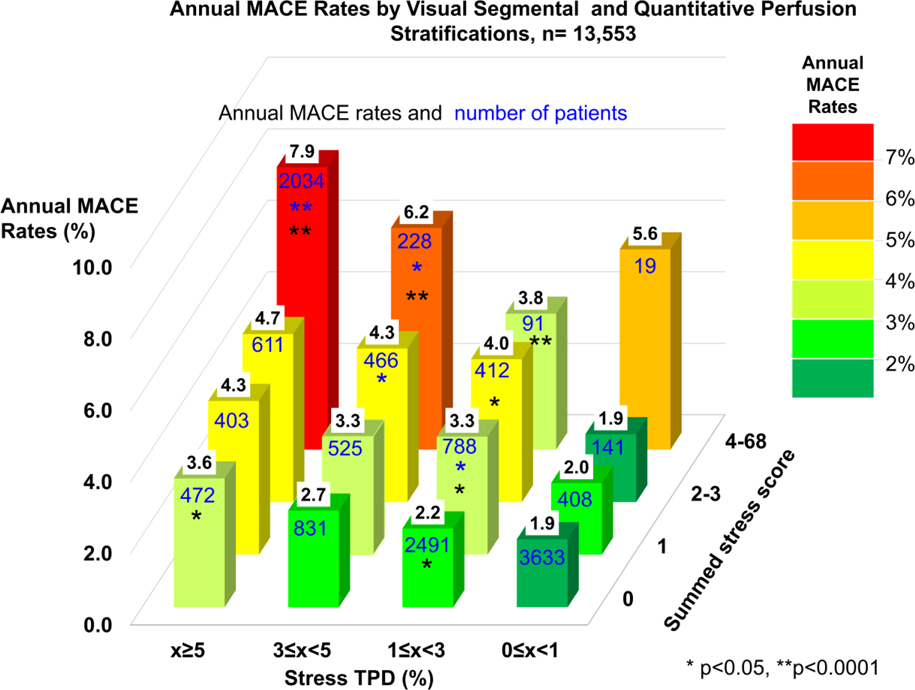
Annual MACE rates are shown as values in black on top of bars and numbers of patients are shown as values in blue on the surface of bars. Color scale on the right shows the range of annual MACE rates. Significant increase as compared to the immediate lower category is shown by an asterisk (Blue: compared to lower visual perfusion category, Black: compared to lower quantitative perfusion category).
MACE = major adverse cardiac events, SSS = summed stress score, TPD = total perfusion deficit.
Annual hard event rates and number of patients for categories of visual (Figure 5) and segmental scoring (Supplemental Figure 3) assessment stratifications. Hard event risk was also predicted by ischemic TPD and rest TPD. The annual hard event rates increased with increases of ischemic TPD category (p<0.0001, Supplemental Figure 4) as well as increases of rest TPD category (p<0.0001, Supplemental Figure 5).
Figure 5. Annual Hard Event Rates by Visual and Quantitative Perfusion Categories in Overall Population.
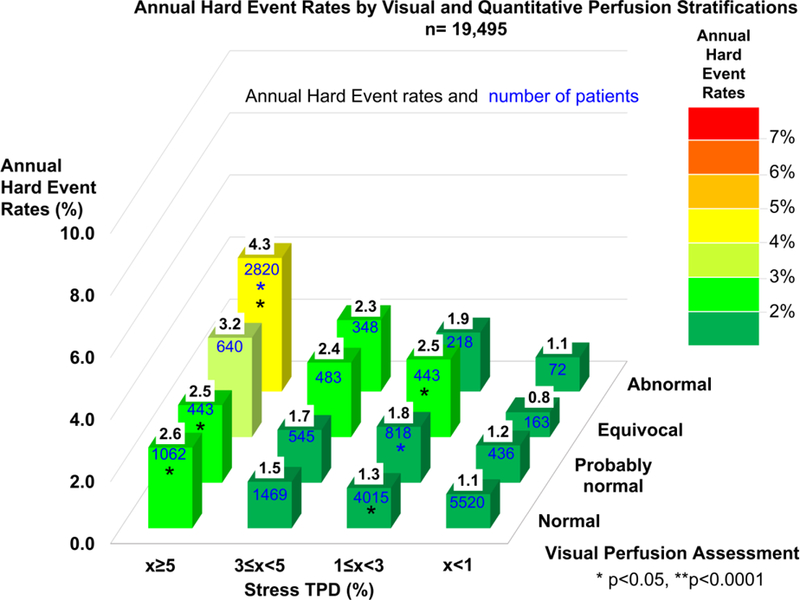
Annual hard event rates are shown as values in black on top of bars and numbers of patients are shown as values in blue on the surface of bars. Color scale on the right shows the range of annual hard event rates. Significant increase as compared to the immediate lower category is shown by an asterisk (Blue: compared to lower visual perfusion category, Black: compared to lower quantitative perfusion category).
TPD = total perfusion deficit.
DISCUSSION
Our Findings.
In this large multi-center REFINE SPECT registry, we observed that increasing abnormality on both visual and automated perfusion quantification was associated with increased MACE risk over long-term follow-up (median follow-up of 5 years), in both unadjusted and adjusted multivariable analyses. The MACE rates increased progressively with each increasing interval of both visual and quantitative assessment (stress TPD) on a fine granular scale, including several intervals below standard diagnostic threshold (SSS<4 and stress TPD<5%). These findings were observed similarly in the overall population and in patients with suspected CAD. Importantly, quantitative analysis further stratified risk in significant number of patients with normal visual perfusion assessment or SSS = 0. Thus, visual and automated quantitative analysis of MPI are complementary to each other in MACE prediction, providing objective information to the physicians in addition to the overall visual findings. Concordant findings were also observed for the hard event rates, with the hard event rates smaller (as expected) than MACE rates.
Other Studies.
Most of the previous prognostic SPECT-MPI studies have used visual perfusion assessment only (3–12). There have been only a few previous prognostic studies of stress SPECT-MPI which have used fully automated quantitative analysis. These quantitative studies have been limited to a small sample size or have been single center studies. These previous quantitative studies defined death, and myocardial infarction as outcomes (22–24), while two single center studies followed MACE over median term of follow-up (25,26). None of the previous prognostic MPI studies directly compared visual and quantitative analysis.
Visual Versus Quantitative Perfusion Assessment.
Our results suggest that both visual and quantitative MPI assessment complement each other for risk stratification. In our study, 12,066 patients were visually scored as normal. MACE rates also increased progressively with increasing interval of stress TPD (Central illustration and Figure 4) in these patients with normal reading. We also observed stratification of risk (> 2x) in subcategories of stress TPD <5%. This was also true when adjusted for key confounding variables. The 46% of scans visually read as normal, which had also very low quantitative score (TPD <1%) could be assigned better prognosis than that offered by visual reading alone. Meta-analysis of several prognostic studies with visual analysis that evaluated the prognostic value of normal exercise stress SPECT-MPI in 8,008 patients (27), has shown high negative predictive value of MPI. Based on our results, it is likely that negative predictive value of a normal MPI could be further refined with the additional quantitative analysis.
Clinical Implications.
Although readers use all available information to report their final clinical score, gated scans, and clinical data), we have found that MACE and hard events (death, MI) risk can be stratified further by the standard quantitative perfusion analysis in cases with normal clinical reading in a significant number of patients. Readers and referring physicians should pay attention to perfusion quantification results even in cases with subtle defects. The quantitative parameters provide additional independent prediction of the patient’s outcome. In the future, one could consider reporting a quantitative probability estimation of annual-MACE risk for a given patient. Importantly, our findings indicate that the concordance of normal visual and quantitative findings can actually lower the MACE risk in comparison to visual read alone -thus perhaps avoiding costly further tests and interventions in some patients. Quantitative perfusion should be incorporated by clinicians as an aid before the final interpretation, even if the overall visual finding is normal. This additional prognostic information available from quantitative analysis can be readily obtained in the large volume of MPI performed worldwide annually. This complementary data does not require any additional patient testing, radiation, procedures, or physician time and should be considered during routine evaluation of patient prognosis. In this analysis, we aimed to see all visual grades assessed by experienced nuclear cardiologists in real practice and observed significant MACE risk increase for “probably normal” and “equivocal” categories compared to “normal” category. However, “probably normal” is often avoided and “equivocal” is reserved for challenging cases in clinical reports as ASNC guideline recommends (16)– which is reflected in relatively small numbers of patients with such findings in our study.
Study Limitations.
Since the visual assessment was performed by experienced readers for all the sites, there could be variability in visual reading between readers from different sites. However, using final visual clinical assessments by local sites, the visual reading represents typical multicenter performance of day-to-day clinical reading in experienced sites. Not all sites performed visual segmental scoring during clinical reporting -reflecting the real-world heterogeneity of the visual reading procedures. Although SSS was used to categorize qualitative visual assessment classification for the population who were provided SSS, clinical reading score was used for 30% of the population who were not provided SSS. In a previous study by Abidov et al. (9) as normal or abnormal classification using SSS or categories was equivalent, with some differences noted for the probably normal or equivocal categories versus SSS classification. Nevertheless, in the current study, out of 3,971 patients (20% of total study population) who were classified as probably normal or equivocal, and only 5% were classified by categories with 95% were grouped by SSS. The results of the Cox proportional hazards model were limited by the number of events accumulated during the follow-up and by confounders that were put in the models. This study, however, included far more events than has any previous multicenter prognostic study of SPECT-MPI. Although in this study we evaluated one standard quantitative approach, it still needs to be established if other available software methods and other types of cameras (28,29) would provide similar results.
CONCLUSION
MACE and hard event (death, MI) rates increased progressively with the worsening of perfusion abnormality among patients undergoing stress MPI by both visual and quantitative analyses. By quantitative analysis, annualized MACE and hard event rates increased significantly even for perfusion abnormalities below diagnostic threshold, and even for scans reported as normal. Quantitative analysis provides independent and complementary prognostic information to visual reading.
Supplementary Material
PERSPECTIVES.
CLINICAL COMPETENCIES: COMPETENCY IN MEDICAL KNOWLEDGE
Quantitative analysis allows a more precise granular risk stratification in comparison to visual reading. Risk stratification by quantitative analysis is complementary to visual diagnosis.
TRANSLATION OUTLOOK
Readers and referring physicians should pay attention to quantitative parameters even if overall clinical finding is normal. Perfusion quantification provides additional independent prediction of the patient’s outcome.
Acknowledgments
FUNDING
This research was supported in part by grant R01HL089765 from the National Heart, Lung, and Blood Institute/ National Institutes of Health (PI: Piotr Slomka). The content is solely the responsibility of the authors and does not necessarily represent the official views of the National Institutes of Health.
DISCLOSURES
Drs. Einstein, and Miller are consultants for GE Healthcare. Drs. Bateman, Einstein, Miller, and Ruddy have grants from GE Healthcare. Dr. Kaufmann holds a research contract with GE Healthcare. Dr. Di Carli reports grants from Spectrum Dynamics. Drs. Slomka, Berman and Germano participate in software royalties at Cedars–Sinai Medical Center.
Abbreviations
- CABG
coronary artery bypass graft
- CAD
coronary artery disease
- ECG
electrocardiogram
- EF
ejection fraction
- MACE
major adverse cardiac events
- MPI
myocardial perfusion imaging
- PCI
percutaneous coronary intervention
- QPS
quantitative perfusion SPECT
- SPECT
single photon emission computed tomography
- TPD
total perfusion deficit
Footnotes
No other conflict of interest relevant to this article was reported.
REFERENCES
- 1.Wells RG, Marvin B, Poirier M, Renaud J, deKemp RA, Ruddy TD. Optimization of SPECT Measurement of Myocardial Blood Flow with Corrections for Attenuation, Motion, and Blood Binding Compared with PET. J Nucl Med 2017;58:2013–2019. [DOI] [PubMed] [Google Scholar]
- 2.Einstein AJ, Pascual TN, Mercuri M et al. Current worldwide nuclear cardiology practices and radiation exposure: results from the 65 country IAEA Nuclear Cardiology Protocols Cross-Sectional Study (INCAPS). Eur Heart J 2015;36:1689–96. [DOI] [PMC free article] [PubMed] [Google Scholar]
- 3.Hachamovitch R, Berman DS, Kiat H et al. Exercise myocardial perfusion SPECT in patients without known coronary artery disease: incremental prognostic value and use in risk stratification. Circulation 1996;93:905–14. [DOI] [PubMed] [Google Scholar]
- 4.Piccini JP, Horton JR, Shaw LK et al. Single-photon emission computed tomography myocardial perfusion defects are associated with an increased risk of all-cause death, cardiovascular death, and sudden cardiac death. Circ Cardiovasc Imaging 2008;1:180–8. [DOI] [PubMed] [Google Scholar]
- 5.Hachamovitch R, Kang X, Amanullah AM et al. Prognostic implications of myocardial perfusion single-photon emission computed tomography in the elderly. Circulation 2009;120:2197–206. [DOI] [PubMed] [Google Scholar]
- 6.Lee DS, Verocai F, Husain M et al. Cardiovascular outcomes are predicted by exercise-stress myocardial perfusion imaging: Impact on death, myocardial infarction, and coronary revascularization procedures. Am Heart J 2011;161:900–7. [DOI] [PubMed] [Google Scholar]
- 7.Ardestani A, Ahlberg AW, Katten DM et al. Risk stratification using line source attenuation correction with rest/stress Tc-99m sestamibi SPECT myocardial perfusion imaging. J Nucl Cardiol 2014;21:118–26. [DOI] [PubMed] [Google Scholar]
- 8.Engbers EM, Timmer JR, Mouden M, Knollema S, Jager PL, Ottervanger JP. Prognostic Value of Myocardial Perfusion Imaging with a Cadmium-Zinc-Telluride SPECT Camera in Patients Suspected of Having Coronary Artery Disease. J Nucl Med 2017;58:1459–1463. [DOI] [PubMed] [Google Scholar]
- 9.Abidov A, Hachamovitch R, Hayes SW et al. Are shades of gray prognostically useful in reporting myocardial perfusion single-photon emission computed tomography? Circ Cardiovasc Imaging 2009;2:290–8. [DOI] [PubMed] [Google Scholar]
- 10.Berman DS, Abidov A, Kang X et al. Prognostic validation of a 17-segment score derived from a 20-segment score for myocardial perfusion spect interpretation. J Nucl Cardiol 2004;11:414–423. [DOI] [PubMed] [Google Scholar]
- 11.Shaw LJ, Hendel R, Borges-Neto S et al. Prognostic value of normal exercise and adenosine (99m)Tc-tetrofosmin SPECT imaging: results from the multicenter registry of 4,728 patients. J Nucl Med 2003;44:134–9. [PubMed] [Google Scholar]
- 12.Nishimura T, Nakajima K, Kusuoka H, Yamashina A, Nishimura S. Prognostic study of risk stratification among Japanese patients with ischemic heart disease using gated myocardial perfusion SPECT: J-ACCESS study. Eur J Nucl Med Mol Imaging 2008;35:319–28. [DOI] [PubMed] [Google Scholar]
- 13.Slomka PJ, Betancur J, Liang JX et al. Rationale and design of the REgistry of Fast Myocardial Perfusion Imaging with NExt generation SPECT (REFINE SPECT). Journal of Nuclear Cardiology 2018. [DOI] [PMC free article] [PubMed]
- 14.Gambhir SS, Berman DS, Ziffer J et al. A novel high-sensitivity rapid-acquisition single-photon cardiac imaging camera. J Nucl Med 2009;50:635–43. [DOI] [PubMed] [Google Scholar]
- 15.Herzog BA, Buechel RR, Katz R et al. Nuclear myocardial perfusion imaging with a cadmium-zinc-telluride detector technique: optimized protocol for scan time reduction. J Nucl Med 2010;51:46–51. [DOI] [PubMed] [Google Scholar]
- 16.Dorbala S, Ananthasubramaniam K, Armstrong IS et al. Single Photon Emission Computed Tomography (SPECT) Myocardial Perfusion Imaging Guidelines: Instrumentation, Acquisition, Processing, and Interpretation. J Nucl Cardiol 2018;25:1784–1846. [DOI] [PubMed] [Google Scholar]
- 17.Cerqueira MD, Weissman NJ, Dilsizian V et al. Standardized myocardial segmentation and nomenclature for tomographic imaging of the heart. A statement for healthcare professionals from the Cardiac Imaging Committee of the Council on Clinical Cardiology of the American Heart Association. Int J Cardiovasc Imaging 2002;18:539–42. [PubMed] [Google Scholar]
- 18.Slomka PJ, Nishina H, Berman DS et al. Automated quantification of myocardial perfusion SPECT using simplified normal limits. J Nucl Cardiol 2005;12:66–77. [DOI] [PubMed] [Google Scholar]
- 19.Nakazato R, Tamarappoo BK, Kang X et al. Quantitative upright-supine high-speed SPECT myocardial perfusion imaging for detection of coronary artery disease: correlation with invasive coronary angiography. J Nucl Med 2010;51:1724–31. [DOI] [PMC free article] [PubMed] [Google Scholar]
- 20.Shaw LJ, Berman DS, Picard MH et al. Comparative definitions for moderate-severe ischemia in stress nuclear, echocardiography, and magnetic resonance imaging. JACC Cardiovasc Imaging 2014;7:593–604. [DOI] [PMC free article] [PubMed] [Google Scholar]
- 21.DeLong ER, DeLong DM, Clarke-Pearson DL. Comparing the Areas under Two or More Correlated Receiver Operating Characteristic Curves: A Nonparametric Approach. Biometrics 1988;44:837–845. [PubMed] [Google Scholar]
- 22.Leslie WD, Tully SA, Yogendran MS, Ward LM, Nour KA, Metge CJ. Prognostic value of automated quantification of 99mTc-sestamibi myocardial perfusion imaging. J Nucl Med 2005;46:204–11. [PubMed] [Google Scholar]
- 23.Motwani M, Leslie WD, Goertzen AL et al. Fully automated analysis of attenuation-corrected SPECT for the long-term prediction of acute myocardial infarction. J Nucl Cardiol 2018;25:1353–1360. [DOI] [PMC free article] [PubMed] [Google Scholar]
- 24.Nakazato R, Berman DS, Gransar H et al. Prognostic value of quantitative high-speed myocardial perfusion imaging. J Nucl Cardiol 2012;19:1113–23. [DOI] [PMC free article] [PubMed] [Google Scholar]
- 25.Betancur J, Otaki Y, Motwani M et al. Prognostic Value of Combined Clinical and Myocardial Perfusion Imaging Data Using Machine Learning. JACC Cardiovasc Imaging 2017. [DOI] [PMC free article] [PubMed]
- 26.Hage FG, Ghimire G, Lester D et al. The prognostic value of regadenoson myocardial perfusion imaging. J Nucl Cardiol 2015;22:1214–21. [DOI] [PMC free article] [PubMed] [Google Scholar]
- 27.Metz LD, Beattie M, Hom R, Redberg RF, Grady D, Fleischmann KE. The prognostic value of normal exercise myocardial perfusion imaging and exercise echocardiography: a meta-analysis. J Am Coll Cardiol 2007;49:227–37. [DOI] [PubMed] [Google Scholar]
- 28.Ficaro EP, Lee BC, Kritzman JN, Corbett JR. Corridor4DM: the Michigan method for quantitative nuclear cardiology. J Nucl Cardiol 2007;14:455–65. [DOI] [PubMed] [Google Scholar]
- 29.Garcia EV, Faber TL, Cooke CD, Folks RD, Chen J, Santana C. The increasing role of quantification in clinical nuclear cardiology: the Emory approach. J Nucl Cardiol 2007;14:420–32. [DOI] [PubMed] [Google Scholar]
Associated Data
This section collects any data citations, data availability statements, or supplementary materials included in this article.