

Abstract
The psychedelic properties of lysergic acid diethylamide (LSD) have captured the imagination of researchers for many years and its rediscovery as an important research tool is evidenced by its clinical use within neuroscientific and therapeutic settings. At the same time, a number of novel LSD analogs have recently emerged as recreational drugs, which makes it necessary to study their analytical and pharmacological properties. One of the most recent additions to this series of LSD analogs is 1-butanoyl-LSD (1B-LSD), a constitutional isomer of 1-propionyl-6-ethyl-6-nor-lysergic acid diethylamide (1P-ETH-LAD), another LSD analog that was described previously. This study presents a comprehensive analytical characterization of 1B-LSD employing nuclear magnetic resonance spectroscopy (NMR), low- and high-resolution mass spectrometry platforms, gas- and liquid chromatography (GC and LC), and GC-condensed phase and attenuated total reflection infrared spectroscopy analyses. Analytical differentiation of 1B-LSD from 1P-ETH-LAD was straightforward. LSD and other serotonergic hallucinogens induce the head-twitch response (HTR) in rats and mice, which is mediated by 5-HT2A receptor activation. HTR studies were conducted in C57BL/6J mice to assess whether 1B-LSD has LSD-like behavioral effects. 1B-LSD produced a dose-dependent increase in HTR counts, acting with ~14% (ED50 = 976.7 nmol/kg) of the potency of LSD (ED50 = 132.8 nmol/kg). This finding suggests that the behavioral effects of 1B-LSD are reminiscent of LSD and other serotonergic hallucinogens. The possibility exists that 1B-LSD serves as a pro-drug for LSD. Further investigations are warranted to confirm whether 1B-LSD produces LSD-like psychoactive effects in humans.
Keywords: New psychoactive substances, LSD, 5-HT2A receptor, lysergamides, psychedelics
1. Introduction
The serotonergic hallucinogen lysergic acid diethylamide (LSD, Figure 1) is one of the most potent psychedelic drugs, with typical oral doses ranging from 50–200 μg1 although lower doses can be found on blotters circulating on the streets. Use of LSD has occurred at relatively constant levels since the end of the 1960s and it remains a popular recreational substance due to nature and intensity of its psychedelic effects.2 More recently, widespread interest in the use of LSD at sub-threshold levels (so-called “microdosing”) has developed, based on anecdotal accounts indicating that very low doses of the drug may have performance-enhancing and other beneficial effects.3 In addition, a large number of promising clinical studies have been conducted in recent years to explore the use of LSD for neuroscientific and therapeutic purposes.4,5
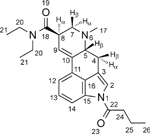
Figure 1.

Chemical structures of lysergic acid diethylamide (LSD) and various 1-acyl analogs that emerged as research chemicals. 1B-LSD represents a recent addition to the product catalog.
Various substitutions on the indole nitrogen (position N1) of LSD were prepared in previous decades, including the attachment of acyl groups.6,7 One of the earliest examples is 1-acetyl-LSD (ALD-52, 1A-LSD; Figure 1), which has LSD-like psychoactive properties in humans.8–11 It was recently shown that ALD-52 is hydrolyzed to LSD when incubated with pooled human liver enzymes, indicating that it may serve as a prodrug for LSD in vivo.12 Clinical investigations with ALD-52 are ultimately necessary to confirm the extent of LSD formation in humans. According to the European Monitoring Centre for Drugs and Drug Addiction (EMCDDA), ALD-52 was first detected in Europe in April 201613 whereas the detection of 1-propanoyl-LSD (1P-LSD, Figure 1) was notified in 2015.14 1P-LSD and 1P-ETH-LAD (Figure 1), two other 1-acyl substituted lysergamides that have been marketed online as recreational drugs in recent years, were also shown to undergo N-deacylation to LSD and ETH-LAD, respectively.12,15,16 ETH-LAD appears to produce psychedelic effects in humans1,17 and was shown to be more potent than LSD in rats trained to discriminate the latter drug from saline.18 1-Butanoyl-LSD (1B-LSD, (6aR,9R)-4-butanoyl-N,N-diethyl-7-methyl-4,6,6a,7,8,9-hexahydroindolo[4,3-fg]quinoline-9-carboxamide; Figure 1) is the most recent N1-acylated LSD derivative to appear on the recreational drug market. Similar to ALD-52, 1P-LSD, and 1P-ETH-LAD, 1B-LSD is hydrolyzed to LSD in vitro.12
The head twitch response (HTR) is a rapid paroxysmal head movement induced by serotonergic hallucinogens in rats and mice via 5-HT2A receptor activation.19–21 Using this assay, it is possible to distinguish between hallucinogenic and non-hallucinogenic 5-HT2A receptor agonists.21,22 Furthermore, the HTR is commonly used as a behavioral proxy in rodents for human hallucinogenic effects. In previous investigations, several lysergamides available as research chemicals, including 1P-LSD, were found to induce the HTR.15,23,24 One exception was lysergic acid morpholide (LSM-775), which only induced the HTR when 5-HT1A receptors were blocked by pretreatment with the antagonist WAY-100,635.25 Consistent with these results, LSM-775 did not fully mimic the psychedelic effects produced by LSD when it was evaluated in humans.9,10,26
In the present study, HTR experiments were conducted with 1B-LSD in C57BL/6J mice to determine whether it produces LSD-like behavioral effects. A comprehensive analytical characterization is also included using various mass spectrometry (MS) platforms, gas- and liquid chromatography (GC and LC), nuclear magnetic resonance spectroscopy (NMR) and GC condensed phase infrared (IR) analysis. These analytical data are being made available to other investigators who encounter this newly emerging psychoactive substance.
2. Experimental
2.1. Materials
All chemicals used were of analytical and HPLC grade and obtained from Aldrich (Dorset, UK). DMSO-d6 (99.8% D) was from VWR (Leicestershire, UK). 1-Butanoyl-LSD hemitartrate (2:1) powder (1B-LSD) was supplied by Synex Synthetics BV, Maastricht, The Netherlands.
2.2. Instrumentation
2.2.1. Gas chromatography mass spectrometry
Electron ionization (EI) mass spectra (70 eV) were recorded using a Finnigan TSQ 8000 EVO triple stage quadrupole mass spectrometer coupled to a gas chromatograph (Trace 1310, Thermo Electron, Dreieich, Germany). Sample introduction was carried out using a Triplus RSH autosampler. The emission current was 200 μA and the scan time was 1 s spanning a scan range between m/z 29–600. The ion source temperature was maintained at 220°C. Samples were introduced via gas chromatography with splitless injection using a fused silica capillary DB-1 column (30 m × 0.25 mm, film thickness 0.25 μm). The temperature program consisted of an initial temperature of 80°C, held for 2 min, followed by a ramp to 310°C at 20°C/min. The final temperature was held for 23 min. The injector temperature and the transfer line temperature were 280°C and 300°C and the carrier gas was helium in constant flow mode at a flow rate of 1.2 mL/min. Approximately 2 mg were dissolved in 1.5 mL methanol. For analysis, 1 μL of sample solution was injected into the GC-MS system. Kovats retention indices (RI) were calculated from measurement of an n-alkane mixture analyzed with the above-mentioned temperature program.
2.2.2. Gas chromatography solid-state infrared analysis
Samples were analyzed using a GC-solid phase-IR-system that consisted of an Agilent GC 7890B (Waldbronn, Germany) with probe sampler Agilent G4567A and a DiscovIR-GC™ (Spectra Analysis, Marlborough, MA, USA). The column eluent was cryogenically accumulated on a spirally rotating ZnSe disk cooled by liquid nitrogen. IR spectra were recorded through the IR-transparent ZnSe disk using a nitrogen-cooled MCT detector. GC parameters: injection in splitless mode with the injection port temperature set at 240°C and a DB-1 fused silica capillary column (30 m × 0.32 mm i.d., 0.25 μm film thickness). The carrier gas was helium with a flow rate of 2.5 mL/min and the oven temperature program was as follows: 80°C for 2 min, ramped to 310°C at 20 °C/min, and held at for 23 min. The transfer line was heated at 280°C. Infrared conditions: oven temperature, restrictor temperature, disc temperature, and Dewar cap temperatures were 280°C, 280°C, −40°C, and 35°C, respectively. The vacuum was 0.2 mTorr, disc speed 3 mm/s, spiral separation was 1 mm, wavelength resolution 4 cm−1 and IR range 650–4000 cm−1. Acquisition time was 0.6 s/file with 64 scans/spectrum. Data were processed using GRAMS/AI Ver. 9.1 (Grams Spectroscopy Software Suite, Thermo Fisher Scientific, Dreieich, Germany) followed by implementation of the OMNIC Software, Ver. 7.4.127 (Thermo Electron Corporation, Dreieich, Germany).
2.2.3. High mass accuracy electrospray ionization mass spectrometry
Ultrahigh-performance liquid chromatography quadrupole time-of-flight single and tandem mass spectrometry (UHPLC-QTOF-MS/MS) data were obtained from an Agilent 6540 UHD Accurate-Mass QTOF LC-MS system coupled to an Agilent 1290 Infinity UHPLC system (Agilent, Cheshire, UK). Separation was achieved using an Agilent Zorbax Eclipse Plus C18 column (100 mm × 2.1 mm, 1.8 μm) (Agilent, Cheadle, UK). Mobile phases consisted of acetonitrile (1% formic acid) and 1% formic acid in water. The column temperature was set at 40°C (0.6 mL/min) and data were acquired for 5.5 min. The gradient was set at 5–70% acetonitrile over 3.5 min, then increased to 95% acetonitrile in 1 min and held for 0.5 min before returning to 5% acetonitrile in 0.5 min. QTOF-MS data were acquired in positive mode scanning from m/z 100–1000 with and without auto MS/MS fragmentation. Ionization was achieved with an Agilent JetStream electrospray source and infused internal reference masses. QTOF-MS parameters: gas temperature 325°C, drying gas 10 L/min and sheath gas temperature 400°C. Internal reference ions at m/z 121.05087 and m/z 922.00979 were used for calibration purposes.
2.2.4. Liquid chromatography electrospray ionization mass spectrometry
HPLC single quadrupole mass spectrometry (LC-Q-MS) analyses were carried out on an Agilent 1100 system using a Restek (Bellefonte, PA, USA) Allure PFPP column (5 μm, 50 × 2.1 mm). The aqueous mobile phase A consisted of 0.1% formic acid, whereas, mobile phase B consisted of 0.1% formic acid in acetonitrile. The total run time was 25 min. The following gradient elution program was used: 0–2 min 2% B, followed by an increase to 60% within 15 min, then up to 80% within 20 min, returning to 2% within 25 min. The Agilent LC-MSD settings were as follows: positive electrospray mode, capillary voltage 3500 V, drying gas (N2) 12 L/min at 350°C, nebulizer gas (N2) pressure 50 psi, scan mode m/z 70–500, fragmentor voltage values used for in-source collision-induced dissociation (CID) were 30 V and 150 V, respectively. The sample was dissolved in acetonitrile/water (1:1, containing 0.1% formic acid) at a concentration of 10 μg/mL. The injection volume was 1 μL, flow rate was 0.80 mL/min and the column temperature was 30°C.
2.2.5. High performance liquid chromatography diode array detection
A Dionex 3000 Ultimate liquid chromatography system coupled to a UV diode array detector (Thermo Fisher, St. Albans, UK) was used using a Phenomenex Synergi Fusion column (150 mm × 2 mm, 4 μm) protected by a 4 mm × 3 mm Phenomenex Synergi Fusion guard column (Phenomenex, Macclesfield, UK). The mobile phases were 70% acetonitrile with 25 mM of triethylammonium phosphate buffer (TEAP) (B) and aqueous TEAP (25 mM) buffer (A). The gradient elution commenced with 4% B and ramped to 70% B in 15 min and held for 3 min, resulting in a total acquisition time of 18 min at a flow rate of 0.6 mL/min. The diode array detection window was set at 200–595 nm (collection rate 2 Hz).
2.2.6. Nuclear magnetic resonance (NMR) spectroscopy
Samples were prepared in deuterated dimethyl sulfoxide (DMSO-d6) and 1H (600 MHz) and 13C (150 MHz) spectra were recorded on a Bruker AVANCE III 600 MHz NMR spectrometer. Spectra were referenced to residual solvent and assignments were supported by both 1D and 2D experiments.
2.3. Animal pharmacology
Male C57BL/6J mice (6−8 weeks old) were obtained from Jackson Laboratories (Bar Harbor, ME, USA) and housed up to four per cage with a reversed light-cycle (lights on at 1900 h, off at 0700 h). Food and water were provided ad libitum, except during behavioral testing. Testing was conducted between 1000 and 1830 h. The head twitch response (HTR) was detected using a head mounted magnet and a magnetometer coil.21,27 Mice received intraperitoneal (IP) vehicle (saline) or 1B-LSD (0.025, 0.05, 0.1, 0.2, 0.4, or 0.8 mg/kg) and then HTR was assessed for 30 min. The injection volume was 5 mL/kg.
2.3.1. Analysis
Head twitches were detected as described in previous experiments.21,27 Head twitch counts were analyzed using one-way analyses of variance (ANOVA). Post-hoc comparisons were made using Tukey’s studentized range method. Significance was demonstrated by surpassing an α-level of 0.05. ED50 values and 95% confidence intervals were calculated using nonlinear regression. Potency values were compared using an extra-sum-of-squares F-test.
3. Results and discussion
3.1. Analytical features
The electron ionization (EI) mass spectrum of 1B-LSD is shown in Figure 2 followed by proposed fragmentation pathways (Figure 3) based on previous investigations with a range of related lysergamides. For example, fragments typically recorded with compounds of this class include fragment clusters at m/z 151–156, m/z 161–169, m/z 178–182, m/z 191–197 and m/z 205–208.15,16,23,25,28 The following discussion of analytical data will focus on the difference between 1B-LSD and its isomer 1P-ETH-LAD, which was the subject of a previous report.16
Figure 2.

Electron ionization mass spectrum of 1B-LSD.
Figure 3.


Proposed fragmentation pathways for 1B-LSD following electron ionization.
The retro-Diels-Alder fragment at m/z 350 was consistent with the mass shift associated with the butanoyl group attached to the indole nitrogen of 1B-LSD. In comparison, the 1-propanoyl analogs 1P-LSD and 1P-ETH-LAD gave rise to a species at m/z 33615,16 reflecting the reduced chain length and mass difference of 14 u. A further reduction in chain length would be represented by N1-acetyl-LSD (1A-LSD, ALD-52) where the corresponding fragment was detectable at m/z 322.29 Another N-acyl group related difference between the mass spectra of 1P-ETH-LAD and 1B-LSD could be observed at the low mass range of the spectrum. In 1B-LSD, a prominent peak was observed at m/z 43 (Figure 2) that might have been attributed to the formation of an n-propyl fragment, presumably following the loss of CO from the butanoyl ion when it was cleaved off the indole nitrogen (Figure 3). In the EI mass spectrum of 1P-ETH-LAD, the propanoyl ion was detected at m/z 57 instead.16 Another notable difference between the spectra of 1B-LSD and 1P-ETH-LAD can be seen in fragments that reflect the different alkyl groups located on the N6 nitrogen atom. The EI mass spectrum of 1B-LSD revealed a LSD-type fragment cluster at m/z 219–22428 (Figure 2) and suggested mechanisms associated with the key ions of this cluster have been included in Figure 3. In the cases of ETH-LAD and 1P-ETH-LAD, however, extending the N6-methyl to N6-ethyl led to a corresponding shift of 14 u and the detection of fragments at m/z 233–238.16 Similarly, the m/z 219–224 cluster was detected in the EI mass spectrum of lysergic acid 2,4-dimethylazetidide (LSZ, containing N6-methyl) but not 6-allyl-6-nor-LSD (AL-LAD, containing N6-allyl).23 N,N-Diethylamide related fragments (e.g. m/z 72, 100 and 128) (Figure 3) were detected in both 1B-LSD and 1P-ETH-LAD16, which did not contribute to their differentiation. From a gas chromatographic perspective, 1B-LSD (retention time 25.86 min, RI = 3579 (DB-1, 310 °C), Figure 2) could be conveniently distinguished from 1P-ETH-LAD (retention time 21.37 min, RI = 3529 (DB-1, 310 °C).16
The infrared spectrum obtained from GC solid-state analysis is shown in Figure 4. The hemitartrate salt sample was converted to the free base with aqueous sodium hydroxide (5 % w/w) and extracted into diethyl ether and then subjected to GC analysis. The signals linked to the carbonyl groups (1702.0 and 1638.7 cm−1) were comparable to those reported for 1P-LSD (1703.7 and 1637.5 cm−1)15 and 1P-ETH-LAD (1704.0 and 1639.7 cm−1), respectively.16 Some little but distinct and characteristic differences between 1B-LSD and 1P-ETH-LAD16 in the fingerprint region were visible. Characteristic differences were observed for example at 1339, 1253/1244, 1051/1044, and 904/891/877 cm−1 (Supporting Information). For completeness, the ATR-IR spectrum recorded from the 1B-LSD hemitartrate salt has also been added to the Supporting Information section.
Figure 4.

Gas chromatography-solid state-infrared spectrum of 1B-LSD. Top: entire scan range. Bottom: partial scan range.
Liquid chromatography-based methods confirmed that 1B-LSD could be separated from 1P-ETH-LAD in two out of three cases. As shown in Figure 5, the retention times recorded were 2.213 min (UHPLC-QTOF-MS/MS), 13.07 min (LC-Q-MS) and 9.03 min (LC-DAD), respectively. Under identical conditions reported previously, the isomeric 1P-ETH-LAD eluted at 2.667, 13.05 min (LC-Q-MS) and 8.51 min (LC-DAD).16 The observation that both isomers were not separated using the LC-Q-MS method was interesting. On the one hand, it was expected to observe an increase in lipophilicity with the addition of an additional methylene unit to the acyl group in 1B-LSD, but it appeared that this was balanced by a loss of lipophilicity with the N6-methyl group (1B-LSD) compared to the N6-ethyl group found in 1P-ETH-LAD. In the UHPLC-QTOF-MS/MS method, a Zorbax Eclipse Plus C18 column was employed whereas the LC-DAD method was based on a Phenomenex Synergi Fusion column (”polar embedded” C18 column). In case of the LC-Q-MS method, an Allure pentafluorophenyl propyl column was employed and the use of acetonitrile as the organic modifier might have had a disfavorable impact on selectivity due to potential disruption of π-π interactions. Employing a selected ion monitoring method under LC-Q-MS conditions (Figure 4C) revealed that the iso-1B-LSD epimer could not be detected. The full scan UV spectrum recorded with the HPLC-DAD method showed a distinct profile (Figure 4D) comparable with the spectrum of the isomeric 1P-ETH-LAD, which confirmed that differentiation was not possible on UV data alone.
Figure 5.

(A): Quadrupole time-of-flight tandem mass spectrum obtained from 1B-LSD. (B): Single quadrupole mass spectrum of 1B-LSD following in-source collision-induced-dissociation. (C): Insert in (B): HPLC single ion monitoring using the protonated molecule at m/z 394. (D): UV full scan spectrum using HPLC-DAD analysis. (E): HPLC-UV chromatogram.
The electrospray ionization QTOF HRMS/MS and single quadrupole mass spectra recorded for 1B-LSD are presented in Figures 5A and 5B with the proposed fragmentation pathways shown in Figure 6 in accordance with those reported for other lysergamides.15,16,23,25 The suggested product ion representing the m/z 251 species was based on a separate HR-MS/MS experiment and the corresponding spectrum has been made available in the Supporting Information section. Compared to the mass spectra of 1P-LSD published previously,15 some of the key product ions remained the same, such as m/z 74, 100, 128, 156, 208, and 223 whereas those detected at m/z 293 and 351 (m/z 279 and 337 in 1P-LSD) represented the mass shift of 14 u signifying the additional methylene unit. A comparison with the mass spectra recorded for the isomer 1P-ETH-LAD16 suggested that sufficient information was available to facilitate differentiation. Product ions linked to the shift from N6-ethyl (1P-ETH-LAD) to N6-methyl (1B-LSD) included m/z 237 (1P-ETH-LAD) versus m/z 223 (1B-LSD) and m/z 365 (1P-ETH-LAD) versus m/z 379 (1B-LSD). Another product ion detected both in ETH-LAD and 1P-ETH-LAD but not observed in the mass spectrum of 1B-LSD was m/z 58.16 This might have arisen from a retro-Diels-Alder mechanism to form the CH2=NH+C2H5 (C3H8N+) iminium ion. In 1B-LSD, the equivalent species reflecting the presence of the N6-methyl group would have been expected to form at m/z 44 but this was not observed under the conditions used (Figure 5). However, the presence of m/z 58 in the QTOF-MS/MS spectrum of 1P-ETH-LAD and its absence in 1B-LSD offered an additional differentiating feature.
Figure 6.


Proposed formation of product ions following collision-induced dissociation of 1B-LSD under QTOF-MS/MS conditions. The exact mass of m/z 251 ion was confirmed by a separate HR-MS/MS method (spectrum in Supporting Information).
The nuclear magnetic resonance (NMR) spectroscopy data for 1B-LSD are summarized in Table 1 (full spectra are shown in the Supporting Information). The assignments were supported by HSQC and HMBC experiments and were essentially consistent with those reported previously.15,16,23,25 The spectra were comparable with those recorded for 1P-LSD. The additional methylene unit found in the acyl (butanoyl) group of 1B-LSD was reflected in the spectral information. In the 1H NMR spectrum, the additional methylene group (labeled here as H-25, Table 1) resonated at 1.73 ppm in the form of a sextet. The corresponding signal in the 13C spectrum was observed at 18.13 ppm. In the 1H NMR spectrum of 1P-LSD, the methyl groups associated with the amide and acyl groups did partially overlap whereas in 1B-LSD, all three triplets were sufficiently resolved at 1.19, 1.07 and 1.00 ppm. In 1P-LSD (and also 1P-ETH-LAD) the indole H-12 and H-13 proton resonances also showed some overlap but this was not observed for 1B-LSD, which showed a clear separation at 7.36 and 7.31 ppm (Table 1). As far as the comparison with the isomer 1P-ETH-LAD was concerned, the main changes observed related to the differences associated with the acyl group and the N6-ethyl (1P-ETH-LAD) to N6-methyl (1B-LSD) transformation. The proton NMR spectrum, for example, showed the N6-methyl singlet (position 17, 2.49 ppm) resonating closely to the residual solvent peak (DMSO) whereas in 1P-ETH-LAD this was absent due to the presence of the N6-ethyl group. The three methyl groups associated with the amide and acyl groups were conveniently separated for 1B-LSD whereas two overlapping multiplets were observed previously in the 1P-ETH-LAD proton spectrum reflecting four methyl groups (2 x amide, 1 x propanoyl and N6-ethyl). The sextet representing the additional methylene unit within the acyl group at 1.73 ppm (Table 1) was absent in the spectrum of 1P-ETH-LAD.16 Interestingly, the proton chemical shift for H-5β experienced a particular change. In 1P-ETH-LAD, this multiplet was detected at 3.41–3.34 ppm16 whereas in 1B-LSD, this was recorded at 3.08–3.04 ppm (Table 1) as a reflection of the change of substituent on the vicinal nitrogen and because a different anisotropic effect of the ethyl group compared to the methyl group. A comparison of the 13C chemical shift values between 1P-ETH-LAD and 1B-LSD revealed some similarities (e.g. carbonyls and indole carbons) but also some differences. For example, in the former the 13C chemical shifts for C-5 and C-7 were detected at 58.23 and 50.83 ppm16 whereas in the latter, these were observed at 62.32 and 55.84 ppm (Table 1). Another notable downfield shift was noticed for the methylene group adjacent to the acyl carbonyl group. In 1P-ETH-LAD, it resonated at 28.15 ppm16 whereas in 1B-LSD, it was found to resonate at 37.04 ppm (Table 1). For a visual comparison, stacked NMR spectra (1B-LSD vs. 1P-ETH-LAD) have been included as Supporting Information.
Table 1.
1H and 13C NMR data for 1B-LSD hemitartrate (2:1) in DMSO-d6 at 600/150 MHz
 | ||
|---|---|---|
| No. | 13C [δ / ppm] | 1H [δ / ppm] |
| 1 | – | – |
| 2 | 120.50 | 7.61 (d, J = 1.7 Hz, 1 H) |
| 3 | 116.56 | – |
| 4 | 26.64 | 2.46 (dd, J = 14.7, 1.9 Hz, 4α-H, 1 H) * partially coalescing with H-17. 3.49 (dd, J = 15.3, 5.4 Hz, 4β-H, 1 H) |
| 5 | 62.32 | 3.08–3.04 (m, H-5β, 1 H) |
| 6 | – | – |
| 7 | 55.84 | 3.01 (dd, J = 11.1, 4.9 Hz, H-7α, 1 H) 2.61 (t, J = 10.8 Hz, H-7β, 1 H) |
| 8 | 39.42 | 3.84–3.80 (m, H-8α, 1 H) |
| 9 | 122.33 | 6.35 (s, 1 H) |
| 10 | 133.99 | – |
| 11 | 128.30 | – |
| 12 | 117.05 | 7.36 (d, J = 7.4 Hz, 1 H) |
| 13 | 126.40 | 7.31 (t, J = 7.7 Hz, 1 H) |
| 14 | 115.30 | 8.01 (d, J = 7.9 Hz, 1 H) |
| 15 | 133.63 | – |
| 16 | 128.05 | – |
| 17 | 43.63 | 2.49 (s, 3 H) *partially coalescing with 4α and DMSO peak |
| 18 | 170.89 | – |
| 19 | – | – |
| 20 | 42.05 | 3.45 (q, J = 7.1 Hz, 2 H) |
| 20 | 39.89 | 3.32 (AB qq, J20,20 = 13.9, J20,21 = 7.0 Hz, 2 H) *peaks are coalescing with broad water signal |
| 21 | 15.31 | 1.19 (t, J = 7.1 Hz, 3 H) |
| 21 | 13.54 | 1.07 (t, J = 7.0 Hz, 3 H) |
| 22 | 172.19 | – |
| 23 | – | – |
| 24 | 37.04 | 2.97 (t, J = 7.2 Hz, 2 H) |
| 25 | 18.13 | 1.73 (sex, J = 7.3 Hz, 2 H) |
| 26 | 14.01 | 1.00 (t, J = 7.4 Hz, 3 H) |
| TA a | 173.75 | – |
| TA a | 72.45 | 4.24 (s, ~1.3 H) |
TA: Tartaric acid.
3.2. Head-twitch response
To determine whether 1B-LSD produces LSD-like behavioral effects in vivo, we assessed whether it induces the HTR in mice. The HTR was assessed for 30 min following administration of 1B-LSD. As shown in Figure 7, 1B-LSD (F(5,25) = 41.31, p<0.0001) induced the HTR with an ED50 = 457.6 μg/kg (95% CI 334.9–625.5), which is equivalent to 976.7 nmol/kg. In comparison, when tested using similar methods, LSD induced the HTR with an ED50 of 132.8 nmol/kg,21 meaning that 1B-LSD has about 14% of the potency of LSD.
Figure 7.

Effect of 1B-LSD on the head twitch response. Data are presented as group means ± SEM for the entire 30-min test session (left panel), as well as group means during 5-min time blocks (right panel). *p<0.01, significant difference from the vehicle control group (Tukey’s test).
Based on the results of the HTR experiment, 1B-LSD appears to have a hallucinogen-like behavioral profile. Indeed, according to accounts published online, ingestion of 1B-LSD can produce LSD-like psychedelic experiences. The HTR data also show that replacement of the N1-hydrogen in LSD with a butanoyl group results in a substantial reduction of potency. An extra-sum-of-squares F-test confirmed that 1B-LSD is significantly less potent than LSD in mice (F(1,28)=74.98, p<0.0001). 1P-LSD also showed reduced potency compared to LSD when evaluated in HTR experiments.15 Generally, the potency relationships for hallucinogens in the mouse HTR paradigm closely parallel the human hallucinogenic data.27,30,31 Interpretation of the HTR potency data, however, is complicated by the possibility that 1B-LSD serves as a pro-drug for LSD, as indicated by in vitro assays.12 If 1B-LSD is not the active species and must be hydrolyzed to LSD then extrapolation of mouse potency data to humans is complicated by the possibility of species differences in metabolic enzymes. Nevertheless, although 1B-LSD is not as potent as LSD in mice, it still has relatively high potency compared to many other hallucinogens.30–34
4. Conclusion
1-Butanoyl-LSD (1B-LSD) represents the latest addition to the growing number of lysergamide-based designer drugs. Analytical characterization confirmed that 1B-LSD can be differentiated from its isomer 1P-ETH-LAD under various mass spectral and chromatographic conditions, infrared spectroscopy, and also by NMR. The pharmacological experiments included in this investigation confirmed that 1B-LSD has LSD-like behavioral properties, which adds a multidisciplinary dimension to the characterization of this new psychoactive substance. Clinical studies are warranted to evaluate the potency of 1B-LSD in humans and to define its abuse potential as well as the qualitative nature of its effects.
Supplementary Material
Acknowledgement
The behavioral studies were supported by an award from the National Institute on Drug Abuse (NIDA) (R01 DA041336).
References
- 1.Shulgin A, Shulgin A. TIHKAL: The Continuation. Berkeley, USA: Transform Press; 1997. [Google Scholar]
- 2.Preller KH, Vollenweider FX. Phenomenology, structure, and dynamic of psychedelic states. Curr Top Behav Neurosci. 2018;18:221–256. [DOI] [PubMed] [Google Scholar]
- 3.Passie T. The Science of Microdosing Psychedelics. London, UK: Psychedelic Press; 2019. [Google Scholar]
- 4.Liechti ME. Modern clinical research on LSD. Neuropsychopharmacology. 2017;42(11):2114–2127. [DOI] [PMC free article] [PubMed] [Google Scholar]
- 5.Nichols DE. Dark classics in chemical neuroscience: lysergic acid diethylamide (LSD). ACS Chem Neurosci. 2018;9(10):2331–2343. [DOI] [PubMed] [Google Scholar]
- 6.Troxler F, Hofmann A. Substitutionen am Ringsystem der Lysergsäure I. Substitutionen am Indol-Stickstoff. 43. Mitteilung über Mutterkornalkaloide. Helv Chim Acta. 1957;40(6):1706–1720. [Google Scholar]
- 7.Stoll A, Hofmann A, Troxler F. Stoll A, Hofmann A, Troxler F. Lysergic acid derivatives acylated at the indol nitrogen. Patent No. US2810723, Saul & Co., Newark, USA. 1957.
- 8.Rothlin E. Lysergic acid diethylamide and related substances. Ann N Y Acad Sci. 1957;66:668–676. [DOI] [PubMed] [Google Scholar]
- 9.Isbell H, Miner EJ, Logan CR. Relationships of psychotomimetic to anti-serotonin potencies of congeners of lysergic acid diethylamide (LSD-25). Psychopharmacologia. 1959;1:20–28. [DOI] [PubMed] [Google Scholar]
- 10.Abramson HA. Lysergic acid diethylamide (LSD-25). XXXI. Comparison by questionnaire of psychotomimetic activity of congeners on normal subjects and drug addicts. Br J Psychiatry. 1960;106(444):1120–1123. [PubMed] [Google Scholar]
- 11.Malitz S, Wilkens B, Roehrig WC, Hoch PH. A clinical comparison of three related hallucinogens. Psychiatr Q. 1960;34:333–345. [DOI] [PubMed] [Google Scholar]
- 12.Wagmann L, Richter LHJ, Kehl T, et al. In vitro metabolic fate of nine LSD-based new psychoactive substances and their analytical detectability in different urinary screening procedures. Anal Bioanal Chem. 2019: doi: 10.1007/s00216-00018-01558-00219. [DOI] [PubMed] [Google Scholar]
- 13.European Monitoring Centre for Drugs and Drug Addiction (EMCDDA). EMCDDA-Europol 2016 Annual Report on the implementation of Council Decision 2005/387/JHA. EMCDDA, Lisbon, 2017. Available at:http://www.emcdda.europa.eu/system/files/publications/4724/TDAN17001ENN_PDFWEB.pdf [Accessed 22 April 2019]. [Google Scholar]
- 14.European Monitoring Centre for Drugs and Drug Addiction (EMCDDA). EMCDDA-Europol 2015 Annual Report on the implementation of Council Decision 2005/387/JHA. EMCDDA, Lisbon, 2016. Available at: http://www.emcdda.europa.eu/system/files/publications/2880/TDAS16001ENN.pdf [Accessed 07 February 2016]. [Google Scholar]
- 15.Brandt SD, Kavanagh PV, Westphal F, et al. Return of the lysergamides. Part I: Analytical and behavioural characterization of 1-propionyl-d-lysergic acid diethylamide (1P-LSD). Drug Test Anal. 2016;8(9):891–902. [DOI] [PMC free article] [PubMed] [Google Scholar]
- 16.Brandt SD, Kavanagh PV, Westphal F, et al. Return of the lysergamides. Part III: Analytical characterization of N6-ethyl-6-norlysergic acid diethylamide (ETH-LAD) and 1-propionyl ETH-LAD (1P-ETH-LAD). Drug Test Anal. 2017;9(10):1641–1649. [DOI] [PMC free article] [PubMed] [Google Scholar]
- 17.Shulgin AT. Basic pharmacology and effects In: Laing R, Siegel JA, eds. Hallucinogens. A Forensic Drug Handbook. London: Academic Press; 2003:67–137. [Google Scholar]
- 18.Hoffman AJ, Nichols DE. Synthesis and LSD-like discriminative stimulus properties in a series of N(6)-alkyl norlysergic acid N,N-diethylamide derivatives. J Med Chem. 1985;28(9):1252–1255. [DOI] [PubMed] [Google Scholar]
- 19.Canal CE, Morgan D. Head-twitch response in rodents induced by the hallucinogen 2,5-dimethoxy-4-iodoamphetamine: a comprehensive history, a re-evaluation of mechanisms, and its utility as a model. Drug Test Anal. 2012;4(7–8):556–576. [DOI] [PMC free article] [PubMed] [Google Scholar]
- 20.Halberstadt AL, Geyer MA. Effect of hallucinogens on unconditioned behavior. Curr Top Behav Neurosci. 2018;36:159–199. [DOI] [PMC free article] [PubMed] [Google Scholar]
- 21.Halberstadt AL, Geyer MA. Characterization of the head-twitch response induced by hallucinogens in mice: detection of the behavior based on the dynamics of head movement. Psychopharmacology. 2013;227(4):727–739. [DOI] [PMC free article] [PubMed] [Google Scholar]
- 22.González-Maeso J, Weisstaub NV, Zhou M, et al. Hallucinogens recruit specific cortical 5-HT2A receptor-mediated signaling pathways to affect behavior. Neuron. 2007;53(3):439–452. [DOI] [PubMed] [Google Scholar]
- 23.Brandt SD, Kavanagh PV, Westphal F, et al. Return of the lysergamides. Part II: Analytical and behavioural characterization of N6-allyl-6-norlysergic acid diethylamide (AL-LAD) and (2’S,4’S)-lysergic acid 2,4-dimethylazetidide (LSZ). Drug Test Anal. 2017;9(1):38–50. [DOI] [PMC free article] [PubMed] [Google Scholar]
- 24.Halberstadt AL, Klein LM, Chatha M, et al. Pharmacological characterization of the LSD analog N-ethyl-N-cyclopropyl lysergamide (ECPLA). Psychopharmacology. 2018. [DOI] [PMC free article] [PubMed] [Google Scholar]
- 25.Brandt SD, Kavanagh PV, Twamley B, et al. Return of the lysergamides. Part IV: Analytical and pharmacological characterization of lysergic acid morpholide (LSM-775). Drug Test Anal. 2018;10(2):310–322. [DOI] [PMC free article] [PubMed] [Google Scholar]
- 26.Abramson HA. Lysergic acid diethylamide (LSD-25). XXIX. Response index as a measure of threshold activity of psychotropic drugs in man. J Psychol. 1959;48:65–78. [Google Scholar]
- 27.Halberstadt AL, Geyer MA. Effects of the hallucinogen 2,5-dimethoxy-4-iodophenethylamine (2C-I) and superpotent N-benzyl derivatives on the head twitch response. Neuropharmacology. 2014;77(0):200–207. [DOI] [PMC free article] [PubMed] [Google Scholar]
- 28.Westphal F, Junge T. Massenspektrometrische Unterscheidung von LSD, LAMPA und anderen LSD-Isobaren. Toxichem Krimtech. 2014;81(3):129–135. [Google Scholar]
- 29.Bellman SW. Mass spectral identification of some hallucinogenic drugs. J Assoc Off Anal Chem. 1968;51(1):164–175. [Google Scholar]
- 30.Halberstadt AL, Chatha M, Stratford A, Grill M, Brandt SD. Comparison of the behavioral responses induced by phenylalkylamine hallucinogens and their tetrahydrobenzodifuran (“FLY”) and benzodifuran (“DragonFLY”) analogs. Neuropharmacology. 2019;144:368–376. [DOI] [PMC free article] [PubMed] [Google Scholar]
- 31.Halberstadt AL, Chatha M, Chapman SJ, Brandt SD. Comparison of the behavioral effects of mescaline analogs using the head twitch response in mice. J Psychopharmacol. 2019:269881119826610. [DOI] [PMC free article] [PubMed] [Google Scholar]
- 32.Nichols DE, Sassano MF, Halberstadt AL, et al. N-Benzyl-5-methoxytryptamines as potent serotonin 5-HT2 receptor family agonists and comparison with a series of phenethylamine analogues. ACS Chem Neurosci. 2015;6(7):1165–1175. [DOI] [PMC free article] [PubMed] [Google Scholar]
- 33.Halberstadt AL, van der Zee JVF, Chatha M, Geyer MA, Powell SB. Chronic treatment with a metabotropic mGlu2/3 receptor agonist diminishes behavioral response to a phenethylamine hallucinogen. Psychopharmacology. 2019;236(2):821–830. [DOI] [PMC free article] [PubMed] [Google Scholar]
- 34.Klein LM, Cozzi NV, Daley PF, Brandt SD, Halberstadt AL. Receptor binding profiles and behavioral pharmacology of ring-substituted N,N-diallyltryptamine analogs. Neuropharmacology. 2018;142: 231–239. [DOI] [PMC free article] [PubMed] [Google Scholar]
Associated Data
This section collects any data citations, data availability statements, or supplementary materials included in this article.