

Abstract
Introduction
Deficiencies of plasminogen and plasminogen activator inhibitor type 1 (PAI‐1) are rare disorders of fibrinolysis. Current laboratory assays for analysis of activity of plasminogen and PAI‐1 do not provide an accurate correlation with clinical phenotype.
Methods
The Nijmegen Hemostasis Assay (NHA) was used to simultaneously measure thrombin and plasmin generation in 5 patients with plasminogen deficiency (PLGD) and 10 patients with complete PAI‐1 deficiency. Parameters analysed included: lag time ratio, thrombin peak time ratio, thrombin peak height, thrombin potential (AUC), fibrin lysis time, plasmin peak height and plasmin potential. Parameters were expressed as a percentage compared to a reference value of 53 healthy normal controls.
Results
Patients with PLGD demonstrated a short lag time and thrombin peak time, with normal thrombin peak height but an increased AUC. Plasmin generation was able to be detected in only one (23% plasminogen activity) of the five PLGD patients. All ten PAI‐1 deficient patients demonstrated a short lag and thrombin peak time, low thrombin peak height with normal AUC. Plasmin generation revealed an increased plasmin peak and plasmin potential; interestingly, there was a large variation between individual patients despite all patients having the same homozygous defect.
Conclusion
Patients with either PLGD or PAI‐1 deficiency show distinct abnormalities in plasmin and thrombin generation in the NHA. The differences observed in the propagation phase of thrombin generation may be explained by plasmin generation. These results suggest that disorders of fibrinolysis also influence coagulation and a global assay measuring both activities may better correlate with clinical outcome.
Keywords: genotype, phenotype, plasmin generation, plasminogen activator inhibitor type 1 deficiency, plasminogen deficiency, thrombin generation
1. INTRODUCTION
Plasminogen and plasminogen activator inhibitor type 1 (PAI‐1) are proteins of the fibrinolytic pathway.1 Plasminogen is a zymogen activated by tissue‐type plasminogen activator enzymes to produce plasmin, the central enzyme in fibrinolytic pathway that dissolves fibrin networks. PLGD results in the development of woody pseudomembranes on mucosal surfaces. Although ligneous conjunctivitis is a characteristic manifestation of PLGD, involvement of the gingiva, oral cavity, tracheobronchial tree, middle ear, gastrointestinal and urogenital tracts, and central nervous system are described.2, 3, 4, 5, 6, 7 There are two sub‐types of PLGD: type 1 is a quantitative deficiency and type 2 a qualitative deficiency. Patients with type 1 PLGD clinically present with development of pseudomembranes.2 Despite the central role of plasmin in fibrinolysis, PLGD is not primarily associated with thrombotic disease.8, 9, 10
PAI‐1 downregulates fibrinolysis through inhibition of tissue‐type plasminogen activator (tPA) and urokinase plasminogen activator (uPA). Homozygous PAI‐1 deficiency is associated with increased fibrinolysis resulting in a moderate clinical bleeding phenotype with haemorrhage associated with injury, surgery or invasive procedures especially in areas with increased fibrinolysis. Reported clinical manifestations include abnormal epistaxis, oral bleeding with injury or dental extractions, haematoma formation, maenorrhagia, haemorrhagic ovarian cysts, haemorrhage in pregnancy and intracranial bleeding with injury. 11, 12, 13, 14, 15 An association with delayed wound healing has also been described.15 Heterozygous PAI‐1 deficiency is not associated with abnormal bleeding, even after haemostatic challenge.12 PAI‐1 levels exhibit a diurnal variation and are therefore usually measured in the morning in a fasting state. The diagnosis of PAI‐1 deficiency is challenging as current PAI‐1 activity assays include ‘zero’ within the normal range and therefore do not discriminate between normal and deficient individuals; a PAI‐1 antigenic assay is available. The diagnosis of a dysproteinemic PAI‐1 deficiency (abnormal PAI‐1 activity with detectable PAI‐1 antigen) cannot currently be reliably diagnosed due to limitations in the PAI‐1 activity assay. PAI‐1 deficiency is only reliably diagnosed in the absence of a circulating antigen.16
For both PLGD and PAI‐1 deficiencies, the ability to correlate the results of commonly available activity and antigenic assays to clinical symptoms is limited. The NHA is a global haemostatic assay that simultaneously measures thrombin and plasmin generation in a single well.17 The impetus to develop the NHA was based upon the need to evaluate overall haemostatic potential in patients utilizing fibrinolytic therapy (eg, tPA, urokinase) where concomitant administration of anticoagulants is required.18 The simultaneous measurement of thrombin and plasmin generation in one assay has limited to no reported cases of the rare fibrinolytic states of PLGD and complete PAI‐1 deficiency, respectively.19, 20
The NHA was used to evaluate simultaneous thrombin and plasmin generation in five patients with PLGD and ten patients with complete PAI‐1 deficiency who carry the same homozygous frameshift mutation. In addition, the results of the NHA were evaluated for correlation to phenotypic expression of these two rare fibrinolytic deficiencies. Overall, it was hypothesized that plasmin generation would be decreased or absent in PLGD and enhanced in PAI‐1 deficiency, and that thrombin generation would be abnormal in individuals with increased plasmin generation.
2. MATERIALS AND METHODS
2.1. Patients
Patients were enrolled at the Indiana Hemophilia and Thrombosis Center (IN, USA). The cohorts evaluated included 5 patients with PLGD and 10 patients with PAI‐1 deficiency. Both groups are described in detail in the section ‘Results—clinical and laboratory phenotype’.
IRB approval and consent were obtained according to GCP. The following data variables were collected on each subject: genotype, clinical phenotype; in the PLGD patients, the plasminogen activity and antigen levels were collected from medical records. Blood was collected with the subject at rest in the seated position by atraumatic peripheral venipuncture technique with minimal applied stasis into BD Vacutainer 3.2% buffered sodium citrate siliconized blood collection tubes (Becton‐Dickinson), after collection of the initial 1 mL of blood into a discard tube. Specimens were centrifuged for 15 minutes at 4°C and 2500× g, and the plasma supernatant was then centrifuged for an additional 15 minutes at the same settings to remove residual platelets. Plasma found to be icteric or lipemic was excluded from analysis in assays that measure optical density or fluorescence intensity. Platelet‐poor plasma (PPP) samples were aliquoted into 1.5 mL copolymer polypropylene long‐term freezer storage tubes with O‐ring screw caps (USA Scientific) and stored at −70°C until shipment or analysis. Plasma samples for the NHA were sent on dry ice to the Radboud University Medical Center, Nijmegen, the Netherlands. Plasma samples were defrosted only once. Simultaneous thrombin and plasmin generation curves were performed in the Radboudumc, Nijmegen The Netherlands.
2.2. Plasminogen and PAI‐1 assays
A documented rare frameshift mutation (c.699_700dupTA) in the SERPINE1 gene results in complete deficiency of PAI‐1 activity and antigen.21 The 10 enrolled PAI‐1 deficient patients are documented to be homozygous for this mutation. This mutation results in undetectable PAI‐1 antigen and activity levels.12 Therefore, PAI‐1 activity/antigen levels were not assayed. Plasminogen activity levels were measured by chromogenic assay (HemosIL Plasminogen) and plasminogen antigen levels by a nephelometric assay.
2.3. Nijmegen hemostasis assay
The Nijmegen Hemostasis Assay (NHA) evaluates haemostasis through simultaneous measurement of thrombin generation (TG) and plasmin generation (PG) as a function of coagulation and fibrinolysis, respectively. Thrombin generation is initiated with a low tissue factor concentration, and plasmin generation initiated by tPA which is dependent on fibrin formation. In normal pooled plasma, the delay in plasmin generation is dependent on thrombin‐activatable fibrinolysis activator. A complete description of the assay and its validation procedure has been published previously.17 The NHA is characterized by seven parameters as shown in Figure 1. To perform the NHA, 80 µL of patient plasma was mixed with 2 µL crude cephalin (Roche), 2 µL tissue factor (Innovin®, Healthcare Diagnostics, final concentration corresponding to approximately 0.3 PM), 4 µL fluorescent thrombin‐specific substrate Bz‐β‐Ala‐Gly‐Arg‐7‐amino‐4‐methylcoumarin (final concentration 833 µmol/L) and 2 µL fluorescent plasmin‐specific substrate (Cbz‐L‐phenylalanyl‐L‐arginyl)‐rhodamine‐morpholino urea (final concentration 33 µmol/L). Thrombin and plasmin substrates are from Chiralix and dissolved in Tris Buffered Saline (TBS, 50 mmol/L Tris, 150 mmol/L NaCl buffer pH 7.4). The NHA was started with 18 µL TBS buffer containing tPA (Actilyse®, Boehringer Ingelheim, final concentration 193 IU/mL) and 4 µL CaCl2 to a final concentration of 16.7 mmol/L (from Merck), resulting in a total volume of 120 µL. Fluorescence was measured alternately every 30 seconds for 70 minutes in a 37°C thermostated fluorometer (Fluostar Optima Fluorometer, BMG Labtechnologies). Prewarmed black polystyrene Fluotrac microtiter plates (Greiner Bio‐One) were used. The thrombin‐specific substrate was excited at 355 nm and measured at an emission wavelength of 460 nm. The plasmin‐specific substrate was excited at 485 nm and measured at an emission wavelength of 520 nm. Thrombin and plasmin proteolytic activities were calculated by comparing the arbitrary fluorescence values to known amounts from a calibration curve prepared with human α‐thrombin and human plasmin, respectively. The calibration curve demonstrated linear substrate cleavage throughout the reaction, and the first derivative of the calibration curve was used to convert the fluorescence tracing to thrombin and plasmin concentrations, respectively. The first derivative was calculated from the fluorescent cumulative signal, and all parameters of the NHA were determined by a Microsoft Excel macro program in Microsoft Visual Basic (version 11.1.1 [Microsoft Corporation]) as described elsewhere.17 The one difference between the current NHA compared to that described previously, is improved characteristics of the plasmin substrate. The new plasmin substrate contains one peptide chain, and therefore overcomes the previous observation of increased plasmin generation after complete clot lysis noted in the rhodamine‐based plasmin substrate with two peptide chains. For each run of the NHA, a control plasma was included for quality assurance. The control plasma is a pooled plasma of equal amounts of platelet‐free blood plasma from 10 healthy donors aged 18‐70 years, with representing males and females equally; females were not on oral contraceptives or pregnant. NHA results are specified as a percentage compared to a normal level, derived by the mean of 53 normal controls. For all results, the mean of two measurements was taken.
Figure 1.
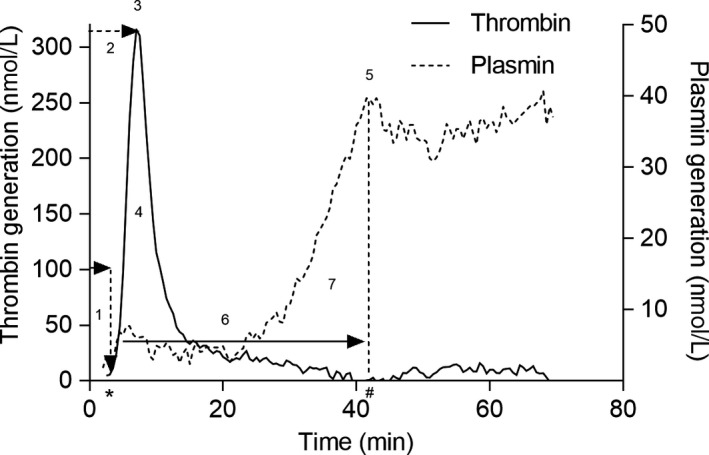
The Nijmegen Hemostasis Assay. (1) lag time, the time at which thrombin formation is initiated; (2) thrombin peak time, that is the time when thrombin production reaches maximal velocity; (3) thrombin peak height, the maximal velocity of thrombin generation; (4) the area under the curve (AUC, relates to the thrombin potential); 5) plasmin peak height, the maximal velocity of plasmin production and; (6) fibrin lysis time (FLT), the time between the initiation of thrombin generation and the time plasmin generation reaches maximal velocity; (7) plasmin potential, area under the curve that represents the total amount of plasmin generated
2.4. Statistical analysis
Values are reported as medians. Statistical analysis was performed using IBM SPSS Statistics 22. Thrombin and plasmin generation parameters were analysed using the Mann‐Whitney U test by comparison to a reference (mean values for 2 runs of 53 normal controls). The Spearman correlation was used to correlate the laboratory phenotype with the results of the NHA. All P‐values are two‐sided. P‐values lower than .05 were considered statistically significant.
3. RESULTS
3.1. Genotype
Genotype information for PLGD patients is presented in Table 1. The 10 PAI‐1 deficient patients were homozygous for the mutation: c.699_700dupTA.12
Table 1.
The Nijmegen hemostasis assay parameters in patients with a plasminogen deficiency
| Genotype | Age (y) | Sex | Plasminogen activity level |
Plasminogen antigen level (mg/L) |
Clinical phenotype | Lag time (min) | Thrombin peak time (min) | Thrombin peak height (nmol/L) | ETP (nM) | Fibrin lysis time (min) | Plasmin peak height (nmol/L) | Plasmin potential (nmol/L) | |
|---|---|---|---|---|---|---|---|---|---|---|---|---|---|
| Reference median a | 5,0 | 9,5 | 334,5 | 2073 | 30,3 | 10 | 89 | ||||||
| Reference 25 perc | 4.38 | 8,5 | 299 | 1878 | 21,8 | 5 | 36 | ||||||
| Reference 75 perc | 6,13 | 11,0 | 399 | 2214 | 41 | 17 | 202 | ||||||
| 1 | c.112A > G p.Lys38Glu; c.1468C > T p.Arg490X | 37 | M | 19% | 25 | Ligneous conjunctivitis oral lesions | 2.0 | 6.0 | 428 | 3367 |
ND |
ND | ND |
| 2 | Unknown | 10 | M | 16% | 64 | Ligneous conjunctivitis | 3.5 | 9.8 | 156 | 2002 | ND | ND | ND |
| 3 | c.112A > G p.Lys38Glu; c.704G > A p.Arg235His | 6 | F | 5% | 64 | Ligneous conjunctivitis | 2.0 | 5.0 | 302 | 2530 | ND | ND | ND |
| 4 | Homozygous c.112A > G p.Lys38Glu | 7 | F | 23% | 34 | Ligneous conjunctivitis | 2.0 | 4.8 | 303 | 3218 | ND | 5.0 | ND |
| 5 | Homozygous c.23T > Cp.Leu8Pro | 49 | F | 7% | 12 | Ligneous conjunctivitis oral lesions | 2.5 | 6.0 | 360 | 2879 | ND | ND | ND |
| Median | – | – | – | – | 2.0 | 6.0 | 303 | 2879 | ND | ND | ND | ||
| 25 perc | – | – | – | – | 2.0 | 4.9 | 229 | 2266 | ND | ND | ND | ||
| 75 perc | – | – | – | – | 3.0 | 7.9 | 394 | 3292 | ND | ND | ND |
Abbreviation: ND = not to be determined.
N = 53.
3.2. Clinical and laboratory phenotype
Five patients including 3 females (6, 7, 49 years) and 2 males (10, 37 years) with plasminogen deficiency were evaluated. (Table 1) Patients with PLGD had plasminogen activity levels ranging from 5 IU/dL to 23 IU/dL (normal level >51 IU/dL). Plasminogen antigen levels ranged from 12 mg/L to 64 mg/L (normal level >90 mg/L) consistent with type 1 deficiency. None of the PLGD patients experienced a thrombotic or haemorrhagic event. All patients had experienced ligneous conjunctivitis, and two patients had ligneous gingivitis as well. Samples were obtained without exposure to exogenous therapy.
The PAI‐1 deficient patients had absent PAI‐1 activity and antigen levels, inferred by a known genetic null mutation. Of the 10 patients evaluated there were 7 females (ages 16‐37 years) and 3 males (ages 16‐35 years; Table 2). PAI‐1 deficient patients experienced bleeding manifestations of varying severity. Maenorrhagia was most prevalent, occurring in the majority of females (5 of 7); other symptoms included major bleeding such as intracranial haemorrhage after trauma, other bleeding events associated with injury, trauma or invasive procedures, antenatal and postpartum bleeding in gravid females, haemorrhagic rupture of ovarian cyst and minor mucocutaneous bleeding. Patients with at least one severe bleeding manifestation such as haemarthrosis, central nervous system bleeding, gastrointestinal bleeding or umbilical cord bleeding were considered major bleeders, and those with only mucocutaneous bleeding were categorized as minor bleeders as in Table 2. All of the patients are currently utilizing on‐demand treatment with oral antifibrinolytics, either tranexamic acid or ε‐aminocaproic acid; samples were obtained without use of exogenous therapy for a period of time sufficient to assure results representing only the deficiency state.
Table 2.
The Nijmegen hemostasis assay parameters in patients with a plasminogen activator inhibitor type 1 deficiency
| Age (y) | Sex | Bleeding phenotype | Lag time (min) | Thrombin peak time (min) | Thrombin peak height (nmol/L) | ETP (nmol/L) | Fibrin Lysis Time (min) | Plasmin peak height (nmol/L) | Plasmin potential (nmol/L) | |
|---|---|---|---|---|---|---|---|---|---|---|
| Reference median a | 5,0 | 9,5 | 334,5 | 2073 | 30,3 | 10 | 89 | |||
| Reference 25 perc | 4.38 | 8,5 | 299 | 1878 | 21,8 | 5 | 36 | |||
| Reference 75 perc | 6,13 | 11,0 | 399 | 2214 | 41 | 17 | 202 | |||
| 1 | 24 | F | Minor | 2.5 | 7.8 | 220 | 2369 | 23.8 | 37 | 342 |
| 2 | 27 | F | Minor | 3.0 | 7.0 | 391 | 3376 | 24.8 | 47 | 474 |
| 3 | 16 | M | Minor | 2.5 | 6.5 | 226 | 2702 | 34.8 | 26.5 | 294 |
| 4 | 36 | F | Minor | 3.5 | 9.0 | 229 | 2256 | 31.5 | 27 | 331 |
| 5 | 33 | F | Minor | 3.0 | 8.3 | 237 | 2145 | 23.3 | 37.5 | 389 |
| 6 | 22 | M | Major | 3.0 | 8.0 | 188 | 1797 | 25.8 | 33 | 387 |
| 7 | 26 | F | Minor | 3.5 | 11.0 | 211 | 2655 | 35.0 | 31 | 348 |
| 8 | 37 | F | Minor | 2.5 | 6.8 | 264 | 1756 | 31.8 | 37.5 | 425 |
| 9 | 35 | M | Major | 3.5 | 9.0 | 248 | 1926 | 33.5 | 16 | 158 |
| 10 | 16 | F | Major | 3.0 | 7.5 | 234 | 1786 | 32.5 | 18 | 201 |
| Median | 3.0 | 7.9 | 231 | 2201 | 31.6 | 32.0 | 345 | |||
| 25 perc | 2.5 | 6.9 | 217 | 1794 | 24.5 | 24.4 | 271 | |||
| 75 perc | 3.5 | 9.0 | 252 | 2666 | 33.8 | 37.5 | 398 |
N = 53.
3.3. Thrombin and plasmin generation
Thrombin and plasmin generation curves measured simultaneously in a single reaction in PLGD patients are shown in Figure 2A and 2B. Results of the NHA parameters of individual patients as well as patient characteristics are shown in Table 1. PLGD patients demonstrated a short initiation with a median lag time of 38% (P < .001, IQR 38%‐57%) and thrombin peak time of 59% (P < .001, IQR 48%‐78%) as compared to the reference group of healthy controls. Propagation was relatively normal with a thrombin peak height of 87% (IQR 65%‐113%) with slightly enhanced AUC of 139% (P < .001, IQR 109%‐159%). No measurable plasmin generation was observed in PLGD patients, except for patient 4, whose baseline plasminogen activity level was 23%.
Figure 2.
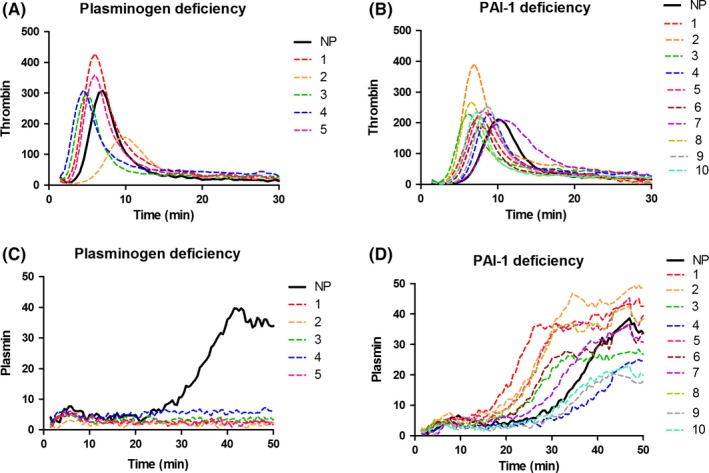
Thrombin (A/C) and plasmin (B/D) generation in plasma of patients with plasminogen deficiency (A/B) and plasminogen activator inhibitor type 1 deficiency (C/D). NP, normal pooled plasma
Figure 2C and 2D show the thrombin and plasmin generation curves of patients with PAI‐1 deficiency. The NHA corresponding parameters and patient characteristics are listed in Table 2. When compared to healthy controls, the initiation showed a median lag time of 57% (P < .001, IQR 47%‐66%), and thrombin peak time of 77% (P < .001, IQR 68%‐88%); thrombin peak height was low with a median of 67% (P < .001, IQR 62%‐80%), with a normal AUC of 106% (IQR 86%‐124%), a normal fibrin lysis time (median 104%, IQR 80%‐111%) with high plasmin peak height and plasmin potential (median with IQR 254%, 193%‐298% and 232%, 182%‐267%, respectively, both P < .001).
The NHA results in PLGD and PAI‐1 deficient patients as compared to the reference group of healthy controls are displayed in Figure 3.
Figure 3.
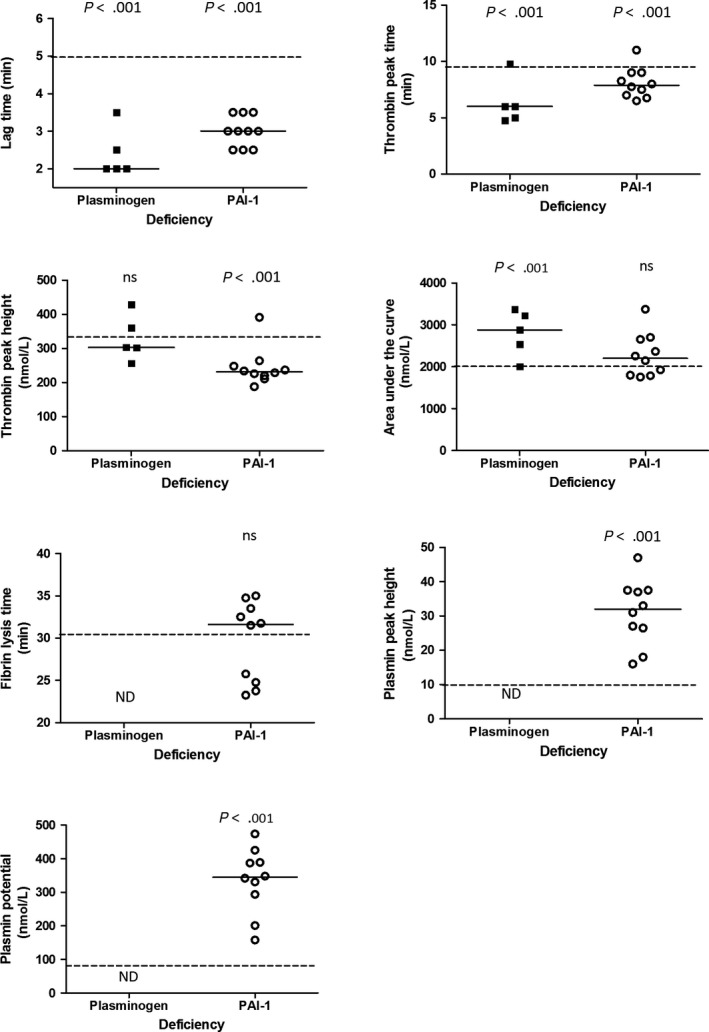
Results of The Nijmegen hemostasis assay parameters in patients with a plasminogen activator inhibitor type 1 deficiency and plasminogen deficiency, compared to the reference group (dotted line). Median of the patient group is shown by the solid line
3.4. Correlation with laboratory phenotype
There was no strong correlation between the parameters of the NHA and plasminogen activity and antigen levels. A moderate correlation of 0.60 (P = .28) was found between thrombin potential expressed as AUC and plasminogen activity. There were moderate negative correlations between plasminogen antigen levels and thrombin peak height and AUC of −0.62 (P = .27) and −0.60 (P = .29), respectively. As PAI‐1 deficient patients had undetectable PAI‐1 activity and antigen, no correlation calculations were performed for the NHA parameters in this population.
3.5. Correlation with clinical phenotype
The clinical manifestations of PLGD patients were not clearly associated with plasminogen activity level (range 7%‐23%). Patients with lower plasminogen antigen levels trended towards multiple site involvement as compared to patients with a higher antigen levels; due to the small sample size, no conclusive interpretations can be drawn. There were no significant differences in the NHA parameters between different PLGD patients.
When comparing the 3 patients with PAI‐1 deficiency categorized with major bleeding events to the 7 patients with minor bleeding, no differences were observed in lag time ratio, thrombin peak time ratio, thrombin peak height and fibrin lysis time ratio. There were trends towards lower AUC (median 86% vs 114%), lower plasmin peak height (median 143% vs 294%) and lower plasmin potential (median 135% vs 234%) in the major vs minor bleeding event group, respectively. These differences were not statistically significant.
4. DISCUSSION
We report the analysis of haemostatic balance as determined in the NHA in two ultra‐rare fibrinolytic deficiency states, PLGD and PAI‐1; the NHA results were used in an initial effort to evaluate an association with clinical phenotype. Type 1 PLGD patients do not have an increased risk of thrombosis despite the pivotal role of fibrinolytic enzymes in limiting excessive fibrin formation. In contrast, a deficiency of the fibrinolytic inhibitor, PAI‐1, results in a pronounced increase in fibrinolysis with resultant haemorrhagic manifestations. The NHA results illustrate virtually absent plasmin generation in PLGD patients and high, yet variable, plasmin generation in PAI‐1 deficient patients.
There was no measurable plasmin generation in PLGD patients, except in patient 4. Patient 4 was homozygous for the Lys38Glu (formerly known as K19E) mutation, which is associated with higher plasminogen plasma levels and a milder clinical course when compared with other plasminogen gene variations.3 Consistent with reports of patients with the Lys38Glu mutation, patient 4 demonstrated the highest plasminogen levels. Of interest in the PLDG patients overall was an observed increased thrombin potential with normal thrombin peak height. Theoretically, PLGD patients could develop denser fibrin structure due to the absence of plasmin, which could lead to changes in thrombin inactivation by inhibitors such as antithrombin (AT) or fibrin, possibly contributing to a normal thrombin peak height but prolonged thrombin generation curve, and a relatively high AUC. It would therefore be interesting to perform plasma turbidity assays in these PLGD patients, to gain increased data on clot density.22 In contrast, two prior reports suggested a normal or low thrombin potential in PLGD.19, 20 These prior studies utilized a commercial depleted product as the plasminogen deficient plasma; therefore, these results may not be equivalent to samples obtained from patients with a documented deficiency state as used in our report. None of the PLGD patients who participated in this analysis experienced a thrombosis; the clinical picture is not intuitively consistent with the observed increased thrombin potential with normal thrombin peak height. Therefore, it would be interesting to perform plasma turbidity assays in these patients, to gain more information on clot density or the level of thrombin‐antithrombin levels as we expect that D‐dimer levels are absent.
In PAI‐1 deficient patients, low thrombin peak height with normal AUC was observed. These results can be explained by accelerated fibrin clearance in these patients, as previously seen in patients with afibrinogenemia.23 The absence of fibrin results in an increase of free thrombin, as a lesser amount of thrombin is bound to available fibrin; this leads to increased thrombin inactivation by antithrombin and other thrombin inhibitors, thus explaining the lower thrombin peak height. However, as fibrin is a sink for thrombin, the absence of fibrin leads to prolonged thrombin generation, illustrated by a normal AUC despite low thrombin peak height. On the other hand, PAI‐1 deficient patients demonstrated extremely high values of plasmin peak height and plasmin potential, consistent with accelerated fibrinolysis. There was significant variation between individual patients, as shown in Figure 1D. The observed high variability in plasmin generation curves of PAI‐1 deficient patients is interesting given their unifying genetic mutation overlying a fairly uniform genetic background (Old Order Amish); this observation might provide a basis to understand the clinical phenotypic heterogeneity of bleeding in these patients and warrants further investigation. Similarly, the fact that all evaluated PAI‐1 deficient patients with no detectable PAI‐1 activity or antigen had a marked difference in plasmin generation, highlights the issues of weak correlation between genotype, clinical and laboratory phenotype. It remains challenging to conduct further research to ascertain the correlation between the clinical and laboratory phenotype in an ultra‐rare bleeding disorder such as PAI‐1 deficiency.
For both PLGD and PAI‐1 deficiency, there was a short thrombin lag time and time to thrombin peak observed in the NHA. The PAI‐1 deficient population exhibited very high plasmin generation values. As plasmin, aside from dissolving fibrin, also functions as an activator of a variety of proteins, it is possible that the large amount of generated plasmin in these patients activates coagulation factors leading to accelerated thrombin formation. It has been established that fibrin architecture has an effect on thrombin generation.24 However, as this effect was also seen in PLGD patients in absence of plasmin generation, the short initiation times could also be caused by preanalytical variability such as sample processing, transportation and storage, and as such should be interpreted with caution. These findings need confirmation in further studies. Our group also reported reduced thrombin lag times in other rare bleeding disorders affecting fibrinolysis including afibrinogenemia and FXIII deficiencies.23 These results are comparable to results of others, who reported shortened lag time with afibrinogenemia and with FXIII deficiency as well.25, 26 The latter group argued that thrombin generation is supported by the action of altered fibrin caused by FXIII deficiency, similar to the effect of Glycin‐Prolin‐Arginin‐Prolin (GPRP), although our results did not show these effects with GPRP titrations.17 GPRP inhibits fibrinogen polymerization by direct binding to the fibrinogen polymerization sites and modifying the glutamine residues in the α‐ and γ‐chains of fibrinogen. GPRP has been shown to inhibit ADP‐induced platelet aggregation and inhibits fibrin protofibril lateral aggregation and thereby promotes TG in normal plasma. The novel results reported here suggest that enhanced thrombin generation may also be due to altered fibrin structure. An explanation for shortened lag time in a patient with PLGD may result due to timely contraction of the clot, leading to less fibrin surface to which thrombin may bind, leading to relatively higher thrombin plasma concentrations and shortened lag times.
In the case of shortened lag times in patients with absent PAI‐1, the higher plasmin levels generated and increased fibrinolysis may result in partial activation of coagulation proteins. For instance, plasmin influences coagulation by (in)activation of factor VII, factor VIII, factor IX, factor X and factor XII. It has also been demonstrated that FVa is degraded by plasmin, although inactivation was preceded by a brief phase of activation.27, 28, 29, 30, 31, 32 The cumulative list of potential coagulation proteins cleaved by plasmin may result in a shortened lag time.
This study has a few limitations. Due to limited plasma availability, additional laboratory tests such as coagulation screening assays, euglobulin clot lysis assays and other coagulation factor levels could not be performed. Secondly, although simultaneous measurement of thrombin and plasmin generation aims to mimic the in vivo milieu, other influences contributing to haemostasis cannot be accounted for in such assays, eg endothelium, platelets and leucocytes. Although coagulation and fibrinolysis are often considered as two consecutive processes, in vivo they can occur simultaneously. In the NHA, where thrombin and plasmin are triggered simultaneously, tPA can activate plasminogen after fibrin has been formed.33 Therefore, this is partly a sequential process and there may be in vivo effects that cannot be measured in vitro. Lastly, the small patient sample size prohibits an in‐depth analysis of significance for phenotype and genotype correlations.
Despite these limitations, this report is the first study to investigate simultaneous measurement of thrombin and plasmin generation in two ultra‐rare fibrinolytic pathway deficiencies, PLGD and PAI‐1 deficiency. Both patient cohorts represent well‐characterized fibrinolytic disorders. Patients with PLGD and PAI‐1 deficiency showed distinct patterns of thrombin and plasmin generation. There was a clear difference between the two deficiencies in the propagation of coagulation, potentially explained by the difference in plasmin generation. Large international multicentre clinical studies that incorporate rare coagulation disorders such as these will increase our understanding of their overall haemostatic balance.
DISCLOSURE
JLS, SEMS, KFB, MvG, KV, SG, BMH and ADS have no conflicts of interest to declare. WvH has no conflict of interest regarding this study. WvH received unrestricted grants from Bayer, Shire (formerly Baxalta, Baxter), Novo Nordisk and CSL Behring. WvH is the founder and CSE of Enzyre BV, a Radboudumc spin‐off company.
Saes JL, Schols SEM, Betbadal KF, et al. Thrombin and plasmin generation in patients with plasminogen or plasminogen activator inhibitor type 1 deficiency. Haemophilia. 2019;25:1073–1082. 10.1111/hae.13842
REFERENCES
- 1. Saes JL, Schols S, van Heerde WL, Nijziel MR. Hemorrhagic disorders of fibrinolysis: a clinical review. J Thromb Haemost. 2018;16(8):1498‐1509. [DOI] [PubMed] [Google Scholar]
- 2. Mehta R, Shapiro AD. Plasminogen deficiency. Haemophilia. 2008;14(6):1261‐1268. [DOI] [PubMed] [Google Scholar]
- 3. Tefs K, Gueorguieva M, Klammt J, et al. Molecular and clinical spectrum of type I plasminogen deficiency: a series of 50 patients. Blood. 2006;108(9):3021‐3026. [DOI] [PubMed] [Google Scholar]
- 4. Mingers A‐M, Heimburger N, Zeitler P, Kreth H, Schuster V. Homozygous type I plasminogen deficiency. Semin Thromb Hemost. 1997;23(3):259‐269. [DOI] [PubMed] [Google Scholar]
- 5. Sivolella S, De Biagi M, Sartori MT, Berengo M, Bressan E. Destructive membranous periodontal disease (ligneous gingivitis): a literature review. J Periodontol. 2012;83(4):465‐476. [DOI] [PubMed] [Google Scholar]
- 6. Taube ET, Frangini S, Caselitz J, et al. Ligneous cervicitis in a woman with plasminogen deficiency associated with an atypical form of microglandular hyperplasia: a case report and review of literature. Int J Gynecol Pathol. 2013;32(3):329‐334. [DOI] [PubMed] [Google Scholar]
- 7. Lotan TL, Tefs K, Schuster V, et al. Inherited plasminogen deficiency presenting as ligneous vaginitis: a case report with molecular correlation and review of the literature. Hum Pathol. 2007;38(10):1569‐1575. [DOI] [PubMed] [Google Scholar]
- 8. Sartori MT, Patrassi GM, Theodoridis P, Perin A, Pietrogrande F, Girolami A. Heterozygous type I plasminogen deficiency is associated with an increased risk for thrombosis: a statistical analysis in 20 kindreds. Blood Coagul Fibrinolysis. 1994;5(6):889‐893. [DOI] [PubMed] [Google Scholar]
- 9. Demarmels Biasiutti F, Sulzer I, Stucki B, Wuillemin WA, Furlan M, Lämmle B. Is plasminogen deficiency a thrombotic risk factor? A study on 23 thrombophilic patients and their family members. Thromb Haemost. 1998;80(1):167‐170. [PubMed] [Google Scholar]
- 10. Brandt JT. Plasminogen and tissue‐type plasminogen activator deficiency as risk factors for thromboembolic disease. Arch Pathol Lab Med. 2002;126(11):1376‐1381. [DOI] [PubMed] [Google Scholar]
- 11. Mehta R, Shapiro AD. Plasminogen activator inhibitor type 1 deficiency. Haemophilia. 2008;14(6):1255‐1260. [DOI] [PubMed] [Google Scholar]
- 12. Fay WP, Parker AC, Condrey LR, Shapiro AD. Human plasminogen activator inhibitor‐1 (PAI‐1) deficiency: characterization of a large kindred with a null mutation in the PAI‐1 gene. Blood. 1997;90(1):204‐208. [PubMed] [Google Scholar]
- 13. Minowa H, Takahashi Y, Tanaka T, et al. Four cases of bleeding diathesis in children due to congenital plasminogen activator inhibitor‐1 deficiency. Haemostasis. 1999;29(5):286‐291. [DOI] [PubMed] [Google Scholar]
- 14. Lee MH, Vosburgh E, Anderson K, McDonagh J. Deficiency of plasma plasminogen activator inhibitor 1 results in hyperfibrinolytic bleeding. Blood. 1993;81(9):2357‐2362. [PubMed] [Google Scholar]
- 15. Iwaki T, Tanaka A, Miyawaki Y, et al. Life‐threatening hemorrhage and prolonged wound healing are remarkable phenotypes manifested by complete plasminogen activator inhibitor‐1 deficiency in humans. J Thromb Haemost. 2011;9(6):1200‐1206. [DOI] [PubMed] [Google Scholar]
- 16. Heiman M, Gupta S, Khan SS, Vaughan DE, Shapiro AD. Complete plasminogen activator inhibitor 1 deficiency In Adam MP, Ardinger HH, Pagon RA, et al, eds. GeneReviews®. Seattle, WA: University of Washington, Seattle University of Washington; 2017. GeneReviews is a registered trademark of the University of Washington, Seattle. All rights reserved. [Google Scholar]
- 17. Geffen MV, Loof A, Lap P, et al. A novel hemostasis assay for the simultaneous measurement of coagulation and fibrinolysis. Hematology. 2011;16(6):327‐336. [DOI] [PubMed] [Google Scholar]
- 18. Terry KJ, Buckley LF, Aldemerdash A, Fanikos J, Dell'Orfano H. Fibrinolytic and anticoagulation therapy in patients undergoing ultrasound‐assisted catheter‐directed thrombolysis for pulmonary embolism. Cardiovasc Hematol Disord Drug Targets. 2017;17(2):132‐135. [DOI] [PubMed] [Google Scholar]
- 19. Matsumoto T, Nogami K, Shima M. Simultaneous measurement of thrombin and plasmin generation to assess the interplay between coagulation and fibrinolysis. Thromb Haemost. 2013;110(4):761‐768. [DOI] [PubMed] [Google Scholar]
- 20. Simpson ML, Goldenberg NA, Jacobson LJ, Bombardier CG, Hathaway WE, Manco‐Johnson MJ. Simultaneous thrombin and plasmin generation capacities in normal and abnormal states of coagulation and fibrinolysis in children and adults. Thromb Res. 2011;127(4):317‐323. [DOI] [PubMed] [Google Scholar]
- 21. Fay WP, Shapiro AD, Shih JL, Schleef RR, Ginsburg D. Brief report: complete deficiency of plasminogen‐activator inhibitor type 1 due to a frameshift mutation. N Engl J Med. 1992;327(24):1729‐1733. [DOI] [PubMed] [Google Scholar]
- 22. Meltzer ME, Lisman T, de Groot PG, et al. Venous thrombosis risk associated with plasma hypofibrinolysis is explained by elevated plasma levels of TAFI and PAI‐1. Blood. 2010;116(1):113‐121. [DOI] [PubMed] [Google Scholar]
- 23. Van Geffen M, Menegatti M, Loof A, et al. Retrospective evaluation of bleeding tendency and simultaneous thrombin and plasmin generation in patients with rare bleeding disorders. Haemophilia. 2012;18(4):630‐638. [DOI] [PubMed] [Google Scholar]
- 24. Kumar R, Beguin S, Hemker HC. The effect of fibrin clots and clot‐bound thrombin on the development of platelet procoagulant activity. Thromb Haemost. 1995;74(3):962‐968. [PubMed] [Google Scholar]
- 25. Young GA, Carmona R, Cano Garcia V. Thromboelastography and thrombin generation assay in inherited afibrinogenemia. Haemophilia. 2018;24(6):e410‐e416. [DOI] [PubMed] [Google Scholar]
- 26. Pitkänen HH, Jouppila A, Lemponen M, Ilmakunnas M, Ahonen J, Lassila R. Factor XIII deficiency enhances thrombin generation due to impaired fibrin polymerization ‐ an effect corrected by factor XIII replacement. Thromb Res. 2017;149:56‐61. [DOI] [PubMed] [Google Scholar]
- 27. Laake K, Osterud B. Activation of purified plasma factor VII by human plasmin, plasma kallikrein, and activated components of the human intrinsic blood coagulation system. Thromb Res. 1974;5(6):759‐772. [DOI] [PubMed] [Google Scholar]
- 28. Rick ME, Krizek DM. Platelets modulate the proteolysis of factor VIII: C protein by plasmin. Blood. 1986;67(6):1649‐1654. [PubMed] [Google Scholar]
- 29. Osterud B, Laake K, Prydz H. The activation of human factor IX. Thromb Diath Haemorrh. 1975;33(3):553‐563. [PubMed] [Google Scholar]
- 30. Grundy JE, Lavigne N, Hirama T, MacKenzie CR, Pryzdial EL. Binding of plasminogen and tissue plasminogen activator to plasmin‐modulated factor X and factor Xa. Biochemistry. 2001;40(21):6293‐6302. [DOI] [PubMed] [Google Scholar]
- 31. Ewald GA, Eisenberg PR. Plasmin‐mediated activation of contact system in response to pharmacological thrombolysis. Circulation. 1995;91(1):28‐36. [DOI] [PubMed] [Google Scholar]
- 32. Omar MN, Mann KG. Inactivation of factor Va by plasmin. J Biol Chem. 1987;262(20):9750‐9755. [PubMed] [Google Scholar]
- 33. Kim PY, Tieu LD, Stafford AR, Fredenburgh JC, Weitz JI. A high affinity interaction of plasminogen with fibrin is not essential for efficient activation by tissue‐type plasminogen activator. J Biol Chem. 2012;287(7):4652‐4661. [DOI] [PMC free article] [PubMed] [Google Scholar]