

Abstract
Aims
Reducing alcohol consumption is one treatment approach for alcohol‐dependent patients. This study compared nalmefene 20 mg and 10 mg with placebo, combined with psychosocial support, in alcohol‐dependent Japanese patients with a high or very high drinking risk level (DRL).
Methods
This was a multicenter, randomized, double‐blind, phase 3 study conducted in alcohol‐dependent patients with a high or very high DRL. Patients were randomized to 24 weeks of treatment with as‐needed nalmefene 20 mg, 10 mg, or placebo with psychosocial support. The primary endpoint was change in heavy drinking days (HDD) from baseline to week 12. A key secondary endpoint was the change in total alcohol consumption (TAC) from baseline to week 12.
Results
At week 12, 234, 206, and 154 patients who received placebo, nalmefene 20 mg, and 10 mg were included in the primary endpoint analysis. Compared with placebo, nalmefene was associated with significant reductions in HDD at week 12 (difference in 20 mg group, −4.34 days/month; 95% confidence interval [CI]: −6.05 to −2.62; P < 0.0001; difference in 10 mg group, −4.18 days/month; 95%CI: −6.05 to −2.32; P < 0.0001), as well as a significant reduction in TAC at week 12 (P < 0.0001). The incidence of treatment‐emergent adverse events was 87.9%, 84.8%, and 79.2% in the groups receiving nalmefene 20 mg, 10 mg, and placebo, respectively. These events were mostly of mild or moderate severity.
Conclusions
Nalmefene 20 mg or 10 mg effectively reduced alcohol consumption and was well tolerated in alcohol‐dependent patients with a high or very high DRL.
Keywords: alcohol dependence, drinking behavior, drug therapy, opioid, safety
The extent of alcohol‐related harm a person experiences is dependent on the volume of alcohol they consume and on their pattern of drinking. Worldwide in 2016, 18.2% of the total population aged ≥15 years were reported to engage in heavy episodic drinking (defined as ≥60 g pure alcohol on ≥1 single occasion ≥1 times per month), which has been regarded as the most harmful drinking.1 In the USA, the number of high‐risk drinkers was estimated at 29.6 million in 2012–2013.2 An epidemiological survey conducted in Japan estimated the number of people with a lifetime diagnosis of alcohol dependence at 1.07 million in 2013, of whom only 13.6% were receiving treatment.3 The survey also reported an age‐adjusted rate for hazardous drinking (male, ≥40 g/day; female, ≥20 g/day) of 12.0% in 2003 (male, 19.0%; female, 6.0%) and 9.6% in 2013 (male, 14.4%; female, 5.7%) in Japan.3
Traditionally, abstinence has been regarded as the only appropriate goal in the treatment of alcohol dependence in Japan, but long‐term abstinence retention rates after successful treatment are relatively low (28–32% after 2–3 years and 22–23% after almost 5 years).4 Therefore, harm reduction by reducing alcohol consumption, which has been used as a treatment approach in Europe, has now gained recognition in Japan.5 The 2018 guideline for the treatment of alcohol dependence in Japan regard abstinence as the primary goal, with reduction of alcohol consumption as an appropriate treatment goal in some patients.6
Nalmefene acts on the opioid system, displaying antagonism at the μ and δ receptors, as well as partial agonism at the κ receptor,7 which regulates the reward and reinforcement effects of alcohol.8 Nalmefene is currently approved in the European Union, Japan and several other countries for reducing alcohol consumption in alcohol‐dependent patients with a high or very high drinking risk level (DRL) according to World Health Organization (WHO) criteria.
Three studies have been conducted in Europe to evaluate the safety and efficacy of nalmefene 20 mg in reducing alcohol consumption: two 6‐month studies in patients with medium–very high DRL, ESENSE1 and ESENSE2;9, 10 and a 12‐month study in patients with low–very high DRL, SENSE.11 Importantly, in both ESENSE1 and ESENSE2, a high proportion of patients reduced their alcohol intake before randomization, which resulted in a small effect size and a substantial proportion of patients with low and medium DRL at randomization.
The results from these studies led to questions and debate about the efficacy of nalmefene in reducing alcohol consumption. A systematic review conducted by Palpacuer et al. concluded that “the value of nalmefene for the treatment of alcohol addiction is not established”.12 A post‐hoc analysis was performed in the subgroup of patients who continued to have at least high DRL at randomization, which showed statistically significant reductions in heavy drinking days (HDD) and total alcohol consumption (TAC) with nalmefene compared with placebo.13 One of the major concerns raised by the European Medicines Agency during the licensing process14 and by some critical reviews,12 however, was that consistent significant efficacy data were mostly derived from post‐hoc analyses in the subgroup of alcohol‐dependent patients with (very) high DRL.
The present randomized, controlled phase 3 study of nalmefene conducted in Japan was the first prospective clinical study to investigate the efficacy and safety of nalmefene 20 mg, taken as needed, in patients with a high or very high DRL. Two small studies with a lower daily dose of nalmefene (10 mg) have been conducted previously,15, 16 but those studies reported small non‐significant changes in the number of HDD versus placebo during the study period. In spite of these negative results with daily nalmefene 10 mg, we decided to include a 10 mg arm of nalmefene treatment as needed in the present study based on the hypothesis that the relatively small body size of Japanese patients may influence the results. This was also the first study to evaluate the efficacy of 10 mg nalmefene as needed compared with placebo in alcohol‐dependent patients with a high or very high DRL.
Methods
Overview of study design
This multicenter, randomized, double‐blind, parallel‐group, phase 3 study was conducted at 80 sites in Japan (http://ClinicalTrials.gov identifier: NCT02364947). After a 2‐week screening period, patients received 24 weeks of double‐blind treatment, followed by 4 weeks of follow up (Fig. S1). During the follow‐up period, only safety‐related information was collected and no drugs were given. Patients were invited to participate in the study via newspaper and online advertisements, as well as through the physician's clinic. All responding patients were screened for eligibility, and those meeting the study criteria were randomly assigned (4:3:4) using an interactive Web response system to as‐needed use of either nalmefene 20 mg, 10 mg (as an anhydride of nalmefene hydrochloride), or matched placebo tablets. Randomization was not stratified by patient characteristics or alcohol consumption status. Patients were instructed to take one tablet on days they perceived themselves to be at risk of drinking alcohol, preferably 1–2 h before they were likely to start drinking, but otherwise as soon as alcohol consumption began. The investigator and patients remained masked to treatment allocation throughout the study period.
All enrolled patients participated in a psychosocial support program that was developed based on the BRENDA model,17, 18 and aimed to help patients change their drinking behavior and maximize adherence to treatment. This program began at randomization and was performed at all site visits and up to the end of the study treatment by pre‐trained investigators. At each visit, patients were allowed to continue with subsequent treatment with nalmefene or placebo only after attending the psychosocial support program. The main components of this program included: psychosocial evaluation of the patient, feedback to patients about the outcomes of the assessment, empathic and non‐judgmental consideration of the patient's situation, collaborative identification of patient needs, advising patients on ways to meet the identified needs, and assessing patient response to the advice and adjusting the therapy accordingly to achieve best patient care.
Alcohol consumption was estimated using the timeline follow‐back method.19 Measurements, assessments, and evaluations used during the study are summarized in Table S1.
This study was conducted in accordance with the protocol, the ethics principles outlined in the Declaration of Helsinki, and the International Council for Harmonization's Harmonized Tripartite Guideline for Good Clinical Practice. The study protocol was approved by the institutional review board at each participating center before the study initiation and no changes were made to the protocol during the study. All patients provided written informed consent before entering the study.
Participants
Men and women ≥20 years of age were eligible to participate in the study if they had a primary diagnosis of alcohol dependence according to the Diagnostic and Statistical Manual of Mental Disorders, 4th Edition, text revision (DSM‐IV‐TR), and assessed using the Mini‐International Neuropsychiatric Interview, had an exhaled alcohol concentration <0.1 mg/L at screening visit, and met the WHO criteria for a high or very high DRL (consumption of >60 g of alcohol per day for men and >40 g of alcohol per day for women) at both screening and randomization visits.20 The main exclusion criterion was <6 HDD or >5 consecutive days of abstinence in the 4 weeks before the screening visit. Patients were also excluded if they had a current diagnosis of an axis I disorder other than alcohol, nicotine, and caffeine dependence according to DSM‐IV‐TR, and if they had a score ≥10 on the Revised Clinical Institute Withdrawal Assessment for Alcohol (CIWA‐Ar) scale at screening or randomization. The list of prohibited concomitant medications is given in Table S2, and a complete list of inclusion and exclusion criteria is given in Table S3.
Outcomes
The primary endpoint of this study was the change in the number of HDD in 1 month (4 weeks or 28 consecutive days) from baseline to week 12. An HDD was defined as a day with alcohol consumption >60 g for men and >40 g for women.21 The key secondary endpoint was the change in TAC from baseline to week 12 based on the average daily alcohol consumption in g/day. Alcohol consumption was converted from number of standard drinks to grams by multiplying by 10, in accordance with WHO guidelines for estimating alcohol consumption‐related harm.20 Baseline values for the number of HDD and TAC were calculated from the 4‐week data prior to the screening visit, and DRL was calculated from TAC at randomization. Post‐baseline HDD and TAC were calculated for every 4‐week period.
Other secondary endpoints included: the proportion of patients with a downward shift in DRL of two categories or more (response shift DRL, RSDRL); the proportion of patients with low or lower DRL (response low DRL, RLDRL); the proportion of patients with a 70% decrease in TAC (TAC70); the proportion of patients with ≤4 HDD (HDD response); Clinical Global Impression–Severity of Illness (CGI‐S) score; Clinical Global Impression–Global Improvement (CGI‐I) score; 36‐item Short‐form Health Survey (SF‐36) score; EuroQol 5 Dimension (EQ‐5D) utility score including visual analogue scale (VAS) for health status; Alcohol Quality of Life Scale (AQoLs); serum γ‐glutamyltransferase (γ‐GT); and serum alanine aminotransferase (ALT). All secondary endpoints were evaluated using the data obtained at weeks 12 and 24, except for CGI‐S and CGI‐I, for which data obtained by the investigators or sub‐investigators at weeks 1, 2, 4, 8, 16, and 20 were used.
The rate of nalmefene use during the study was calculated by determining the number of days patients received the drug during the treatment period.
Safety data collected during the study included treatment‐emergent adverse events (TEAE), clinical laboratory tests, vital signs, bodyweight, 12‐lead electrocardiogram (ECG), and Columbia‐Suicide Severity Rating Scale (C‐SSRS). Patients were asked to return for a safety follow‐up visit 4 weeks after completing or withdrawing from the study. TEAE were evaluated at week 24 and recorded using MedDRA/J Version 19.0.
Statistical analysis
A calculation based on unpublished data from the ESENSE1 and ESENSE2 studies indicated that, in patients with a high or very high DRL treated with nalmefene 20 mg for 12 weeks, the number of HDD was reduced by 2.66 days/month relative to placebo (SD, 9.37 days). Assuming the same difference in effect and rate of dropout, a sample of 240 patients in the nalmefene 20 mg and placebo groups would be required to detect a difference in the number of HDD between these treatments with a power of 87.4% and a two‐sided significance level of 5%. The statistical power of the 10 mg group was calculated using the same method as the statistical power of the 20 mg group, assuming a difference of 2.66 between the 10 mg group and the placebo group with an SD of 9.37. As a result, the power of detecting a difference between 10 mg and placebo was 81.9%, with 180 patients in the nalmefene 10 mg arm, and the probability of both doses showing significance was around 75%.
Efficacy analyses were conducted on the full analysis set, which included all patients who had data on the number of HDD at baseline and at ≥1 time point after initiation of the study drug. Safety analyses included all randomized patients who received ≥1 dose of the study medication.
Mixed model for repeated measures (MMRM) with fixed effect of treatment, sex, time point (week 4, 8, 12, 16, 20, and 24), treatment × time point interaction, baseline value, and baseline value × time point interaction with an unstructured variance–covariance matrix structure was used to analyze the change from baseline in HDD and TAC. In this study, the number of HDD (the primary endpoint) was measured first, followed by TAC (key secondary endpoint). Efficacy of the doses (change from baseline in the number of HDD vs placebo) was assessed using a closed testing procedure. The 20 mg dose was tested at a 5% level of significance and only if significant, the testing would proceed to the 10 mg dose. Multiplicity was not considered for TAC.
Sensitivity analyses were also conducted to evaluate the robustness of the main analyses. The same MMRM analyses were used with either (i) follow‐up data for patients who discontinued treatment during the treatment period, or (ii) multiple imputation assuming that patients who withdrew from the study would behave in the future in the same way as patients in the placebo group with a similar past.22
For RSDRL and RLDRL, differences between the treatment and placebo groups were assessed using the Cochran‐Mantel‐Haenszel test, stratified by sex and baseline DRL. An MMRM approach was used to analyze the CGI‐I, CGI‐S, SF‐36, EQ‐5D, and AQoLs scores. For MMRM analyses, γ‐GT and ALT were transformed logarithmically.
A post‐hoc analysis of HDD data at weeks 12 and 24 using MMRM was performed to compare nalmefene 20 mg and nalmefene 10 mg. Differences were assessed using the Wald test. The study completion rate in each group compared with placebo was analyzed using the Pearson's chi‐squared test. Also, the proportion of days with medication intake in each group during the study was compared using the Student t‐test.
SAS version 9.4 (SAS Institute, Tokyo, Japan) was used for all statistical calculations.
Results
Patient disposition and characteristics
Between 9 February 2015 and 30 July 2016, 867 patients were enrolled in the study and 678 were randomized. One patient who was randomized withdrew consent before starting the study medication; therefore, 677 patients received the study medication: nalmefene 20 mg (n = 248), nalmefene 10 mg (n = 184), or placebo (n = 245; Fig. 1, Doc.S1). Of these, 80.8% completed the study; the treatment completion rates were 76.2% (P = 0.0001 vs placebo), 75.5% (P = 0.0001 vs placebo), and 89.4% in the nalmefene 20 mg, nalmefene 10 mg, and placebo groups, respectively.
Figure 1.
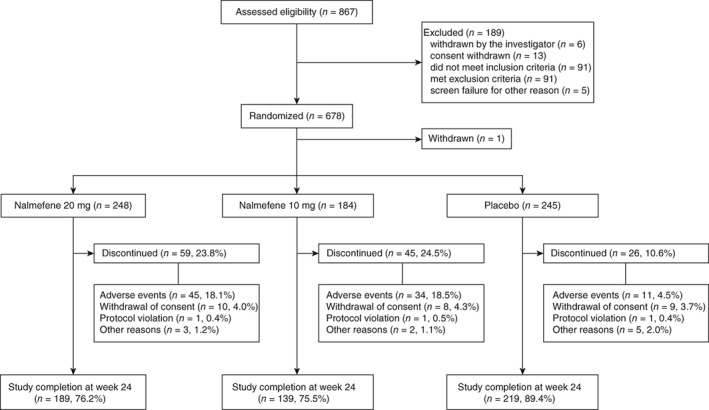
Patient selection. Safety analysis set (SAS) included patients who received at least one dose of placebo or nalmefene during the study period, n = 677. Full analysis set (FAS) included patients from the SAS who had baseline data available along with at least one heavy drinking days during the study period. Six patients in the nalmefene 20 mg group, four in the nalmefene 10 mg group and one patient in the placebo group were not included in the FAS.
The baseline characteristics and demographics were similar between all three treatment groups (Table 1). The mean age was 48.7 years and the mean age at onset of the drinking problem was 36.9 years. In the total study group, mean TAC was 94.58 ± 42.79 g/day and the mean number of HDD were 22.99 ± 6.32 days/month; the majority of patients included in the study were treatment naïve (97.4%), with only 2.6% of patients receiving previous treatment.
Table 1.
Baseline characteristics of the full analysis set population
| Nalmefene | Placebo (n = 244) Mean ± SD or n (%) | Total (n = 666) Mean ± SD or n (%) | ||||
|---|---|---|---|---|---|---|
| 20 mg (n = 242) Mean ± SD or n (%) | 10 mg (n = 180) Mean ± SD or n (%) | Total (n = 422) Mean ± SD or n (%) | ||||
| Sex | Male | 170 (70.2) | 134 (74.4) | 304 (72.0) | 154 (63.1) | 458 (68.8) |
| Age (years) | 48.9 ± 12.2 | 49.2 ± 11.9 | 49.0 ± 12.1 | 48.1 ± 11.4 | 48.7 ± 11.8 | |
| BMI (kg/m2) | 23.04 ± 3.24 | 23.32 ± 3.47 | 23.16 ± 3.34 | 23.11 ± 3.40 | 23.14 ± 3.36 | |
| Smoking history | Never | 60 (24.8) | 45 (25.0) | 105 (24.9) | 57 (23.4) | 162 (24.3) |
| Smoking status | Current smokers | 66 (27.3) | 41 (22.8) | 107 (25.4) | 86 (35.2) | 193 (29.0) |
| Drug abuse history | No | 242 (100.0) | 180 (100.0) | 422 (100.0) | 244 (100.0) | 666 (100.0) |
| Marital status | Married | 169 (69.8) | 125 (69.4) | 294 (69.7) | 160 (65.6) | 454 (68.2) |
| Employment status | Employed | 198 (81.8) | 150 (83.3) | 348 (82.5) | 199 (81.6) | 547 (82.1) |
| CIWA‐Ar | 0.5 ± 1.3 | 0.5 ± 1.2 | 0.5 ± 1.2 | 0.5 ± 1.2 | 0.5 ± 1.2 | |
| SF‐36 PCS | 52.1 ± 8.2 | 52.7 ± 7.8 | 52.3 ± 8.0 | 52.1 ± 8.3 | 52.2 ± 8.1 | |
| SF‐36 MCS | 51.7 ± 8.5 | 51.4 ± 8.1 | 51.6 ± 8.3 | 51.7 ± 8.3 | 51.6 ± 8.3 | |
| Age at onset of drinking problem (years) | 37.4 ± 13.7 | 37.6 ± 12.4 | 37.5 ± 13.2 | 36.0 ± 12.0 | 36.9 ± 12.7 | |
| WHO Drinking risk level | Very high | 107 (44.2) | 87 (48.3) | 194 (46.0) | 116 (47.5) | 310 (46.5) |
| High | 135 (55.8) | 93 (51.7) | 228 (54.0) | 127 (52.0) | 355 (53.3) | |
| Medium | 0 | 0 | 0 | 1 (0.4) | 1 (0.2) | |
| Low | 0 | 0 | 0 | 0 | 0 | |
| HDD (days/month) | 22.64 ± 6.37 | 23.49 ± 6.07 | 23.00 ± 6.25 | 22.97 ± 6.44 | 22.99 ± 6.32 | |
| TAC (g/day) | 93.07 ± 37.45 | 95.93 ± 41.10 | 94.29 ± 39.03 | 95.08 ± 48.70 | 94.58 ± 42.79 | |
| CGI‐S | 3.38 ± 1.06 | 3.48 ± 1.15 | 3.42 ± 1.09 | 3.45 ± 1.09 | 3.43 ± 1.09 | |
| γ‐GT (IU/L) | 84.7 ± 105.4 | 80.7 ± 103.8 | 83.0 ± 104.6 | 70.7 ± 78.7 | 78.5 ± 96.1 | |
| ALT (IU/L) | 24.3 ± 14.2 | 24.5 ± 14.9 | 24.4 ± 14.5 | 23.3 ± 14.8 | 24.0 ± 14.6 | |
| Previously treated for alcohol dependence | 5 (2.1) | 3 (1.7) | 8 (1.9) | 9 (3.7) | 17 (2.6) | |
| Previously treated for alcohol withdrawal | 0 | 0 | 0 | 0 | 0 | |
| Family history of alcohol problems | 31 (12.8) | 26 (14.4) | 57 (13.5) | 39 (16.0) | 96 (14.4) | |
ALT, alanine aminotransferase; BMI, body mass index; CGI–S, Clinical Global Impression–Severity of illness; CIWA‐Ar, Clinical Institute Withdrawal Assessment for Alcohol (revised version); γ‐GT, γ‐glutamyltransferase; HDD, heavy drinking days; MCS, mental component summary; PCS, physical component summary; WHO, World Health Organization; SD, standard deviation; SF‐36, 36‐item Short‐form Health Survey; TAC, total alcohol consumption.
Patients in the nalmefene 20 mg, 10 mg, and placebo groups took medication on a mean of 70.6% (P < 0.0001 vs placebo, P = 0.0829 vs 10 mg), 75.1% (P < 0.0001 vs placebo), and 87.0% of days, respectively during the study.
Primary endpoint and major efficacy outcomes
After 12 weeks of treatment, the mean number of HDD was reduced in all three treatment groups (Table 2). In both nalmefene treatment groups, statistically significant reductions in the number of HDD were observed relative to the placebo group at week 12. These reductions from baseline were observed from week 4, and the significant effect was sustained throughout the 24‐week treatment period (Table 2; Fig. 2). The results were consistent with the two sensitivity analyses, including follow‐up data for patients who discontinued treatment during the treatment period (Table S4) and using multiple imputation analysis based on the placebo group (Table S5).
Table 2.
Mean change in HDD and TAC in the full analysis set
| Value | Adjusted change from baseline† | |||||||
|---|---|---|---|---|---|---|---|---|
| Difference vs placebo | ||||||||
| Time point | Treatment group | n | Mean ± SD | LS Mean ± SE | LS Mean ± SE | 95%CI | P‐value | |
| HDD (days/month) | Baseline | Placebo | 244 | 22.97 ± 6.44 | ||||
| Nalmefene 20 mg | 242 | 22.64 ± 6.37 | ||||||
| Nalmefene 10 mg | 180 | 23.49 ± 6.07 | ||||||
| Week 12 | Placebo | 234 | 15.56 ± 9.74 | −7.91 ± 0.61 | ||||
| Nalmefene 20 mg | 206 | 11.42 ± 9.74 | −12.25 ± 0.64 | −4.34 ± 0.87 | −6.05 to −2.62 | <0.0001 | ||
| Nalmefene 10 mg | 154 | 12.04 ± 10.27 | −12.09 ± 0.74 | −4.18 ± 0.95 | −6.05 to −2.32 | <0.0001 | ||
| Week 24 | Placebo | 222 | 14.03 ± 10.20 | −9.33 ± 0.63 | ||||
| Nalmefene 20 mg | 189 | 10.62 ± 9.43 | −13.25 ± 0.66 | −3.92 ± 0.90 | −5.69 to −2.16 | <0.0001 | ||
| Nalmefene 10 mg | 141 | 9.82 ± 9.97 | −13.88 ± 0.77 | −4.54 ± 0.98 | −6.46 to −2.63 | <0.0001 | ||
| TAC (g/day) | Baseline | Placebo | 244 | 95.08 ± 48.70 | ||||
| Nalmefene 20 mg | 242 | 93.07 ± 37.45 | ||||||
| Nalmefene 10 mg | 180 | 95.93 ± 41.10 | ||||||
| Week 12 | Placebo | 234 | 65.39 ± 32.72 | −32.43 ± 1.91 | ||||
| Nalmefene 20 mg | 206 | 54.51 ± 34.88 | −44.90 ± 2.01 | −12.47 ± 2.72 | −17.81 to −7.13 | <0.0001 | ||
| Nalmefene 10 mg | 154 | 55.15 ± 34.46 | −45.36 ± 2.32 | −12.94 ± 2.95 | −18.72 to −7.15 | <0.0001 | ||
| Week 24 | Placebo | 222 | 59.28 ± 31.50 | −38.28 ± 1.99 | ||||
| Nalmefene 20 mg | 189 | 51.38 ± 33.82 | −49.43 ± 2.13 | −11.15 ± 2.86 | −16.77 to −5.53 | 0.0001 | ||
| Nalmefene 10 mg | 141 | 48.74 ± 33.32 | −49.55 ± 2.45 | −11.27 ± 3.11 | −17.37 to −5.17 | 0.0003 | ||
Derived from a mixed model for repeated measures approach.
CI, confidence interval; HDD, heavy drinking days; LS, least squares; SD, standard deviation; SE, standard error; TAC, total alcohol consumption.
Figure 2.
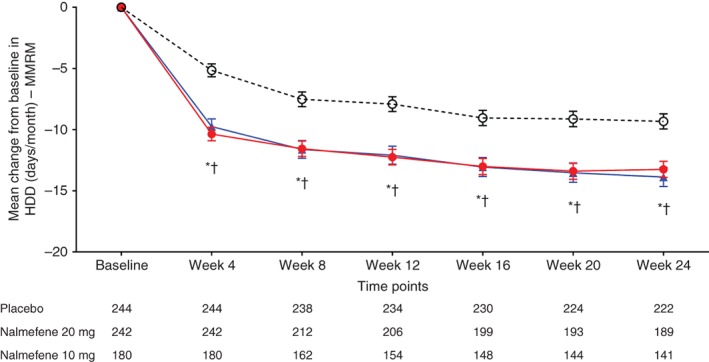
Change from baseline in the number of heavy drinking days (HDD) in study participants by treatment group (mixed model for repeated measures; MMRM, with observed cases). ( ) Placebo; (
 ) nalmefene 20 mg; (
 ) nalmefene 10 mg. Data given as least squares mean ± SE. *P < 0.05 placebo vs nalmefene 20 mg; †P < 0.05 placebo vs nalmefene 10 mg.
On post‐hoc analysis comparing nalmefene 10 mg and 20 mg, HDD reductions with nalmefene 10 mg at week 12 (P = 0.8738) and at week 24 (P = 0.5314) were similar to those observed with nalmefene 20 mg.
Secondary endpoints
Mean TAC at baseline was similar in all treatment groups (Table 2). After 12 weeks of treatment, mean TAC decreased in all treatment groups. In both nalmefene treatment groups, a greater reduction in TAC was observed at week 12 relative to the placebo group. These reductions in TAC were observed from week 4 and the significant effect was sustained throughout the 24‐week treatment period (Table 2; Fig. 3). Similar results were observed in the two sensitivity analyses (Tables S2,S5).
Figure 3.
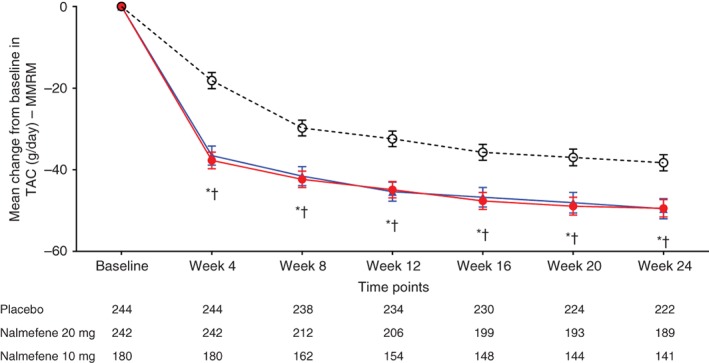
Change from baseline in total alcohol consumption (TAC) in study participants by treatment group (mixed model for repeated measures; MMRM, with observed cases). ( ) Placebo; (
 ) nalmefene 20 mg; (
 ) nalmefene 10 mg. Data given as least squares mean ± SE. *P < 0.05 placebo vs nalmefene 20 mg; †P < 0.05 placebo vs nalmefene.
The proportions of patients with RSDRL, RLDRL, TAC70, and HDD response were higher with nalmefene 20 mg and 10 mg than with placebo (Table 3). The number needed to treat (NNT) to achieve a response ranged from 4.5 to 12.5, depending on the response criterion and the nalmefene dose (Table 3). CGI‐S and CGI‐I were improved with nalmefene 20 mg and 10 mg compared with placebo at all time points during double‐blind treatment (Figs S2, S3). Serum γ‐GT, ALT, and total AQoLs scores improved in patients who received nalmefene 20 mg or 10 mg compared with placebo recipients (Tables S6,S7).
Table 3.
Secondary endpoints
| Responders | CMH test† | ||||||
|---|---|---|---|---|---|---|---|
| Time point | Treatment group | n | n (%) | P‐value | Risk difference (95%CI) | NNT (95%CI) | |
| RSDRL | Week 12 | Placebo | 234 | 47 (20.1) | |||
| Nalmefene 20 mg | 206 | 85 (41.3) | <0.0001 | 22.0 (13.6 to 30.4) | 4.5 (3.3 to 7.4) | ||
| Nalmefene 10 mg | 154 | 55 (35.7) | 0.0007 | 15.7 (6.5 to 25.0) | 6.4 (4.0 to 15.4) | ||
| Week 24 | Placebo | 222 | 61 (27.5) | ||||
| Nalmefene 20 mg | 189 | 84 (44.4) | 0.0002 | 18.0 (8.8 to 27.2) | 5.6 (3.7 to 11.4) | ||
| Nalmefene 10 mg | 141 | 67 (47.5) | 0.0001 | 20.6 (10.4 to 30.8) | 4.9 (3.2 to 9.6) | ||
| RLDRL | Week 12 | Placebo | 234 | 25 (10.7) | |||
| Nalmefene 20 mg | 206 | 61 (29.6) | <0.0001 | 17.8 (10.5 to 25.1) | 5.6 (4.0 to 9.5) | ||
| Nalmefene 10 mg | 154 | 39 (25.3) | 0.0002 | 14.3 (6.4 to 22.2) | 7.0 (4.5 to 15.6) | ||
| Week 24 | Placebo | 222 | 39 (17.6) | ||||
| Nalmefene 20 mg | 189 | 56 (29.6) | 0.0079 | 11.0 (2.9 to 19 1) | 9.1 (5.2 to 34.5) | ||
| Nalmefene 10 mg | 141 | 46 (32.6) | 0.0010 | 14.8 (5.8 to 23.9) | 6.8 (4.2 to 17.2) | ||
| TAC70 | Week 12 | Placebo | 234 | 20 (8.5) | |||
| Nalmefene 20 mg | 206 | 37 (18.0) | 0.0022 | 9.9 (3.5 to 16.3) | 10.1 (6.1 to 28.6) | ||
| Nalmefene 10 mg | 154 | 30 (19.5) | 0.0016 | 11.1 (3.8 to 18.3) | 9.0 (5.5 to 26.3) | ||
| Week 24 | Placebo | 222 | 24 (10.8) | ||||
| Nalmefene 20 mg | 189 | 45 (23.8) | 0.0003 | 13.6 (6.2 to 20.9) | 7.4 (4.8 to 16.1) | ||
| Nalmefene 10 mg | 141 | 33 (23.4) | 0.0013 | 12.8 (4.6 to 21.0) | 7.8 (4.8 to 21.7) | ||
| HDD response rate | Week 12 | Placebo | 234 | 45 (19.2) | |||
| Nalmefene 20 mg | 206 | 72 (35.0) | 0.0002 | 15.2 (7.1 to 23.3) | 6.6 (4.3 to 14.1) | ||
| Nalmefene 10 mg | 154 | 56 (36.4) | 0.0001 | 17.9 (8.9 to 26.9) | 5.6 (3.7 to 11.2) | ||
| Week 24 | Placebo | 222 | 56 (25.2) | ||||
| Nalmefene 20 mg | 189 | 64 (33.9) | 0.0724 | 8.0 (−0.7 to 16.7) | 12.5 (6.0 to NA) | ||
| Nalmefene 10 mg | 141 | 62 (44.0) | 0.0001 | 19.6 (9.9 to 29.2) | 5.1 (3.4 to 10.1) | ||
Adjusting for sex and baseline DRL.
CI, confidence interval; CMH, Cochran‐Mantel‐Haenszel; diff, difference; DRL, drinking risk level; HDD response rate; heavy drinking days ≤4 days; NA, not available; NNT, number needed to treat; RLDRL, response low drinking risk level; RSDRL, response shift drinking risk level; TAC70, 70% decrease in total alcohol consumption.
The physical component and mental component summaries (MCS) in SF‐36, EQ‐5D score for health status, and VAS were similar in all treatment groups (Table S8).
Safety
The incidences of any AE and of those that led to discontinuation were higher in the groups receiving nalmefene 20 mg and 10 mg than in the placebo group (Table 4). The primary reasons for discontinuation in all treatment groups were AE. AE that occurred in ≥5% of patients in either the nalmefene 20 mg or 10 mg group and at least twice as often as in the placebo group were nausea, dizziness, somnolence, vomiting, malaise, insomnia, decreased appetite, constipation, and palpitations. Most AE were mild or moderate in severity. Compared with the 20 mg dose, the 10 mg dose of nalmefene was associated with ≥5% lower rates of dizziness (20.6% vs 10.9%), malaise (9.7% vs 3.8%), somnolence (15.7% vs 9.8%), and vomiting (13.7% vs 8.7%). The rates of other AE were generally similar between the two doses. Time to first onset and duration of AE that occurred in ≥5% of patients are presented in Table S9.
Table 4.
Adverse events in the safety analysis set
| Nalmefene | ||||
|---|---|---|---|---|
| 20 mg (n = 248) n (%) | 10 mg (n = 184) n (%) | Total (n = 432) n (%) | Placebo (n = 245) | |
| Any TEAE† | 218 (87.9) | 156 (84.8) | 374 (86.6) | 194 (79.2) |
| TEAE reported in ≥5% of patients | ||||
| Constipation | 13 (5.2) | 8 (4.3) | 21 (4.9) | 2 (0.8) |
| Dizziness | 51 (20.6) | 20 (10.9) | 71 (16.4) | 10 (4.1) |
| Headache | 24 (9.7) | 21 (11.4) | 45 (10.4) | 20 (8.2) |
| Insomnia | 20 (8.1) | 15 (8.2) | 35 (8.1) | 2 (0.8) |
| Malaise | 24 (9.7) | 7 (3.8) | 31 (7.2) | 8 (3.3) |
| Nasopharyngitis | 54 (21.8) | 40 (21.7) | 94 (21.8) | 91 (37.1) |
| Nausea | 79 (31.9) | 58 (31.5) | 137 (31.7) | 15 (6.1) |
| Palpitations | 13 (5.2) | 7 (3.8) | 20 (4.6) | 2 (0.8) |
| Somnolence | 39 (15.7) | 18 (9.8) | 57 (13.2) | 17 (6.9) |
| Vomiting | 34 (13.7) | 16 (8.7) | 50 (11.6) | 5 (2.0) |
| Decreased appetite | 13 (5.2) | 11 (6.0) | 24 (5.6) | 3 (1.2) |
| TEAE leading to dropout in ≥2% of patients | ||||
| Nausea | 21 (8.5) | 12 (6.5) | 33 (7.6) | 0 (0.0) |
| Dizziness | 16 (6.5) | 9 (4.9) | 25 (5.8) | 1 (0.4) |
| Vomiting | 10 (4.0) | 5 (2.7) | 15 (3.5) | 0 (0.0) |
| Headache | 9 (3.6) | 7 (3.8) | 16 (3.7) | 1 (0.4) |
| Insomnia | 5 (2.0) | 5 (2.7) | 10 (2.3) | 0 (0.0) |
| Nasopharyngitis | 0 (0.0) | 1 (0.5) | 1 (0.2) | 7 (2.9) |
| Decreased appetite | 1 (0.4) | 4 (2.2) | 5 (1.2) | 0 (0.0) |
| Palpitations | 5 (2.0) | 1 (0.5) | 6 (1.4) | 0 (0.0) |
| Serious AE‡ | 2 (0.8) | 2 (1.1) | 4 (0.9) | 2 (0.8) |
In the 24‐week treatment period.
In the entire study period.
AE, adverse event, TEAE, treatment‐emergent adverse event.
Nausea, dizziness, vomiting, headache, insomnia, palpitations, and decreased appetite were the most common AE that led to discontinuation in ≥2% of patients for either the 20 mg dose or 10 mg dose (Table 4).
Serious AE (SAE) were reported in all treatment groups, occurring in two patients (0.8%), two patients (1.1%), and two patients (0.8%) in the nalmefene 20 mg, nalmefene 10 mg, and placebo groups, respectively. SAE included chronic hepatitis and gastroenteritis in the nalmefene 20 mg group, femur fracture, spinal compression fracture (both occurred in the same patient), and death in the nalmefene 10 mg group, and anastomotic ulcer hemorrhage, and alcoholism in the placebo group. Chronic hepatitis and anastomotic ulcer hemorrhage were considered related to the study medication, while other SAE were not. One death occurred during the course of the study: a male patient in the nalmefene 10 mg group died 168 days after receiving the first dose of treatment. The cause of death was unknown and its association with the treatment could not be ruled out.
There were no clinically significant laboratory findings and no clinically relevant changes or differences between treatment groups in vital signs, weight, or ECG parameters. Two patients in the group receiving 20 mg nalmefene, two in the 10 mg nalmefene group and three in the placebo group had suicidal ideation according to the C‐SSRS evaluation, but none showed any suicidal behavior.
Discussion
In this study, nalmefene 20 mg significantly reduced alcohol consumption, as measured by the number of HDD and TAC, relative to placebo over the period of 24 weeks. The robustness of these findings was consistent in two sensitivity analyses, including follow‐up data for patients who discontinued treatment and using multiple imputation analysis based on the placebo group. To our knowledge, this is the first prospective, randomized controlled clinical study to show the efficacy of nalmefene 20 mg in reducing the number of HDD and TAC after 12 and 24 weeks of treatment in Japanese patients with a high or very high DRL.
Several phase 3 trials of nalmefene conducted in non‐Japanese patients (ESENSE1, ESENSE 2, SENSE) have shown that nalmefene treatment was associated with a significant decrease from baseline in the number of HDD at week 12, the effect being sustained for up to 24 weeks.9, 10, 11 The number of patients withdrawing from these studies, however, increased after week 12. Based on these data, the primary endpoint was assessed at week 12 in the present study, with a total treatment period of 24 weeks to confirm the sustained decrease in alcohol consumption with nalmefene in alcohol‐dependent Japanese patients with a high or very high DRL.
In the present study, a lower dose of nalmefene (10 mg) was also effective in reducing potentially harmful drinking as indicated by the number of HDD and TAC compared with placebo. On post‐hoc analysis nalmefene 10 mg had similar efficacy to that of the 20 mg dose in reducing the number of HDD at weeks 12 and 24. The number and type of TEAE that occurred in patients treated with nalmefene in the present study are consistent with those of previous studies.9, 10, 11 The incidence of nausea, which was the most frequently observed AE, was similar between the two groups. Some other AE, however, including dizziness, somnolence and vomiting were less frequent in the 10 mg group compared with 20 mg nalmefene in this study. This suggests that nalmefene 10 mg can be a therapeutic option in the treatment of alcohol dependence with similar efficacy and a lower incidence of AE.
There has been a debate regarding the approval of nalmefene in patients with high or very high DRL not being based on evidence from clinical trials, given that the majority of data on the efficacy of nalmefene in this subgroup of patients is based on post‐hoc analysis.23 The present results confirm the efficacy of nalmefene in the reduction of alcohol consumption using a prospective, randomized, controlled study design and, therefore, provide important information that can help advance this discussion.
The main difference between the design of this study and other studies conducted in Europe9, 10 was that only patients with a high or very high DRL were included in the present study. With the exception of DRL, the characteristics of patients who participated in the present study were generally similar to those of patients who took part in previous studies of nalmefene.9, 10, 11 There were several distinguishing characteristics, however, of the present patients. In the present study, only 2.6% of patients had previously undergone treatment for alcohol dependence, compared with 29.8% of patients in the ESENSE1,9 40.3% of patients in ESENSE2,10 and 34.4% of patients in the SENSE study.11 Additionally, baseline CIWA‐Ar scores in the nalmefene 20 mg, 10 mg, and placebo groups were low,24 and baseline SF‐46 MCS scores of this study were higher than baseline MCS scores in ESENSE1 and ESENSE2.23 Furthermore, 68.2% of patients in the present study were married or living with partners, and 82.1% were employed, which indicated a relatively high degree of social and emotional support and functioning. Patients in this study were also different from the patients in another study focused on alcohol abstinence conducted in Japan25 in terms of age distribution, with the present patients being younger (median age < 50 years).
In the present study, the rates of treatment completion and study drug use were both higher than in the previous European studies of nalmefene. In particular, the treatment completion rates observed at week 24 in this study (89%, 76%, 76% for placebo, nalmefene 10 mg and 20 mg, respectively) were considerably higher than completion rates reported in previous studies with nalmefene (46% for nalmefene 20 mg and 68% for placebo in ESENSE1, and 57% and 61% in ESENSE2) or with other pharmacological agents used for ≤6 months.9, 10, 26, 27, 28 Furthermore, the proportion of days with medication intake was 87% (placebo), 75% (nalmefene 10 mg) and 71% (nalmefene 20 mg) in this study compared with 48.0% with nalmefene 20 mg and 63.9% with placebo in ESENSE1,9 and 57.0% and 65.2%, respectively, in ESENSE2.10 These higher rates may be attributed to the differences in the patient characteristics discussed earlier, along with treatment history, low CIWA‐Ar, better QoL‐related scores and more family/social support observed in the present study. In addition, the majority of the present patients were treatment naïve (>97%), compared with a considerable proportion of patients in the European studies who received treatment for alcohol dependence. None of the Japanese patients had a history of alcohol withdrawal treatment. From these facts, few patients in the present study experienced failure with alcohol dependence treatment. We also hypothesize that some patients who were seeking better health and life with controlled drinking may be included in the present study.
The present results suggest that the dosing of nalmefene “as needed” was well‐accepted by the patients. Nalmefene can be dosed as needed because it readily occupies μ‐opioid receptors with a high occupancy rate.29 When a patient has a desire to drink, taking nalmefene before drinking means that he/she is already conscious of reducing alcohol consumption. This consciousness and patient alignment with treatment goals may also have contributed to the reduction in the number of HDD observed in this study, in addition to the effects of nalmefene. It has been shown that being aligned with treatment goals plays an important role in enhancing the motivation to stay in treatment and in a successful outcome.30, 31 In fact, clinically meaningful improvements in drinking‐related outcomes are associated with the pre‐treatment drinking goals initially set.32 The psychosocial support used in this study aimed at medication adherence with self‐monitoring of alcohol consumption which, in addition to as‐needed treatment, empowers patients to actively participate in treatment decisions. The patient is engaged in treatment by including his/her goal preference in determining treatment options.33
Apart from the reduction in alcohol consumption discussed here, other targets in the management of alcohol dependence include complete abstinence and reduction of craving.34 Previous pharmacotherapies, such as naltrexone, acamprosate and disulfiram mainly targeted abstinence and focused on relapse prevention. The present results demonstrate the efficacy and safety of nalmefene in the management of alcohol dependence in patients with a high or very high DRL, suggesting nalmefene as a valuable treatment option for managing heavy drinking in this patient population.
This study had several limitations. First, although fewer patients withdrew from this study than from the previous European studies,9, 10, 11 there were more withdrawals for TEAE in the nalmefene groups than in the placebo group. Therefore, we cannot exclude the possibility of attrition bias. In addition, the MMRM analysis did not include study site as a covariate. Therefore, the possibility of cluster bias cannot be ruled out.
In conclusion, this was the first prospective clinical study to demonstrate the efficacy and safety of nalmefene 20 mg and 10 mg in Japanese patients with a high or very high DRL. Nalmefene may therefore be a valuable pharmacological treatment option for alcohol‐dependent patients who are either not ready or unable to consider complete abstinence as the initial treatment goal, or who have not undergone any treatment; further studies are needed to confirm this.
Disclosure statement
Hisatsugu Miyata has received personal fees from Otsuka Pharmaceutical, during the conduct of the study as well as personal fees from Otsuka Pharmaceutical, Meiji Seika Pharma, Janssen Pharmaceutical, Sumitomo Dainippon Pharma, Mochida Pharmaceutical, and Eli Lilly Japan, outside the submitted work; Susumu Higuchi has received personal fees, grants and other fees from Otsuka Pharmaceutical, as wells as grants and other fees from Lundbeck Japan during the conduct of the study as well as personal fees from Nippon Shinyaku, MSD, Yoshitomi Pharmaceutical, Jansen Pharma, Eli‐Lilly Japan, Mochida Pharmaceutical, and Meiji‐Seika Pharma and other fees from Nippon Shinyaku and Eisai, outside the submitted work; Masayoshi Takahashi, Yoshiyuki Murai, Kana Tsuneyoshi, and Takako Hayashi are full‐time employees of Otsuka Pharmaceutical. Didier Meulien is a full‐time employee of H. Lundbeck SAS, and Per Sørensen is a full‐time employee of H. Lundbeck A/S. A California winery, Ridge Vineyards, is a subsidiary company of Otsuka Pharmaceutical.
Author contributions
H.M., M.T., Y.M., K.T., and S.H. conceived of and designed the study. H.M., M.T., Y.M., and S.H. were involved in data acquisition. K.T. was the study statistician. D.M. and P.S. contributed to the study design, data interpretation, preparation of the study report, the writing of the manuscript, and read and approved the drafts. All authors participated in the interpretation of the data, and in the writing and critical reviewing and revising of the manuscript. All authors approved the final manuscript for publication.
Supporting information
Table S1. Measurements and assessments.
Table S2. Prohibited prior drugs, prohibited concomitant drugs and restricted concomitant drugs.
Table S3. Inclusion criteria, exclusion criteria, discontinuation criteria.
Table S4. Sensitivity analyses of mean change from baseline in heavy drinking days and total alcohol consumption in the full analysis set.
MMRM (including follow‐up data for patients who discontinued treatment early)
Table S5. Sensitivity analyses of mean change from baseline in heavy drinking days and total alcohol consumption in the full analysis set. MMRM (Multiple Imputations)
Table S6. Mean change in γ‐glutamyltransferase and alanine aminotransferase levels in study patients (logarithmic scale).
Table S7. Alcohol Quality of Life Scale (Japanese version) scores in the full analysis set.
Table S8. Mean change in SF‐36 and EQ‐5D in study patients.
Table S9. Time to first onset and duration of adverse events that occurred in ≥5% of study patients.
Figure S1. Treatment schedule. Patients were randomized to nalmefene 20 mg, 10 mg, or placebo in a 4:3:4 ratio.
Figure S2. Change from baseline in Clinical Global Impression Severity of illness (CGI‐S) scores. Values presented as least squares mean ± standard error. The number of patients at each time point is shown below the x‐axis. *P < 0.05 placebo vs nalmefene 20 mg; †P < 0.05 placebo vs nalmefene 10 mg.
Figure S3. Change from baseline in Clinical Global Impression Improvement (CGI‐I) scores in study participants by treatment group. Values presented as least squares mean ± standard error. The number of patients at each time point is shown below the x‐axis. *P < 0.05 placebo vs nalmefene 20 mg; †P < 0.05 placebo vs nalmefene 10 mg.
Appendix S1. Doc. S1. CONSORT checklist.
Acknowledgments
We would like to thank all patients for their participation in the study, and all study sites, investigators, and all clinical research staff for their contributions. We would also like to thank Yoshiko Okamoto, PhD, and Georgii Filatov of inScience Communications, Springer Healthcare, who wrote the outline and first draft of the manuscript, respectively. This medical writing assistance was funded by Otsuka Pharmaceutical Co., Ltd. This study was funded by Otsuka Pharmaceutical Co., Ltd. and H. Lundbeck A/S.
http://ClinicalTrials.gov identifier: NCT02364947
References
- 1. World Health Organisation . Global status report on alcohol and health. WHO Press, Geneva, 2014.
- 2. Grant BF, Chou SP, Saha TD et al Prevalence of 12‐month alcohol use, high‐risk drinking, and DSM‐IV alcohol use disorder in the United States, 2001‐2002 to 2012‐2013: Results from the national epidemiologic survey on alcohol and related conditions. JAMA Psychiatry 2017; 74: 911–923. [DOI] [PMC free article] [PubMed] [Google Scholar]
- 3. Osaki Y, Kinjo A, Higuchi S et al Prevalence and trends in alcohol dependence and alcohol use disorders in Japanese adults: Results from periodical nationwide surveys. Alcohol Alcohol. 2016; 51: 465–473. [DOI] [PubMed] [Google Scholar]
- 4. Noda T, Imamichi H, Kawata A et al Long‐term outcome in 306 males with alcoholism. Psychiatry Clin. Neurosci. 2001; 55: 579–586. [DOI] [PubMed] [Google Scholar]
- 5. Higuchi S, Maesato H, Yoshimura A, Matsushita S. Acceptance of controlled drinking among treatment specialists of alcohol dependence in Japan. Alcohol Alcohol. 2014; 49: 447–452. [DOI] [PubMed] [Google Scholar]
- 6. Higuchi S, Saito T, Yumoto Y. New diagnostic and treatment guidelines for alcohol and drug use disorders. Shinkoh Igaku Shuppansha, Tokyo, 2018. (in Japanese). [Google Scholar]
- 7. Bart G, Schluger JH, Borg L, Ho A, Bidlack JM, Kreek MJ. Nalmefene induced elevation in serum prolactin in normal human volunteers: Partial kappa opioid agonist activity? Neuropsychopharmacology 2005; 30: 2254–2262. [DOI] [PubMed] [Google Scholar]
- 8. Quelch DR, Mick I, McGonigle J et al Nalmefene reduces reward anticipation in alcohol dependence: An experimental functional magnetic resonance imaging study. Biol. Psychiatry 2017; 81: 941–948. [DOI] [PubMed] [Google Scholar]
- 9. Mann K, Bladstrom A, Torup L, Gual A, van den Brink W. Extending the treatment options in alcohol dependence: A randomized controlled study of as‐needed nalmefene. Biol. Psychiatry 2013; 73: 706–713. [DOI] [PubMed] [Google Scholar]
- 10. Gual A, He Y, Torup L, van den Brink W, Mann K. A randomised, double‐blind, placebo‐controlled, efficacy study of nalmefene, as‐needed use, in patients with alcohol dependence. Eur. Neuropsychopharmacol. 2013; 23: 1432–1442. [DOI] [PubMed] [Google Scholar]
- 11. van den Brink W, Sorensen P, Torup L, Mann K, Gual A. Long‐term efficacy, tolerability and safety of nalmefene as‐needed in patients with alcohol dependence: A 1‐year, randomised controlled study. J. Psychopharmacol. 2014; 28: 733–744. [DOI] [PubMed] [Google Scholar]
- 12. Palpacuer C, Laviolle B, Boussageon R, Reymann JM, Bellissant E, Naudet F. Risks and benefits of Nalmefene in the treatment of adult alcohol dependence: A systematic literature review and meta‐analysis of published and unpublished double‐blind randomized controlled trials. PLoS Med. 2015; 12: e1001924. [DOI] [PMC free article] [PubMed] [Google Scholar]
- 13. van den Brink W, Aubin HJ, Bladstrom A, Torup L, Gual A, Mann K. Efficacy of as‐needed nalmefene in alcohol‐dependent patients with at least a high drinking risk level: Results from a subgroup analysis of two randomized controlled 6‐month studies. Alcohol Alcohol. 2013; 48: 570–578. [DOI] [PMC free article] [PubMed] [Google Scholar]
- 14. Fitzgerald N, Angus K, Elders A et al Weak evidence on nalmefene creates dilemmas for clinicians and poses questions for regulators and researchers. Addiction 2016; 111: 1477–1487. [DOI] [PMC free article] [PubMed] [Google Scholar]
- 15. Mason BJ, Ritvo EC, Morgan RO et al A double‐blind, placebo‐controlled pilot study to evaluate the efficacy and safety of oral nalmefene HCI for alcohol dependence. Alcohol. Clin. Exp. Res. 1994; 18: 1162–1167. [DOI] [PubMed] [Google Scholar]
- 16. Mann K, Torup L, Sorensen P et al Nalmefene for the management of alcohol dependence: Review on its pharmacology, mechanism of action and meta‐analysis on its clinical efficacy. Eur. Neuropsychopharmacol. 2016; 26: 1941–1949. [DOI] [PubMed] [Google Scholar]
- 17. Starosta AN, Leeman RF, Volpicelli JR. The BRENDA model: Integrating psychosocial treatment and pharmacotherapy for the treatment of alcohol use disorders. J. Psychiatr. Pract. 2006; 12: 80–89. [DOI] [PMC free article] [PubMed] [Google Scholar]
- 18. Volpicelli J. Combining Medication and Psychosocial Treatments for Addictions: The BRENDA Approach. Guilford Publications, New York, 2001. [Google Scholar]
- 19. Sobell LC, Sobell MB. Timeline follow‐back In: Litten RZ, Allen JP. (eds). Measuring Alcohol Consumption: Psychosocial and Biochemical Methods. Humana Press, Totowa, NJ, 1992; 41–72. [Google Scholar]
- 20. World Health Organization . International Guide for Monitoring Alcohol Consumption and Related Harm. WHO Press, Geneva, 2000. [Google Scholar]
- 21. European Medicines Agency Committee for Medicinal Products for Human use (CHMP) . Guideline on the development of medicinal products for the treatment of alcohol dependence [Internet]. European Medicines Agency; 2010. [Cited 19 June 2017.] Available from URL: http://www.ema.europa.eu/docs/en_GB/document_library/Scientific_guideline/2010/03/WC500074898.pdf [Google Scholar]
- 22. Little R, Yau L. Intent‐to‐treat analysis for longitudinal studies with drop‐outs. Biometrics 1996; 52: 1324–1333. [PubMed] [Google Scholar]
- 23. Francois C, Rahhali N, Chalem Y, Sorensen P, Luquiens A, Aubin HJ. The effects of as‐needed nalmefene on patient‐reported outcomes and quality of life in relation to a reduction in alcohol consumption in alcohol‐dependent patients. PLoS One 2015; 10: e0129289. [DOI] [PMC free article] [PubMed] [Google Scholar]
- 24. Kosten TR, O'Connor PG. Management of drug and alcohol withdrawal. N. Engl. J. Med. 2003; 348: 1786–1795. [DOI] [PubMed] [Google Scholar]
- 25. Higuchi S. Efficacy of acamprosate for the treatment of alcohol dependence long after recovery from withdrawal syndrome: A randomized, double‐blind, placebo‐controlled study conducted in Japan (sunrise study). J. Clin. Psychiatry 2015; 76: 181–188. [DOI] [PubMed] [Google Scholar]
- 26. Anton RF, O'Malley SS, Ciraulo DA et al Combined pharmacotherapies and behavioral interventions for alcohol dependence: The COMBINE study: A randomized controlled trial. JAMA 2006; 295: 2003–2017. [DOI] [PubMed] [Google Scholar]
- 27. Garbutt JC, Kranzler HR, O'Malley SS et al Efficacy and tolerability of long‐acting injectable naltrexone for alcohol dependence: A randomized controlled trial. JAMA 2005; 293: 1617–1625. [DOI] [PubMed] [Google Scholar]
- 28. Johnson BA, Ait‐Daoud N, Bowden CL et al Oral topiramate for treatment of alcohol dependence: A randomised controlled trial. Lancet 2003; 361: 1677–1685. [DOI] [PubMed] [Google Scholar]
- 29. Ingman K, Hagelberg N, Aalto S et al Prolonged central mu‐opioid receptor occupancy after single and repeated nalmefene dosing. Neuropsychopharmacology 2005; 30: 2245–2253. [DOI] [PubMed] [Google Scholar]
- 30. Gastfriend DR, Garbutt JC, Pettinati HM, Forman RF. Reduction in heavy drinking as a treatment outcome in alcohol dependence. J. Subst. Abuse Treat. 2007; 33: 71–80. [DOI] [PubMed] [Google Scholar]
- 31. Orford J, Keddie A. Abstinence or controlled drinking in clinical practice: A test of the dependence and persuasion hypotheses. Br. J. Addict. 1986; 81: 495–504. [DOI] [PubMed] [Google Scholar]
- 32. Dunn KE, Strain EC. Pretreatment alcohol drinking goals are associated with treatment outcomes. Alcohol. Clin. Exp. Res. 2013; 37: 1745–1752. [DOI] [PMC free article] [PubMed] [Google Scholar]
- 33. Sinclair J, Chick J, Sorensen P, Kiefer F, Batel P, Gual A. Can alcohol dependent patients adhere to an 'as‐needed' medication regimen? Eur. Addict. Res. 2014; 20: 209–217. [DOI] [PubMed] [Google Scholar]
- 34. Blanco‐Gandia MC, Rodriguez‐Arias M. Pharmacological treatments for opiate and alcohol addiction: A historical perspective of the last 50 years. Eur. J. Pharmacol. 2018; 836: 89–101. [DOI] [PubMed] [Google Scholar]
Associated Data
This section collects any data citations, data availability statements, or supplementary materials included in this article.
Supplementary Materials
Table S1. Measurements and assessments.
Table S2. Prohibited prior drugs, prohibited concomitant drugs and restricted concomitant drugs.
Table S3. Inclusion criteria, exclusion criteria, discontinuation criteria.
Table S4. Sensitivity analyses of mean change from baseline in heavy drinking days and total alcohol consumption in the full analysis set.
MMRM (including follow‐up data for patients who discontinued treatment early)
Table S5. Sensitivity analyses of mean change from baseline in heavy drinking days and total alcohol consumption in the full analysis set. MMRM (Multiple Imputations)
Table S6. Mean change in γ‐glutamyltransferase and alanine aminotransferase levels in study patients (logarithmic scale).
Table S7. Alcohol Quality of Life Scale (Japanese version) scores in the full analysis set.
Table S8. Mean change in SF‐36 and EQ‐5D in study patients.
Table S9. Time to first onset and duration of adverse events that occurred in ≥5% of study patients.
Figure S1. Treatment schedule. Patients were randomized to nalmefene 20 mg, 10 mg, or placebo in a 4:3:4 ratio.
Figure S2. Change from baseline in Clinical Global Impression Severity of illness (CGI‐S) scores. Values presented as least squares mean ± standard error. The number of patients at each time point is shown below the x‐axis. *P < 0.05 placebo vs nalmefene 20 mg; †P < 0.05 placebo vs nalmefene 10 mg.
Figure S3. Change from baseline in Clinical Global Impression Improvement (CGI‐I) scores in study participants by treatment group. Values presented as least squares mean ± standard error. The number of patients at each time point is shown below the x‐axis. *P < 0.05 placebo vs nalmefene 20 mg; †P < 0.05 placebo vs nalmefene 10 mg.
Appendix S1. Doc. S1. CONSORT checklist.