

Abstract
Diabetic dyslipidaemia is a major risk factor for accelerated atherosclerosis. Glycaemic treatments that improve dyslipidaemia may help reduce the burden of atherosclerosis. This analysis investigated the effect of iGlarLixi [insulin glargine U100 (iGlar) and lixisenatide] versus iGlar on lipid profiles in patients with type 2 diabetes uncontrolled on basal insulin. Data from LixiLan‐L were used to estimate changes in fasting lipid levels from baseline to week 30, overall and in patients stratified by achievement of glycaemic targets {2‐hour postprandial glucose [≤10, >10 mmoL/L], fasting plasma glucose [≤6.1, >6.1 mmoL/L], HbA1c [≤7, >7% (≤53, >53 mmol/mol)]}. At week 30, median percentage change in triglycerides remained nearly unchanged (0.3% increase) with iGlarLixi versus a 6.5% increase with iGlar (P = 0.035; overall); similarly, trends towards better total and LDL cholesterol levels were observed with iGlarLixi versus iGlar. In patient subgroups achieving glycaemic targets, all lipid variables except for HDL cholesterol improved with iGlarLixi but not with iGlar. In summary, patients with type 2 diabetes uncontrolled on basal insulin showed improved fasting lipid profiles with iGlarLixi compared with iGlar, particularly when achieving glycaemic targets.
Keywords: dyslipidaemia, glucagon‐like peptide‐1, insulin therapy, type 2 diabetes
1. INTRODUCTION
Diabetes is associated with accelerated risk of atherosclerosis. Diabetic dyslipidaemia is characterized by elevated triglyceride (TG) and low high‐density lipoprotein cholesterol (HDL‐C) levels, as well as qualitative and kinetic changes in lipoproteins that result in an atherogenic lipid profile.1, 2, 3, 4 Furthermore, diabetes itself appears to confer an independent risk factor for coronary heart disease (CHD), as at any given level of serum cholesterol, CHD risk is higher in patients with diabetes than in the general population.3
Short‐acting glucagon‐like peptide‐1 receptor agonists (GLP‐1 RAs), such as exenatide and lixisenatide, have been shown to improve postprandial proatherogenic lipids and vascular endothelial function, as well as exert antihyperglycaemic activity.5, 6, 7, 8, 9 Furthermore, long‐term use of such GLP‐1 RAs is associated with favourable changes in the lipid profiles of patients with type 2 diabetes.10
iGlarLixi is a titratable fixed‐ratio combination of insulin glargine U100 (iGlar) and lixisenatide available as a single‐injection pen for once‐daily use. In LixiLan‐L (clinical trial number NCT02058160; http://clinicaltrials.gov), a 30‐week trial in patients with type 2 diabetes previously uncontrolled on basal insulin with or without oral antidiabetic drugs (OADs), iGlarLixi showed superior reductions in HbA1c levels and a beneficial effect on body weight compared with iGlar alone.11 This post hoc analysis of the LixiLan‐L trial investigated whether iGlarLixi improved fasting lipid levels versus iGlar alone, and whether achievement of glycaemic targets impacted changes in lipid levels.
2. METHODS
2.1. Trial design
The full methodology of the LixiLan‐L trial has been previously described.11 In brief, LixiLan‐L was a randomized, 30‐week, open‐label, parallel‐group, multicentre trial designed to compare the efficacy and safety of iGlarLixi versus iGlar in patients previously uncontrolled on basal insulin with or without up to two OADs. During a 6‐week run‐in period, all OADs other than metformin were discontinued prior to randomization. Additional details are described in the supporting material (Appendix S1).
2.2. Post hoc analysis
This post hoc analysis assessed the median percentage change and mean absolute change from baseline to week 30 in fasting lipid values [TG, low‐density lipoprotein cholesterol (LDL‐C), total cholesterol (TC) and HDL‐C], lipid ratios (TC/HDL‐C and TG/HDL‐C, which have been previously associated with cardiovascular/microvascular complications12, 13) and body weight (median percentage change only) in the overall safety population and in patient subgroups stratified by achievement of glycaemic targets at week 30. Subgroups included the following: 2‐hour postprandial glucose [PPG; ≤10, >10 mmoL/L (≤180, >180 mg/dL)], fasting plasma glucose [FPG; ≤6.1, >6.1 mmoL/L (≤110, >110 mg/dL)] and HbA1c [≤7, >7% (≤53, >53 mmol/mol)]. As TG values were not normally distributed, absolute changes in TG levels were assessed using median values.
2.3. Lipid measurements
Lipid levels were measured with standardized, automated, high‐throughput enzymatic analyses in a central lab. Serum total cholesterol, triglycerides and HDL‐C were measured by colorimetric methods on a Roche (Indianapolis, Indiana) Cobas analyser after an overnight fast. LDL‐C was then calculated according to the Friedewald formula.
2.4. Statistical analysis
Post hoc analyses were based on the safety population, defined as all randomized patients who received at least one dose of iGlarLixi or iGlar, regardless of the amount of treatment administered. Student's t‐test was used to compare the mean difference between iGlarLixi versus iGlar for the absolute change in lipid levels (LDL‐C, TC and HDL‐C) and absolute change in TC/HDL‐C ratio from baseline. The Mann–Whitney U test was used to compare the differences in median absolute change in TG, median absolute change in TG/HDL‐C, median percentage change in lipid levels, and median percentage change in body weight between treatment groups.
Analysis of covariance (ANCOVA) was performed to explore the impact of covariates on changes in lipid levels. Least squares (LS) mean differences in absolute change from baseline in lipid levels between iGlarLixi and iGlar were calculated and compared using ANCOVA, with treatment as a fixed effect and baseline lipid levels, lipid‐lowering drug use and weight change at week 30 as covariates (analysed together or individually). The between‐treatment comparison for TG was based on Tukey normalized rank transformation. All P‐values are reported as nominal P‐values without multiplicity adjustment.
3. RESULTS
3.1. Patient baseline characteristics
Patient baseline demographics and clinical characteristics were well balanced between the iGlarLixi and iGlar groups, as reported previously11 (Table S1). Baseline fasting lipid levels and use of lipid‐lowering drugs were also well balanced between treatment groups (Table 1 and Table S1); baseline fasting lipid levels were similar across patient subgroups stratified by achievement of glycaemic targets at study end (Table 1).
Table 1.
Mean baseline lipid values (mmol/l) by treatment group, overall and in patients stratified by achievement of glycaemic targets at study end (safety population)
| Total population | iGlarLixi | iGlar | ||
|---|---|---|---|---|
| (n = 365) | (n = 365) | |||
| TG | 1.41 (1.03, 1.89) | 1.40 (1.05, 2.01) | ||
| LDL‐C | 2.63 ± 0.99 | 2.58 ± 0.95 | ||
| TC | 4.72 ± 1.19 | 4.65 ± 1.14 | ||
| HDL‐C | 1.33 ± 0.35 | 1.29 ± 0.32 | ||
| Subgroups by glycaemic target | ||||
| 2‐hour PPG | ≤10 mmoL/L (≤180 mg/dL) | >10 mmoL/L (>180 mg/dL) | ||
| iGlarLixi | iGlar | iGlarLixi | iGlar | |
| (n = 191) | (n = 58) | (n = 142) | (n = 284) | |
| TG | 1.44 | 1.50 | 1.34 | 1.38 |
| (1.10, 2.06) | (1.14, 2.12) | (0.93, 1.85) | (1.04, 1.92) | |
| LDL‐C | 2.71 ± 1.00 | 2.44 ± 0.96 | 2.48 ± 0.95 | 2.61 ± 0.96 |
| TC | 4.79 ± 1.18 | 4.51 ± 1.10 | 4.60 ± 1.21 | 4.66 ± 1.16 |
| HDL‐C | 1.32 ± 0.36 | 1.27 ± 0.32 | 1.35 ± 0.35 | 1.28 ± 0.31 |
| FPG | ≤6.1 mmoL/L (≤110 mg/dL) | >6.1 mmoL/L (>110 mg/dL) | ||
|
iGlarLixi (n = 161) |
iGlar (n = 172) |
iGlarLixi (n = 202) |
iGlar (n = 192) |
|
| TG | 1.42 | 1.40 | 1.41 | 1.39 |
| (1.07, 2.00) | (1.07, 1.92) | (1.01, 1.84) | (1.00, 2.01) | |
| LDL‐C | 2.75 ± 0.99 | 2.59 ± 0.96 | 2.52 ± 0.99 | 2.56 ± 0.94 |
| TC | 4.85 ± 1.15 | 4.64 ± 1.13 | 4.62 ± 1.22 | 4.65 ± 1.14 |
| HDL‐C | 1.33 ± 0.37 | 1.27 ± 0.31 | 1.33 ± 0.34 | 1.30 ± 0.33 |
| HbA1c | ≤7% (≤53 mmol/Mol) | >7% (>53 mmol/Mol) | ||
| iGlarLixi | iGlar | iGlarLixi | iGlar | |
| (n = 221) | (n = 123) | (n = 142) | (n = 241) | |
| TG |
1.42 (1.07, 1.91) |
1.44 (1.07, 2.05) |
1.40 (0.91, 1.85) |
1.36 (1.02, 1.91) |
| LDL‐C | 2.68 ± 0.99 | 2.45 ± 0.94 | 2.55 ± 1.00 | 2.64 ± 0.95 |
| TC | 4.76 ± 1.17 | 4.48 ± 1.06 | 4.66 ± 1.23 | 4.73 ± 1.17 |
| HDL‐C | 1.34 ± 0.36 | 1.24 ± 0.29 | 1.33 ± 0.34 | 1.31 ± 0.34 |
Abbreviations: FPG, fasting plasma glucose; HDL‐C, high‐density lipoprotein cholesterol; iGlar, insulin glargine U100; iGlarLixi, insulin glargine and lixisenatide; LDL‐C, low‐density lipoprotein cholesterol; PPG, postprandial plasma glucose; Q1, lower quartile; Q3, upper quartile; SD, standard deviation; TC, total cholesterol; TG, triglycerides.
Data are mean ± SD, except for TG, which is shown as median (Q1, Q3).
Of 736 patients randomized, the numbers of patients with lipid values available at both baseline and week 30 were 651 (TC and HDL‐C), 646 (TG) and 620 (LDL‐C).
3.2. Lipid levels
3.2.1. Changes in lipid levels by treatment group
After 30 weeks of treatment, the median percentage change in fasting TG levels from baseline was statistically different between iGlarLixi and iGlar (P = 0.035). While there was little change with iGlarLixi {0.3% [lower quartile (Q1), upper quartile (Q3): −19.8, 24.2]}, there was an increase of 6.5% (Q1, Q3: −15.8, 33.5) with iGlar (Figure 1A). Similarly, TC levels were unchanged from baseline with iGlarLixi [0% (Q1, Q3: −7.3, 10.1)], while an increase was observed with iGlar [3.4% (Q1, Q3: −5.6, 12.0)], showing a trend of more favourable TC levels with iGlarLixi (P = 0.059; Figure 1A). LDL‐C levels were nearly unchanged from baseline with iGlarLixi, while numerical increases were observed with iGlar (Figure 1A). For HDL‐C, a numerically greater reduction (median percentage change) was observed in patients on iGlarLixi versus iGlar (Figure 1A). In general, similar trends were observed for absolute changes in lipid ratios (Figure S1A) and absolute changes in lipid levels (Table S2).
Figure 1.
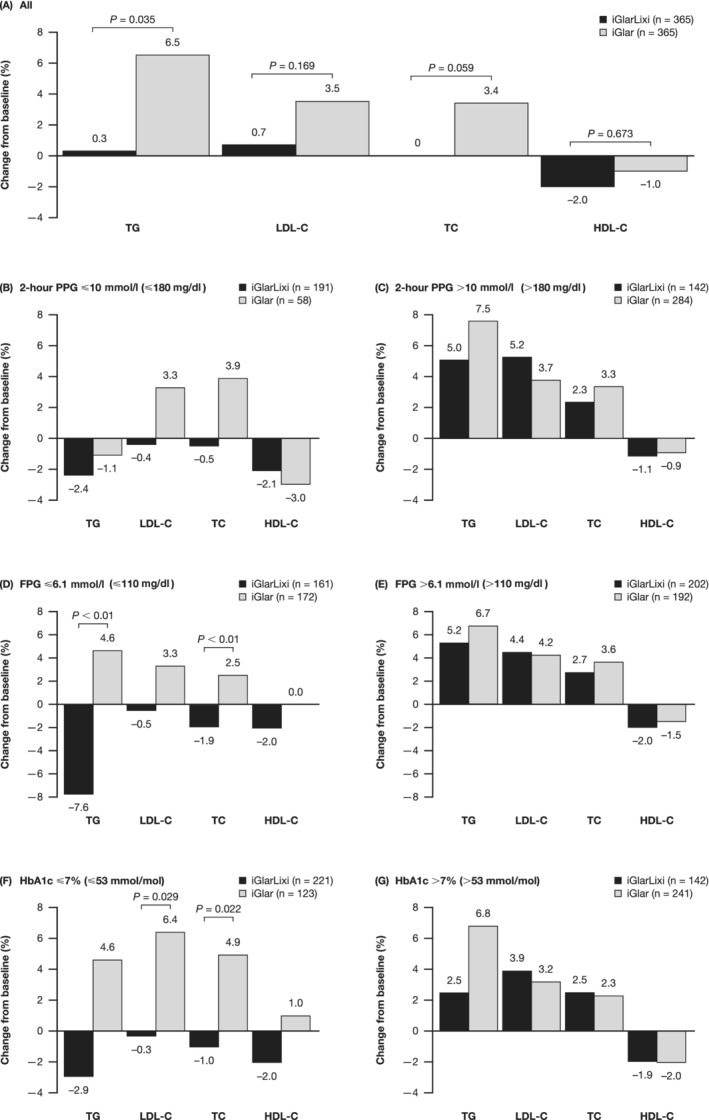
Median percentage change in fasting lipid levels from (A) baseline overall and (B–G) in patient subgroups stratified by achievement of glycaemic targets at week 30 (safety population). Percentage change = [(week 30 – Baseline)/baseline] × 100; P‐value calculated by Mann–Whitney U test. FPG, fasting plasma glucose; HDL‐C, high‐density lipoprotein cholesterol; iGlar, insulin glargine U100; iGlarLixi, insulin glargine and lixisenatide; LDL‐C, low‐density lipoprotein cholesterol; PPG, postprandial plasma glucose; TC, total cholesterol; TG, triglycerides
3.2.2. Improvement in lipid levels according to achievement of glycaemic targets
Changes in fasting lipid levels varied depending on whether or not patients achieved glycaemic targets (Figure 1B–G and Table S2). In the subgroups of patients who had met glycaemic targets, there was an improvement from baseline in lipid levels as assessed by median percentage change (TG, LDL‐C and TC) with iGlarLixi but not with iGlar across all glycaemic targets [PPG ≤10 mmoL/L (≤180 mg/dL)], FPG ≤6.1 mmoL/L (≤110 mg/dL) and HbA1c ≤7% (≤53 mmol/mol) at week 30; Figure 1B,D,F]. Similar trends were observed for mean (LDL‐C, TC) or median (TG) absolute changes from baseline in lipid levels (Table S2).
In patients meeting the FPG target [≤6.1 mmoL/L (≤110 mg/dL)] at week 30, median percentage changes from baseline in TG and TC were statistically different between iGlarLixi and iGlar, favouring iGlarLixi (Figure 1D); significant differences between iGlarLixi and iGlar were also observed for median percentage change from baseline in LDL‐C and TC in patients meeting the HbA1c target [≤7% (≤53 mmol/mol); Figure 1F; absolute changes summarized in Table S2]. By contrast, in subgroups of patients who did not meet glycaemic targets, no significant differences were observed between iGlarLixi and iGlar (Figure 1C,E,G; Table S2). Although significant differences were not consistently observed between groups in absolute changes in lipid ratios, numeric trends generally favoured iGlarLixi (Figure S1B–G).
After accounting for baseline lipid values, lipid‐lowering drugs and weight change during the study, iGlarLixi showed a trend towards more favourable changes in absolute levels of TG, LDL‐C and TC compared with iGlar alone overall, based on LS mean differences in change from baseline between iGlarLixi and iGlar (Figure S2A). For TC and LDL‐C, these trends were observed in subgroups meeting glycaemic targets across all three glycaemic variables (Figure S2B,D,F). In patients achieving the PPG target, statistically significant differences were observed for LDL‐C after adjusting for all three covariates together or individually (P < 0.05 for all, Figure S2B). For TG, more favourable outcomes with iGlarLixi versus iGlar overall and in patients meeting the FPG target were significant when adjusting for baseline TG value (P < 0.05) or antilipid therapy (P < 0.05), but not when adjusting for weight change alone (Figure S2A,D).
3.2.3. Body weight
Overall, patients generally experienced no weight gain or some weight loss with iGlarLixi regardless of whether glycaemic targets were met (Figure S3). However, changes in weight were more favourable for patients who achieved glycaemic targets (PPG, FPG and HbA1c) with iGlarLixi. By contrast, patients tended to experience some weight gain with iGlar, regardless of whether glycaemic targets were met (Figure S3).
3.2.4. iGlar doses
Mean iGlar doses at baseline and week 30 were similar between treatment groups and in patient subgroups stratified by achievement of glycaemic targets (Table S3).
4. DISCUSSION
This post hoc analysis of the LixiLan‐L trial showed that fixed‐ratio combination therapy with iGlarLixi was associated with more favourable lipid profiles compared with iGlar alone after 30 weeks of treatment in patients with type 2 diabetes uncontrolled on basal insulin. Furthermore, in patients who achieved glycaemic control, iGlarLixi was associated with improvements from baseline in lipid profiles; these improvements were not observed in patients treated with iGlar alone.
The improvement in lipid profiles with iGlarLixi over iGlar is probably provided by the short‐acting GLP‐1 RA component lixisenatide, as prior studies have showed the beneficial effects of lixisenatide and exenatide on lipid variables.5, 6, 8 The improvements observed with iGlarLixi may be partly mediated by its efficacy in correcting hyperglycaemia rather than by a direct effect on lipid levels, as the effect was clearly evident in patients who met glycaemic targets. However, patients on iGlar who achieved glycaemic targets did not show improvement in lipid profiles, pointing to a possible alternative mechanism for the lipid‐lowering effects of iGlarLixi, independent of its glycaemic effects. In general, a trend towards improvements in lipids with iGlarLixi versus iGlar was observed when adjusting for antilipid therapy, weight change and baseline lipids, suggesting that improvements, at least in part, were independent of these factors. Of note, the beneficial effect of iGlarLixi on LDL‐C levels in patients reaching their PPG target remained significant versus iGlar after adjusting for these covariates.
In line with other glucose‐lowering agents including GLP‐1 RAs, an improvement of HDL‐C was not observed with iGlarLixi.1, 14, 15 However, it should be noted that it is possible for compositional changes in HDL to confer antiatherogenic effects.14, 16 As lipid subclasses were not measured in the current study, the effect of iGlarLixi on HDL‐C composition could not be determined.
One limitation of the study was that postprandial lipids were not measured; as short‐acting GLP‐1 RAs such as lixisenatide have previously been shown to improve lipid variables following meals,5, 6, 8 it is possible that the addition of postmeal assessments would have yielded different results. Numerous other variables (eg, inflammatory markers, enzymes involved in lipid synthesis or metabolism, size of lipoproteins) could have provided additional information on potential changes in cardiovascular risk but were not designated for collection in the study. Another limitation was the open‐label design, but this was required to account for differences in the administration of iGlarLixi and iGlar. The study was also of short duration (30 weeks); therefore, long‐term studies will be required to assess duration of responses. As this was a post hoc analysis, the sample size and power calculations performed for primary study endpoints may not have been optimal for this analysis. Real‐world studies may help elucidate the effects of iGlarLixi on lipid profiles in routine clinical practice.
In conclusion, in patients with type 2 diabetes uncontrolled on basal insulin, achieving glycaemic control was associated with an improvement in the fasting lipid profile with iGlarLixi versus iGlar. Improvement in lipid levels in patients achieving glycaemic targets may contribute to cardiovascular benefits.
CONFLICT OF INTEREST
F. G. has received consulting fees from AstraZeneca, Boehringer Ingelheim, Eli Lilly, Novo Nordisk, Roche Diabetes Care and Sanofi; and has received research support from Eli Lilly, Lifescan and Takeda. A. Sh. is an employee of and has received consultancy fees from Sanofi. M. L. has received consultancy fees from BDM Consulting, Inc. and Sanofi. A. Sa. is an employee of and has received consultancy fees from Sanofi.
AUTHOR CONTRIBUTIONS
F. G. was involved in data analysis and interpretation, and critical revision of the manuscript. A. Sh., M. L. and A. Sa. were involved in data acquisition, analysis and interpretation, and critical revision of the manuscript. All authors confirm that they meet the International Committee of Medical Journal Editors uniform requirements for authorship and that they have read, reviewed and agreed to the final version.
Supporting information
Appendix S1. Supporting information.
ACKNOWLEDGMENTS
The LixiLan‐L trial was sponsored by Sanofi. Editorial assistance was provided by Mhairi Laird, PhD, of Caudex, Oxford, and was funded by Sanofi.
This paper was previously presented at the 53rd Annual Meeting of the European Association for the Study of Diabetes (EASD), 11–15 September 2017, Lisbon, Portugal, Poster 803.
Giorgino F, Shaunik A, Liu M, Saremi A. Achievement of glycaemic control is associated with improvements in lipid profile with iGlarLixi versus iGlar: A post hoc analysis of the LixiLan‐L trial. Diabetes Obes Metab. 2019;21:2712–2717. 10.1111/dom.13857
Funding information The LixiLan‐L trial was sponsored by Sanofi
REFERENCES
- 1. Haffner SM. American Diabetes Association. Management of dyslipidemia in adults with diabetes. Diabetes Care. 2003;26:S83‐S86. [DOI] [PubMed] [Google Scholar]
- 2. American Diabetes Association . Standards of medical care in diabetes‐2018. Diabetes Care. 2018;41:S1‐S156. [DOI] [PubMed] [Google Scholar]
- 3. Stamler J, Vaccaro O, Neaton JD, Wentworth D. Diabetes, other risk factors, and 12‐yr cardiovascular mortality for men screened in the multiple risk factor intervention trial. Diabetes Care. 1993;16:434‐444. [DOI] [PubMed] [Google Scholar]
- 4. Verges B. Pathophysiology of diabetic dyslipidaemia: where are we? Diabetologia. 2015;58:886‐899. [DOI] [PMC free article] [PubMed] [Google Scholar]
- 5. Schwartz EA, Koska J, Mullin MP, Syoufi I, Schwenke DC, Reaven PD. Exenatide suppresses postprandial elevations in lipids and lipoproteins in individuals with impaired glucose tolerance and recent onset type 2 diabetes mellitus. Atherosclerosis. 2010;212:217‐222. [DOI] [PubMed] [Google Scholar]
- 6. Schwartz SL, Ratner RE, Kim DD, et al. Effect of exenatide on 24‐hour blood glucose profile compared with placebo in patients with type 2 diabetes: a randomized, double‐blind, two‐arm, parallel‐group, placebo‐controlled, 2‐week study. Clin Ther. 2008;30:858‐867. [DOI] [PubMed] [Google Scholar]
- 7. Wei R, Ma S, Wang C, et al. Exenatide exerts direct protective effects on endothelial cells through the AMPK/Akt/eNOS pathway in a GLP‐1 receptor‐dependent manner. Am J Physiol Endocrinol Metab. 2016;310:E947‐E957. [DOI] [PubMed] [Google Scholar]
- 8. Whyte MB, Shojaee‐Moradie F, Sharaf SE, et al. Lixisenatide reduces chylomicron triacylglycerol by increased clearance. J Clin Endocrinol Metab. 2019;104:359‐368. [DOI] [PMC free article] [PubMed] [Google Scholar]
- 9. Abdel‐Latif RG, Heeba GH, Taye A, Khalifa MMA. Lixisenatide ameliorates cerebral ischemia‐reperfusion injury via GLP‐1 receptor dependent/independent pathways. Eur J Pharmacol. 2018;833:145‐154. [DOI] [PubMed] [Google Scholar]
- 10. Klonoff DC, Buse JB, Nielsen LL, et al. Exenatide effects on diabetes, obesity, cardiovascular risk factors and hepatic biomarkers in patients with type 2 diabetes treated for at least 3 years. Curr Med Res Opin. 2008;24:275‐286. [DOI] [PubMed] [Google Scholar]
- 11. Aroda VR, Rosenstock J, Wysham C, et al. Efficacy and safety of LixiLan, a titratable fixed‐ratio combination of insulin glargine plus lixisenatide in type 2 diabetes inadequately controlled on basal insulin and metformin: the LixiLan‐L randomized trial. Diabetes Care. 2016;39:1972‐1980. [DOI] [PubMed] [Google Scholar]
- 12. Wan EYF, Fong DYT, Fung CSC, et al. Development of a cardiovascular diseases risk prediction model and tools for Chinese patients with type 2 diabetes mellitus: a population‐based retrospective cohort study. Diabetes Obes Metab. 2018;20:309‐318. [DOI] [PubMed] [Google Scholar]
- 13. Yang H, Young D, Gao J, et al. Are blood lipids associated with microvascular complications among type 2 diabetes mellitus patients? A cross‐sectional study in Shanghai, China. Lipids Health Dis. 2019;18:18. [DOI] [PMC free article] [PubMed] [Google Scholar]
- 14. Haffner SM. Management of dyslipidemia in adults with diabetes. Diabetes Care. 1998;21:160‐178. [DOI] [PubMed] [Google Scholar]
- 15. Sun F, Wu S, Wang J, et al. Effect of glucagon‐like peptide‐1 receptor agonists on lipid profiles among type 2 diabetes: a systematic review and network meta‐analysis. Clin Ther. 2015;37:225‐241. [DOI] [PubMed] [Google Scholar]
- 16. Tian L, Li C, Liu Y, Chen Y, Fu M. The value and distribution of high‐density lipoprotein subclass in patients with acute coronary syndrome. PLoS One. 2014;9:e85114. [DOI] [PMC free article] [PubMed] [Google Scholar]
Associated Data
This section collects any data citations, data availability statements, or supplementary materials included in this article.
Supplementary Materials
Appendix S1. Supporting information.