

Abstract
Clot formation within membrane oxygenators (MOs) remains a critical problem during extracorporeal membrane oxygenation (ECMO). The composition of the clots—in particular, the presence of von Willebrand factor (vWF)—may be an indicator for prevalent nonphysiological flow conditions, foreign body reactions, or coagulation abnormalities in critically ill patients. Mats of interwoven gas exchange fibers from randomly collected MOs (PLS, Maquet, Rastatt, Germany) of 21 patients were stained with antibodies (anti‐vWF and anti‐P‐selectin) and counterstained with 4′,6‐diamidino‐2‐phenylindole. The extent of vWF‐loading was correlated with patient and technical data. While 12 MOs showed low vWF‐loadings, 9 MOs showed high vWF‐loading with highest accumulations close to crossing points of adjacent gas fibers. The presence and the extent of vWF‐fibers/“cobwebs,” leukocytes, platelet–leukocyte aggregates (PLAs), and P‐selectin‐positive platelet aggregates were independent of the extent of vWF‐loading. However, the highly loaded MOs were obtained from patients with a significantly elevated SOFA score, severe thrombocytopenia, and persistent liver dysfunction. The coagulation abnormalities of these critically ill patients may cause an accumulation of the highly thrombogenic and elongated high‐molecular‐weight vWF multimers in the plasma which will be trapped in the MOs during the ECMO therapy.
Keywords: extracorporeal membrane oxygenation, liver dysfunction, shear stress, SOFA score, thrombogenesis, von Willebrand factor
1. INTRODUCTION
Adult venovenous extracorporeal membrane oxygenation (VV‐ECMO) is now a well‐established therapy for respiratory failure. Increasing experience, broader indications, fewer contraindications, improved technology, and individually adapted anticoagulation regimens did not prevent clot formation within the circuit. Clotting remains a threatening complication with serious consequences for the patient.1, 2 The incidence of ECMO‐induced thrombosis is reported to be up to 30%3 with multifactorial underlying mechanisms. Crucial factors for clot formation and device failure are long‐lasting constant contact of blood with artificial surfaces, high shear forces caused by the ECMO device, or coagulation abnormalities in the critically ill patients.4
The analysis of thrombus specimens provides useful information regarding the pathophysiological process leading to thrombosis.5 The clots in membrane oxygenators (MOs) were comprised of fibrin strands, platelet‐rich aggregates, and trapped red blood cells6, 7 as well as leukocytes and von Willebrand factor (vWF) accumulations.8, 9 The crucial role of vWF in hemostasis and thrombosis during ECMO is of particular interest.10, 11, 12 However, the significance of this protein during the ECMO therapy is controversial. Its plasma concentration is highly variable depending on the coagulation and septic status of the patients.13 Furthermore, elongated vWF and platelets were found in arterial thrombi and indicate high‐shear thrombosis that is distinct from low‐shear coagulation and platelet adhesion.14 Finally, high shear stress produced in particular within mechanical devices such as ECMO circuits or ventricular assist devices (VAD) is responsible for the development of an acquired von Willebrand syndrome (AVWS).10, 11 High shear stress results in a conformational change of the high‐molecular‐weight vWF (HMWvWF) multimers predisposing it to proteolytic cleavage by ADAMTS13 (a disintegrin and metalloproteinase with a thrombospondin type 1 motif, member 13) and/or allows the binding to platelet glycoprotein GPIb by exposing the vWF‐A1‐domain.15, 16, 17 The precise mechanisms remain unknown. Therefore, prognosis of bleeding or thromboembolic events during ECMO support is still prevented.4
In this study, we analyzed randomly selected MOs from VV‐ECMO patients with regard to the topographic prominence of vWF accumulations. Different vWF‐structures and their colocalization to leukocytes, platelets, or its aggregates were identified on the surface of the gas exchange fibers. Finally, MOs with low and high extent of vWF‐loadings were related to clinical and technical parameters.
2. MATERIALS AND METHODS
2.1. Study design
Bioline‐coated polymethylpentene (PMP) MOs (PLS, Maquet Cardiopulmonary, Rastatt, Germany) were removed from 21 randomly selected patients with respiratory failure that required VV‐ECMO support (Table 1). MOs were collected after termination of ECMO support (successful weaning, n = 13; death, n = 2) or after replacement of the MOs during therapy (n = 6).3 ECMO patients included in this study were treated as described earlier.3 During the ECMO therapy, patients were anticoagulated with unfractionated heparin (n = 12) or argatroban (n = 9) (1/9 additionally with aspirin). Coagulation testing including activated partial thromboplastin time (aPTT), international normalized ration (INR), and platelet count was employed for coagulation monitoring and therapy guidance.
Table 1.
Patient characteristics and selected laboratory parameters before ECMO implantation
| All | Extent of vWF‐loadings | P value | ||
|---|---|---|---|---|
| Low | High | |||
| N | 21 | 12 | 9 | |
| Male gender (n; %) | 18; 86 | 11; 92 | 7; 78 | 0.553 |
| Age (years) | 56 (33‐68) | 60 (53‐71) | 37 (29‐57) | 0.070 |
| BMI (kg/m2) | 27.5 (25.9‐32.7) | 27.6 (25.7‐30.7) | 27.5 (25.9‐36.2) | 0.859 |
| SOFA score | 13 (12‐18) | 13 (12‐14) | 18 (14‐19) | 0.025 |
| LIS | 3.7 (3.3‐3.7) | 3.7 (3.4‐3.7) | 3.3 (3.3‐3.7) | 0.249 |
| Days on ventilation | 1.0 (0.0‐6.0) | 1.5 (0.0‐16.0) | 1.0 (0.0‐3.0) | 0.379 |
| Heparin/argatroban (n) | 12/9 | 6/6 | 6/3 | 0.611 |
| Acute renal failure (n; %) | 5; 24 | 2; 17 | 3; 33 | 0.611 |
| Blood group 0 (n; %) | 6; 29 | 3; 25 | 3; 33 | 1,000 |
| Pulm./extrapulm. ALF (n) | 17/4 | 10/2 | 7/2 | 1,000 |
| Sepsis (n; %) | 12; 57 | 6; 50 | 6; 67 | 0.660 |
| aPTT (seconds) | 44 (40‐65) | 43 (38‐62) | 44 (40‐72) | 0.522 |
| Antithrombin III (%) | 51.0 (34.0‐71.0) | 60.5 (41.8‐71.0) | 35.0 (24.0‐51.5) | 0.054 |
| INR | 1.3 (1.2‐1.7) | 1.3 (1.1‐1.5) | 1.4 (1.3‐1.7) | 0.094 |
| D‐dimers (mg/L) | 5.0 (3.5‐9.5) | 6.5 (5.0‐16.3) | 5.0 (1.5‐8.0) | 0.162 |
| Fibrinogen (g/L) | 512 (225‐750) | 574 (403‐815) | 410 (202‐629) | 0.456 |
| Platelets (× 109/L) | 176 (41‐265) | 223 (160‐438) | 56 (21‐188) | 0.036 |
| Free hemoglobin (mg/L) | 43 (29‐110) | 41 (28‐110) | 48 (30‐111) | 0.815 |
| LDH (U/L) | 462 (288‐624) | 480 (269‐728) | 400 (303‐566) | 0.749 |
| PaO2/FiO2 (mm Hg) | 72 (59‐93) | 85 (59‐93) | 62 (59‐86) | 0.337 |
| AST (U/L) | 65 (50‐163) | 63 (38‐126) | 134 (53‐297) | 0.118 |
| Bilirubin (mg/dL) | 1.1 (0.5‐2.6) | 0.8 (0.3‐1.9) | 1.6 (0.7‐3.3) | 0.269 |
| Norepinephrine (µg/kg/min) | 0.28 (0.14‐0.58) | 0.22 (0.12‐0.53) | 0.33 (0.14‐1.01) | 0.500 |
| Epinephrine (µg/kg/min) | 0.00 (0.00‐0.00) | 0.00 (0.00‐0.00) | 0.00 (0.00‐0.17)a | 0.015 |
| Hemoglobin (g/dL) | 9.9 (8.0‐11.7) | 11.0 (8.2‐12.0) | 8.9 (7.7‐10.6) | 0.270 |
| Creatinine (mg/dL) | 1.2 (1.1‐1.6) | 1.2 (0.9‐1.4) | 1.5 (1.2‐2.7) | 0.042 |
| White blood cells (×109/L) | 15.8(8.4‐21.4) | 15.5 (8.7‐18.2) | 15.8 (6.1‐21.2) | 0.831 |
| C‐reactive protein (mg/L) | 190 (58‐248) | 198 (58‐248) | 154 (41‐262) | 0.671 |
Data show median (IQR) or absolute number.
Abbreviations: ALF, acute lung failure; aPTT, activated partial thromboplastin time; AST, aspartate aminotransferase; BMI, body mass index; INR, international normalized ratio; LDH, lactate dehydrogenase; LIS, lung injury score; PaO2/FiO2, ratio of partial pressure of arterial oxygen and fraction of inspired oxygen; SOFA, sequential organ failure assessment.
Four patients of the high vWF‐group were treated with epinephrine.
2.2. Preparation of MOs
The preparation of MOs was already described earlier.10 Briefly, removed MOs were rinsed with physiologic saline, fixed with 4% paraformaldehyde which was subsequently substituted with saccharose (increasing concentrations, 10%, 20%, and 30%), frozen at −20°C, and stored at −80°C. The frozen MOs were then segmented into nine blocks without thawing. From these cutout blocks consisting of stacked mats of interwoven gas exchange fibers, one randomly selected single mat was removed, trimmed to a sample size of 0.5 cm × 1.3 cm (referred as “sample”), and rehydrated in phosphate‐buffered saline (PBS).
2.3. Immunofluorescence
Each sample was washed in PBST (PBS plus 0.1% TritonX100; room temperature, RT) and blocked with donkey serum (10% in PBST; 30 min, RT). Specific monoclonal antibodies [mouse anti‐human P‐selectin (1:200); rabbit anti‐human vWF (1:50); DAKO, Cambridgeshire, UK], were used to incubate the samples overnight at 4°C. Samples were washed with PBST, stained with secondary antibodies for 90 minutes at RT [1:1000; donkey anti‐mouse IgG‐fluorescein isothiocyanate (FITC); donkey anti‐rabbit IgG‐Texas Red; DAKO], and counterstained with DAPI (4′,6‐diamidino‐2‐phenylindole‐dihydrochloride; 0.75 µg/mL in PBST; Vector Laboratories, Peterborough, UK) (30 min, RT). The samples were placed on a microscope slide, embedded in Fluoromount‐G (SouthernBiotech, Birmingham, AL, USA), covered with a coverslip and imaged using a Leica DMRBE fluorescence microscope (Leica Microsystems, Bensheim, Germany). To estimate the extent of cellular deposits and vWF accumulations, the central gas capillary of the stained sample was selected and photographed using a Spot2000 camera (Diagnostic Instruments, Sterling Heights, MI, USA) under software control (Visiview (R), Visitron Systems GmbH, Puchheim, Germany) resulting in micrographs with a resolution of 1600 × 1200 pixels. For quantification of cellular coverage (DAPI) and vWF accumulations, 12 nonoverlapping images of the central capillary were obtained with each fluorescence channel (20× lens; resolution, 0.375 µm/pixel). Details of representative cells and vWF‐structures were documented (40× lens; resolution, 0.187 µm/pixel).
2.4. Estimation of cellular depositions and vWF accumulation using fluorescence intensity
DAPI‐staining of nuclei was used to visualize the colonization of PMP capillaries by nucleated cells. Anti‐human vWF‐staining and P‐selectin staining were engaged to document accumulations of vWF‐structures and platelet deposits on the gas exchange fibers, respectively. Quantitative measurement of the fluorescence intensity of DAPI and vWF was accomplished as described earlier.10 The samples were divided into two groups depending on the extent of vWF accumulations. A representative sample for each of the two groups (high/low vWF) is shown in Figure 1A. Figure 1B shows the evaluation of the chosen threshold on fluorescence intensity, distinguishing between low and high vWF‐loadings.
Figure 1.
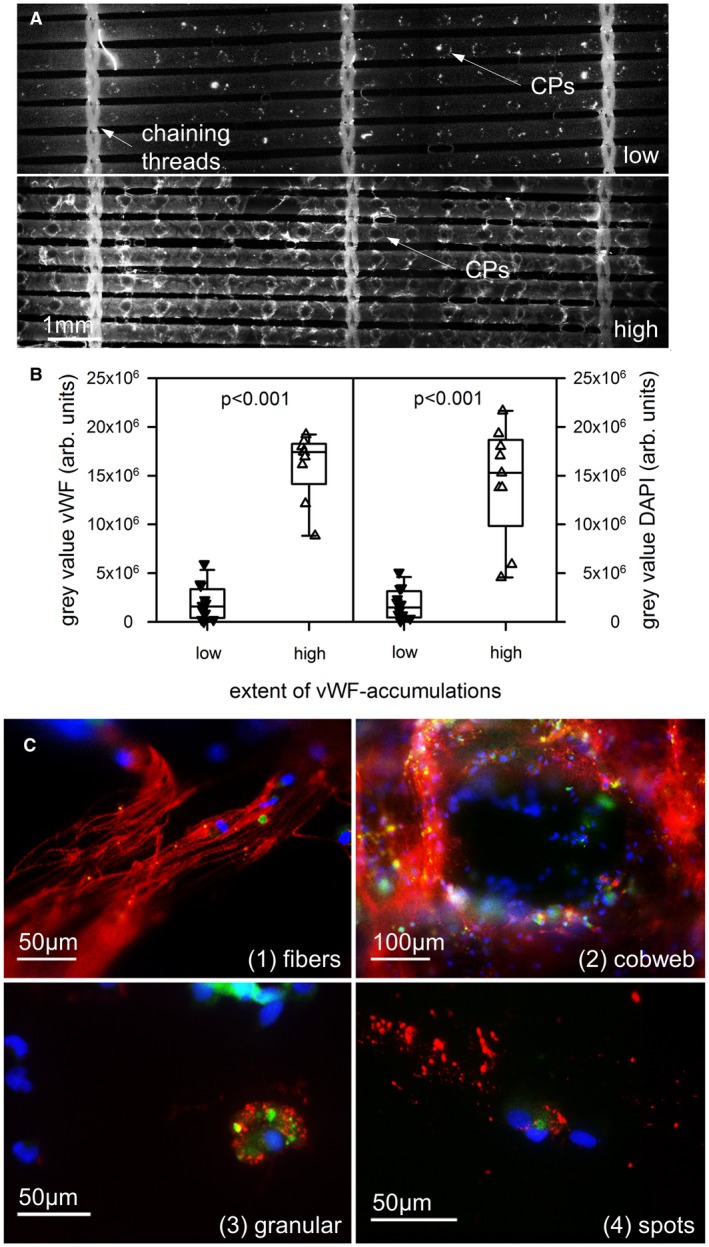
vWF structures were accumulated on the gas exchange fibers within used membrane oxygenators to a different extent. A, Overview of 5‐6 gas fibers between three chaining threads. While low vWF‐loadings (upper part) presented small local deposits around the crossing points (CPs), high loadings (lower part) were detected all over the gas fibers with high density around the CPs and the threads. B, 9 oxygenators were loaded with high vWF accumulation and high density of nucleated (DAPI stained) cells. C, The gas exchange fibers were covered with different vWF‐structures: long vWF‐fibers, cobweb‐like vWF‐structures, cytoplasmic granular structures close to DAPI‐stained nuclei, and extracellular vWF‐spots distant from a nucleus. DAPI, blue; vWF, red; P‐selectin, green [Color figure can be viewed at https://wileyonlinelibrary.com]
2.5. Data collection and statistical analysis
Data were collected prospectively (Regensburg ECMO database) and binded. The study was approved by the Ethics Committee of the University of Regensburg (vote # 106‐336‐104).
Data from groups with low and high vWF‐loadings are reported as median and interquartile ranges (IQR). The nonparametric Mann‐Whitney U test was used to identify significant differences between groups for scalar parameters. For comparing proportions between the nominal groups with low and high vWF‐loadings (eg, gender ratio and discharge from hospital) the Fisher’s exact test was employed. Two‐way analysis of variance was used to compare the mean differences between the study groups (low and high loadings) regarding the daily measurements before system removal (eg, pressure drop across the MOs, dpMO; blood flow, BF; D‐dimers, fibrinogen, and platelet counts). If there is a statistical difference in the experimental groups a post hoc test (Bonferroni) was carried out for a multiple comparison procedure. A P value ≤ 0.05 was considered statistically significant. The software package IBM SPSS Statistics 20.0 (IBM Corp., Armonk, NY, USA) was used for the statistical evaluation.
3. RESULTS
3.1. Classification of the MOs according to the topographic prominence of vWF accumulation on gas exchange fibers
Figure 1A shows representative examples of gas exchange fibers with low (upper row) and high (lower row) accumulations of vWF‐structures. Highest staining intensity was found around the crossing points (CPs) of adjacent gas fibers (long arrows) and close to the chaining threads (short arrow). Nine samples (43%) presented high vWF‐loadings with significantly higher gray values for the vWF‐stained structures compared to the low vWF‐loading group (Figure 1B, left side, P < 0.001).
Double staining of the samples with vWF and DAPI revealed colocalization of high vWF‐loading with high accumulation of nucleated cells. The intensity of DAPI‐stained nuclei (DAPI gray value) from samples with high vWF‐loading was significantly higher compared to the low vWF‐loading group (Figure 1B, right side, P < 0.001).
3.2. Identification of different vWF‐structures on the gas exchange fibers
The surfaces of the gas exchange fibers were searched for different vWF‐structures. Detailed top views (magnification, 400×) of the gas exchange fibers uncovered four recurring vWF‐structures (Figure 1C):
Fiber‐like structures (vWF‐fibers; length 10‐100 µm; diameter > 1 µm),
Cobweb‐like structures with thin and branching threads (diameter < 1 µm),
Cytoplasmic granular structures close to a DAPI‐positive nucleus (defined as platelet–leukocyte aggregates, PLAs),
Extracellular vWF‐spots (distant from a DAPI‐positive nucleus).
As shown in Table 2, there was no difference in the frequency of the different vWF‐structures comparing gas exchange fibers with high and low vWF‐loadings from different MOs. vWF‐fibers were localized in six MOs. The vWF‐fibers presented a median (IQR) length of 90 (50‐100) µm and a median diameter of 3 (3‐5) µm.
Table 2.
Detection of different vWF‐structures on the surface of gas exchange fibers
| Extent of vWF‐loadings | P value | ||
|---|---|---|---|
| Low | High | ||
| N | 12 | 9 | |
| vWF‐fibers (n; %) | 3; 25 | 3; 33 | 1.000 |
| Cobweb‐like structures (n; %) | 3; 25 | 6; 67 | 0.175 |
| Cytoplasmic granula (n; %) | 11; 92 | 8; 89 | 0.450 |
| Extracellular spots (n; %) | 10; 83 | 5; 56 | 0.127 |
Statistics used Fisher’s exact test.
3.3. Localization of activated platelets on the gas exchange fibers
Samples with high vWF‐loading presented highest density of vWF as well as nuclei annularly around the CPs (Figure 1A). The direct catchment area around the cell/protein‐free CP gathered nucleated cells and P‐selectin‐positive structures surrounded by a seam of vWF‐positive structures and formed a circular arrangement with a radius of about 200 µm (Figure 2). The border area consisted of nucleated cells, PLAs, and extracellular vWF‐spots. Samples with low vWF‐loading showed adhesion of isolated nuclei, PLAs, and extracellular vWF‐spots within a radius <100 µm around CPs (Figure 3). Due to the low cell density, it was possible to represent even the isolated localization of P‐selectin in the cytoplasm of nucleated cells (Figure 3).
Figure 2.
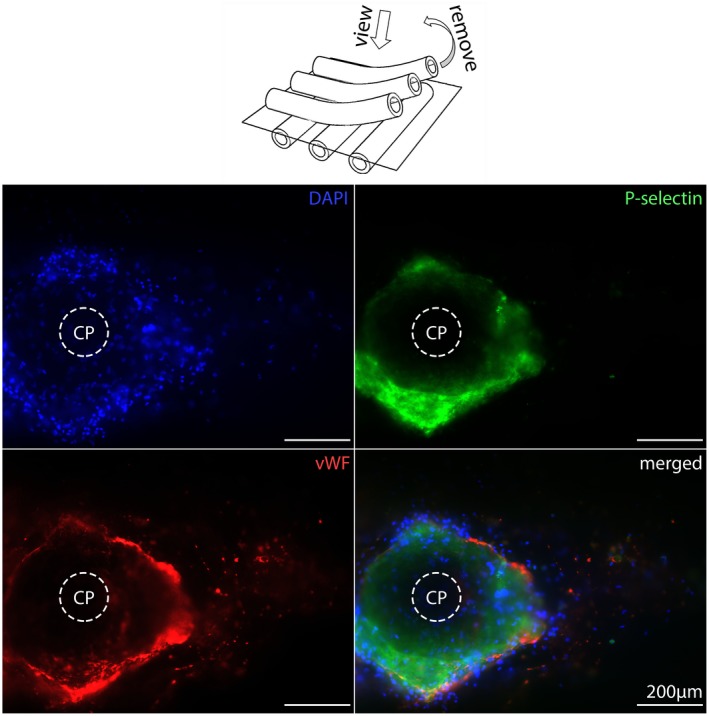
Crossing points (CPs) from high vWF‐loaded gas exchange fibers. The center of the CPs is empty while the nucleated cells (DAPI, blue), activated platelets (P‐selectin, green), and high extent of vWF (red) accumulated around the CPs [Color figure can be viewed at https://wileyonlinelibrary.com]
Figure 3.
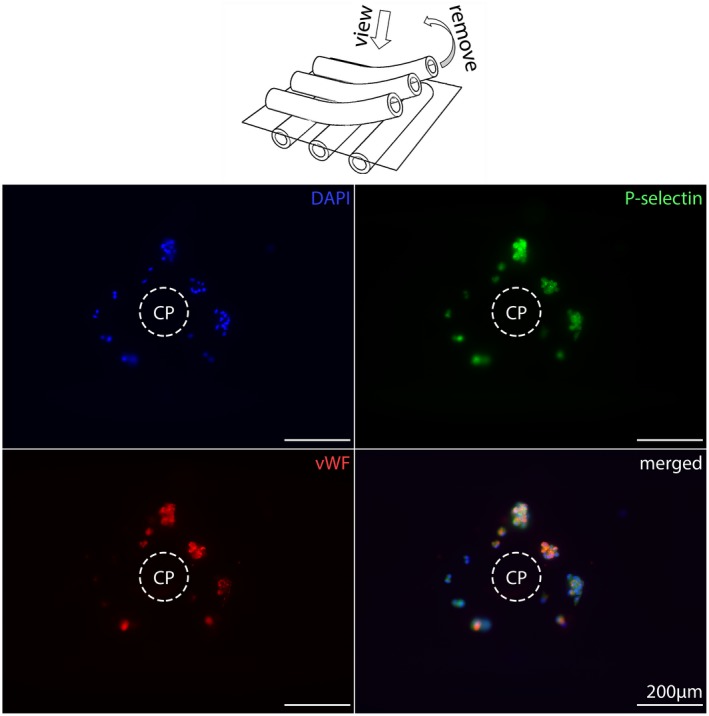
Crossing points (CPs) from low vWF‐loaded gas exchange fibers. The center of the CPs is empty but decorated with small aggregates consisting of a few nucleated cells (DAPI, blue), with P‐selectin‐positive (green) platelets in their cytoplasm (PLAs, platelet–leukocyte aggregates) as well as cytoplasmic and extracellular vWF‐spots (red) [Color figure can be viewed at https://wileyonlinelibrary.com]
To get additional information about the spatial arrangement of the different cell/protein layers in depth, stacked samples were embedded in paraffin, cut perpendicular to the gas exchange fibers, and stained with DAPI (blue) and antibodies (vWF, red; P‐selectin, green). Different areas of cells/proteins were identified, starting from the surface of gas exchange fibers reaching into the blood‐filled space between a longitudinal and two cross‐sliced gas exchange fibers (Figures 4 and 5). MOs with high vWF‐loading presented uniformly distributed nucleated cells within the thrombotic deposits, while vWF‐staining was observed at a mean distance of 20 ± 15 µm to the surface of cross‐sliced gas exchange fibers. Activated platelets were colocalized with the vWF‐structures. The composition of deposits around the CPs was heterogeneous consisting mostly of extended vWF‐positive areas with incorporated nuclei and P‐selectin‐positive areas. In contrast, MOs with low vWF‐loading showed single nuclei in close contact to vWF‐ and P‐selectin‐positive spots (PLAs) next to the surfaces of the gas exchange fibers or attached to the threads connecting neighboring gas exchange fibers (Figure 5). These triple‐stained PLAs were detected in top view micrographs as well as in the cross sections. About one‐third of the adherent cells were PLAs. PLAs were detected on all samples without regard to the extent of their vWF‐loading. The quantity of detected PLAs was lower on densely populated gas exchange fibers. However, the high vWF‐loading may mask the presence of the triple‐stained PLAs.
Figure 4.
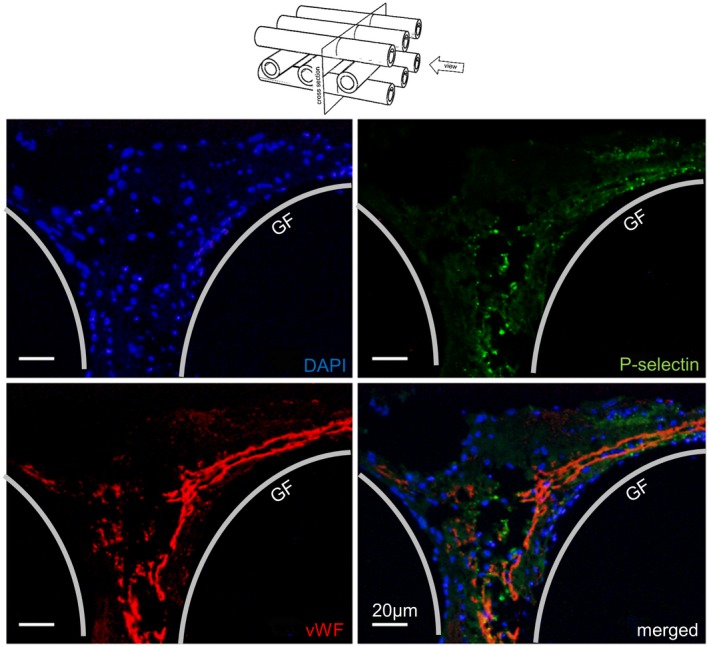
Cross section of a blood ducting area from high vWF‐loaded gas exchange fibers. The area (between two cross and one lengthwise sliced gas fibers, GF) presented equally distributed nuclei (DAPI, blue), embedded into P‐selectin‐positive (green) platelets, and extended vWF‐structures (red) consisting of extended vWF‐fibers, cobweb‐like structures, and granular deposits [Color figure can be viewed at https://wileyonlinelibrary.com]
Figure 5.
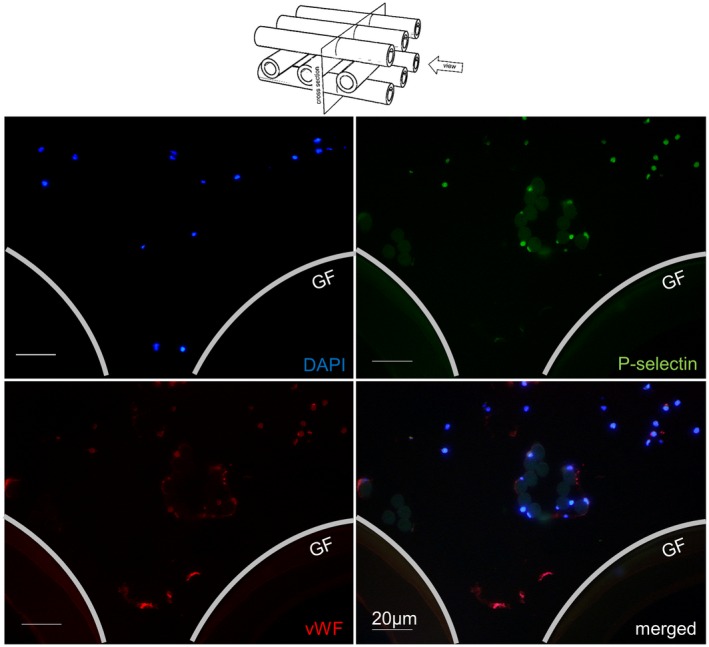
Cross section of a blood ducting area from low vWF‐loaded gas exchange fibers. The area (between two cross and one lengthwise sliced gas fibers, GF) presented only a few nuclei (DAPI, blue), P‐selectin (green), and vWF (red) double‐stained platelet aggregates as well as some PLAs. The round structures (faintly green) in the middle of the sample are crosscut chaining threads with adherent leukocytes, PLAs, and small vWF‐positive platelet aggregates [Color figure can be viewed at https://wileyonlinelibrary.com]
3.4. Correlation of high vWF‐loading on gas exchange fibers with clinical and ECMO data
Differences in patient characteristics and ECMO data from groups of patients with low and high vWF‐loading within their MOs are presented in Tables 1 (before ECMO) and 3 (during ECMO). Statistical analysis of patient’s characteristics revealed that high vWF‐loading are associated with elevated SOFA scores (P = 0.025), increased creatinine (P = 0.042), and severe thrombocytopenia (P = 0.036). Twelve patients were supported with ECMO to treat acute lung failure (ALF) secondary to a septic disease pattern. The distribution was the same for both groups (low vWF, 6/12; high vWF, 6/9; P = 0.660). There was no difference in the distribution of the blood group 0 to others (A, AB, and B) (each group, n = 3, not different), nor between pulmonary and extra‐pulmonary ALF (low/high vWF‐loading, 10/2 vs. 7/2, not significant). All patients were invasively ventilated before ECMO support. Other patient data and initial coagulation and inflammatory parameters showed no differences (Table 1).
Table 3.
Selected data during ECMO support
| Extent of vWF‐loading | P value | ||
|---|---|---|---|
| Low | High | ||
| N | 12 | 9 | |
| Indication MO removal (n; %) | 0.081 | ||
| Weaning (end of therapy) | 5; 42 | 8; 89 | |
| Death (end of therapy) | 2; 16 | 0; 0 | |
| Exchange (during therapy) | 5; 42 | 1; 11 | |
| MO life span (days) | 9 (6‐14) | 8 (6‐18) | 0.830 |
| Time to MO removal (days) | 11 (7‐20) | 8 (6‐22) | 0.915 |
| Total ECMO time (days) | 13 (8‐21) | 8 (6‐25) | 0.593 |
| Transfusion ofa | |||
| RBC per day (U) | 0.55 (0.29‐1.17) | 0.38 (0.17‐0.90) | 0.477 |
| FFP per day (U) | 0.36 (0.00‐1.40) | 0.36 (0.00‐0.71) | 0.884 |
| PC per day (U) | 0.01 (0.00‐0.26) | 0.38 (0.00‐0.88) | 0.328 |
Data show median (IQR) or absolute number.
Transfusion requirements of RBC and red blood cell concentrate; PC, platelet concentrate; 1 U = 300 mL; FFP, fresh frozen plasma, 1 U = 200 mL; MOs, membrane oxygenators.
The analyzed MOs were collected after termination of ECMO (high vWF, n = 8; low vWF, n = 7) or after removal of the MOs during therapy (exchange) (high vWF, n = 1; low vWF, n = 5) (Table 3). The reasons for the MO exchange during therapy were (a) systemic thrombosis after restricted heparinization (extended bleeding after surgical chest intervention) (high vWF, n = 1), (b) imminent coagulation disorder (high levels of D‐dimers, low concentrations of fibrinogen, and low numbers of platelets) (low vWF, n = 3), (c) indication of a severe septic event (low vWF, n = 1), and (d) acute MO thrombosis with a sudden increase in dpMO (low vWF, n = 1).3 As shown in Figure 6, blood flow was downregulated within 3 days before MO removal (P = 0.002). The extent of vWF‐loading had no effect. dpMO remained unchanged (P = 0.392). The O2 and CO2 transfer values decreased within 3 days before MO removal (P = 0.134 and P < 0.001, respectively). In particular, the CO2 transfer on the day of removal was significantly higher for the low vWF‐group (P = 0.031). Within the considered time frame of 3 days before MO removal, the concentrations of D‐dimers (P = 0.885) and fibrinogen (P = 0.925), the number of platelets (P = 0.995), aPTT (P = 0.979), and INR (P = 0.879) were unremarkable and not different between the two study groups. Furthermore, there was no severe hemolysis (P = 0.869). Leukocytes and CRP were also not different regarding both groups (P = 0.342 and P = 0.510, respectively). However, the levels of liver enzymes (AST, aspartate transaminase; bilirubin) were significantly higher in the high vWF‐group compared to the low vWF‐group (P = 0.002; P = 0.011, respectively).
Figure 6.
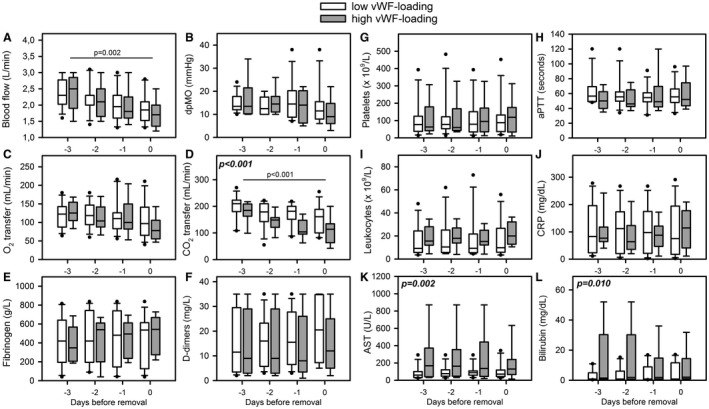
Time period of ECMO and laboratory data before oxygenator removal. Specific data from patients of the low vWF‐loading (n = 12, white boxes) and the high vWF‐loading (n = 9, gray boxes) were presented as median (IQR). Data included A, blood flow; B, pressure drop across the MO (dpMO); C, oxygen transfer (O2 transfer); D, carbon dioxide transfer (CO2 transfer); E, fibrinogen; F, D‐dimer levels; G, platelet counts; H, activated partial thromboplastin time (aPTT); I, leukocyte count; J, C‐reactive protein (CRP); K, aspartate transferase (AST); and L, bilirubin. Statistics comparing differences between low and high vWF‐loading groups were presented in bold and cursive letters. Time dependent decreases of blood flow and CO2 transfer were presented with a line
The extent of vWF‐loadings did not affect the MO life span (P = 0.830), the time to MO removal (P = 0.915), or the total ECMO time (P = 0.593). In addition, there was no difference in the supplied transfusion of blood products (Table 3).
4. DISCUSSION
In this study of patients requiring ECMO support, we found a heterogeneous vWF‐loading on the gas exchange fibers within used MOs. vWF‐fibers were detected in 6/21 MOs independently of the overall extent of vWF‐loading. Nine of 21 MOs were covered with extended and gas fiber‐spanning vWF‐deposits. These MOs originated from patients with a significantly higher initial SOFA score and severe thrombocytopenia. Extended vWF‐loading reduced the CO2 transfer capacity of the MOs, but there was no effect on dpMO, the life span of the MO, and the risk of a system exchange. Nevertheless, patients with highly loaded gas exchange fibers presented aggravated liver dysfunction during ECMO support.
Although vWF and cellular deposits were found in every analyzed MO, the allocation was heterogeneous as well within a single MO as across the MOs from different patients. The surface of the gas exchange fibers of all analyzed MOs was covered with different vWF‐structures. First, interactions between blood and artificial surfaces trigger adsorption of plasma adhesion proteins which then are capable of mediating platelet and/or leukocyte adhesion.18, 19 The vWF only plays a subordinate role in primary protein adsorption.20 As vWF is stored in the alpha‐granules of platelets, the detected extracellular vWF‐spots are most likely vWF‐positive platelet aggregates. These vWF‐spots were always P‐selectin‐negative and therefore, represent nonactivated platelet aggregates (Figure 1C). Additionally, the detected small granular structures in the vicinity of nucleated cells represent either endothelial cells that stored vWF within the Weibel–Palade bodies, or PLAs. However, in vivo endothelialization of PMP‐gas exchange fibers during the ECMO therapy was excluded.9, 21 Therefore, these structures represent PLAs consisting of platelets either cell membrane bound on or phagocytosed by leukocytes. Mostly, not only vWF but also P‐selectin was found close to nuclei. PLAs were considered as a sensitive marker of platelet activation22 and play an important role in the pathogenesis of thrombotic conditions.23 Crucial for the PLA‐formation is the interaction between platelet P‐selectin and its receptor on leukocytes (PSGL‐1, P‐selectin glycoprotein ligand‐1). Platelet–leukocyte interaction starts a signaling cascade, resulting in the activation of the beta‐2 integrin Mac‐1 and in the firm adhesion between the two cell types.23 Elevated PLA counts are associated with a range of acute and chronic thrombo‐inflammatory conditions such as cardiovascular diseases, acute lung injury, rheumatoid arthritis, inflammatory bowel disease, stroke, and glomerulonephritis.24, 25, 26, 27, 28, 29, 30 Elevated PLAs additively were not only detected in blood during the early stage of acute myocardial infarction (AMI), but also in the core region of coronary thrombi.31
In this study, the samples with vWF‐positive, highly branched and gossamer threads as well as bundles of elongated fibers being mainly arranged around the CPs interspersed with high density of nucleated cells and activated platelets are of special interest (Figures 1C and 2). Such vWF structures are indicators for a vWF‐mediated high‐shear clotting mechanism within MOs.14 The additional localization of P‐selectin‐positive regions close to the vWF‐structures indicates platelet accumulations due to pathologically high shear rates (>5000 s−1).14, 32, 33 Shear stress induced a conformational change from a compacted, globular state to a stretched, elongated conformation of the vWF multimers.34 The formation of long vWF‐fibers (>20 µm) or ‐nets in platelet‐free plasma under pathologically high shear rates was demonstrated under in vitro conditions using collagen‐coated as well as in collagen‐free micropost‐impingement microfluidic devices. This exposes the binding sites (vWF‐A1‐domain) for the platelets (GPIba and GPIIb/IIIa).32, 35 Additionally, the elongation contributes to the formation of vWF nets, creating thousands of bonds which are required to capture circulating platelets at very high shear rates.36 The use of one ECMO system (PLS) consisting of one MO type and one type of centrifugal pump guarantees comparable flow regimes (Figure 6), but then the vWF‐fibers/nets should be identifiable in all MOs. However, in the present study, the vWF‐fibers/nets were only detectable in 6/21 MOs (29%). Crucial parts are missing in this puzzle.
Since we expected that high accumulations of vWF and leukocytes increase the diffusion path of the gas exchange fibers9 and worsen the performance of the MOs, we focused on the comparison of high versus low vWF‐loaded MOs. However, high vWF‐loading did not aggravate O2 and CO2 transfer capacities of the MOs, nor resulted in an increase of dpMO or alteration of coagulation and inflammatory factors.3 Furthermore, the life span of the analyzed MOs that may allow the accumulation of less or high deposits was also comparable. There was no difference in the consumption of blood products in particular not of FFP that contains high levels of coagulation factors such as vWF. The only conspicuous features of this vWF‐phenomenon were a high SOFA score and severe thrombocytopenia of the patients with high vWF‐loading. These critically ill patients also presented persistent liver dysfunction until the time of MO removal37 destabilizing thromboregulation.38 The accumulation of plasmatic HMWvWF multimers and ADAMTS13 deficiency is another consequence of liver dysfunction.38 Claus et al. confirmed that critically ill patients with a SOFA score ≥10 showed a significantly lower ADAMTS13 activity.39 ADAMTS13 is a metalloproteinase, produced in hepatic stellate cells, and specifically cleaves HMWvWF.38 ADAMTS13 deficiency (due to consumption and/or decreased production) results in high levels of plasmatic HMWvWF multimers, in turn inducing platelet aggregation or thrombus formation under high shear stress, followed by thromboembolic complications and thrombocytopenia. This is simply due to the increased number of presented binding domains accompanied by stronger mechanical forces applied to the domains resulting from larger molecules.33 Low concentrations of ADAMTS13 are also associated with an increased risk of arterial thrombosis40 including myocardial infarction41 and cerebrovascular disease.42, 43 In the present study, due to the lack of laboratory measurements of vWF and ADAMTS13 levels/activities in plasma no correlations with the extent of vWF deposits on the gas exchange fibers can be drawn.
Obviously, organ dysfunction—in particular of the liver—increases the imbalance between the concentrations of HMWvWF multimers and its size‐regulating protease ADAMTS13. The following mechanism is conceivable: blood components (plasma proteins, HMWvWF multimers, platelets, leukocytes, etc.) are transported by blood flow to geometrical features in the MO, where deposition and accumulation is likely (eg, gas exchange fiber contact areas or chaining threads), since prevalent flow velocity and shear are relatively low in these regions. The flow around the gas exchange fibers can be divided into different zones in terms of velocity and shear rate. However, since blood is a heterogeneous suspension and shows complex non‐Newtonian behavior of so far unknown extent, distinct statements are difficult. Regarding shear rates, <1000 s−1 could be perceived as low, >5000 s−1 as high, and in between somehow ambivalent. Flow velocity can be classified by means of the local Reynolds number (Re) and based on the hydraulic diameter (approx. 75 µm). In this study, Re < 1 is considered to be “low flow,” that is, the velocities range from 0 to 8 mm/s. The flow velocity in the MO is about 2 m/s, which corresponds to a Re of 30. Thus, the flow is laminar and flow separation may occur. The deposited constituents bind to vWF, any by chance activated (ie, elongated) HMWvWF multimer that is transported toward this area will be tethered to that deposition. Due to the size of HMWvWF multimers, even in a (re‐)coiled state, the flow around the gas exchange fibers is able to exert forces high enough to elongate the HMWvWF multimers (>50 Pa) and thus, expose the binding domains permanently. This shear‐induced extension of vWF multimers is a function of the applied forces.33 Originating from the initial depositions in low flow/low shear areas (eg, the contact region of two crossing gas exchange fibers), the attached HMWvWF multimers protrude into the high flow/high shear regions in the narrow gap between two neighboring gas exchange fibers (Figure 4). Therefore, the majority of platelets or freely floating vWF is likely to get in the vicinity and bind to this initially tethered vWF‐structure. In the beginning, this is a self‐supporting mechanism, as the local flow (and shear rate) in this area is still high enough to activate (ie, elongate) vWF multimers. When the deposition on the surface of the gas exchange fibers starts to grow into the blood ducting area, the flow velocity and shear stress will decrease due to the increasing resistance around this particular gas exchange fiber. This gives already captured and only reversibly bound platelets the time to bind irreversibly to vWF and form a stable clot.9, 44
5. CONCLUSION AND OUTLOOK
Membrane oxygenators from ECMO patients are loaded with vWF structures, PLAs, activated platelets, and leukocytes. Thrombosis, potentially induced by high shear stress, was only observed in a subgroup of ECMO patients with a high SOFA score, thrombocytopenia, and liver dysfunction. In particular, liver dysfunction causes ADAMTS13 deficiency or loss of activity that prevents the cleavage of HMWvWF multimers. This imbalance may promote a potential shear‐induced mechanism for clot initiation and progression in MOs. These patients require special anticoagulation therapy. The proposed interplay mechanism between flow and clot formation in MOs needs further investigation.
CONFLICT OF INTEREST
The authors state that they have no conflict of interest.
ACKNOWLEDGMENTS
This work was in‐house funded. The authors gratefully thank Katrin Bielenberg for excellent technical assistance.
Steiger T, Foltan M, Philipp A, et al. Accumulations of von Willebrand factor within ECMO oxygenators: Potential indicator of coagulation abnormalities in critically ill patients? Artif Organs. 2019;43:1065–1076. 10.1111/aor.13513
REFERENCES
- 1. Zangrillo A, Landoni G, Biondi‐Zoccai G, Greco M, Greco T, Frati G, et al. A meta‐analysis of complications and mortality of extracorporeal membrane oxygenation. Crit Care Resusc. 2013;15:172–8. [PubMed] [Google Scholar]
- 2. Murphy DA, Hockings LE, Andrews RK, Aubron C, Gardiner EE, Pellegrino VA, et al. Extracorporeal membrane oxygenation‐hemostatic complications. Transfus Med Rev. 2015;29:90–101. [DOI] [PubMed] [Google Scholar]
- 3. Lubnow M, Philipp A, Foltan M, Bull Enger T, Lunz D, Bein T, et al. Technical complications during veno‐venous extracorporeal membrane oxygenation and their relevance predicting a system‐exchange—retrospective analysis of 265 cases. PLoS ONE. 2014;9:e112316. [DOI] [PMC free article] [PubMed] [Google Scholar]
- 4. Thomas J, Kostousov V, Teruya J. Bleeding and thrombotic complications in the use of extracorporeal membrane oxygenation. Semin Thromb Hemost. 2018;44:20–9. [DOI] [PubMed] [Google Scholar]
- 5. Riegger J, Byrne RA, Joner M, Chandraratne S, Gershlick AH, ten Berg JM, et al. Prevention of Late Stent Thrombosis by an Interdisciplinary Global European Effort (PRESTIGE) Investigators. Histopathological evaluation of thrombus in patients presenting with stent thrombosis. A multicenter European study: a report of the prevention of late stent thrombosis by an interdisciplinary global European effort consortium. Eur Heart J. 2016;37:1538–49. [DOI] [PMC free article] [PubMed] [Google Scholar]
- 6. Philipp A, Müller T, Bein T, Foltan M, Schmid F‐X, Birnbaum D, et al. Inhibition of thrombocyte aggregation during extracorporeal lung assist: a case report. Perfusion. 2007;22:293–7. [DOI] [PubMed] [Google Scholar]
- 7. Beely BM, Campbell JE, Meyer A, Langer T, Negaard K, Chung KK, et al. Electron microscopy as a tool for assessment of anticoagulation strategies during extracorporeal life support: the proof is on the membrane. ASAIO J. 2016;62:525–32. [DOI] [PMC free article] [PubMed] [Google Scholar]
- 8. Lehle K, Philipp A, Gleich O, Holzamer A, Müller T, Bein T, et al. Efficiency in extracorporeal membrane oxygenation‐cellular deposits on polymethylpentene membranes increase resistance to blood flow and reduce gas exchange capacity. ASAIO J. 2008;54:612–7. [DOI] [PubMed] [Google Scholar]
- 9. Wilm J, Philipp A, Müller T, Bredthauer A, Gleich O, Schmid C, et al. Leukocyte adhesion as an indicator of oxygenator thrombosis during extracorporeal membrane oxygenation therapy? ASAIO J. 2018;64:24–30. [DOI] [PubMed] [Google Scholar]
- 10. Tauber H, Ott H, Streif W, Weigel G, Loacker L, Fritz J, et al. Extracorporeal membrane oxygenation induces short‐term loss of high‐molecular‐weight von Willebrand factor multimers. Anesth Analg. 2015;120:730–6. [DOI] [PubMed] [Google Scholar]
- 11. Kalbhenn J, Schlagenhauf A, Rosenfelder S, Schmutz A, Zieger B. Acquired von Willebrand syndrome and impaired platelet function during venovenous extracorporeal membrane oxygenation: rapid onset and fast recovery. J Heart Lung Transplant. 2018;37:985–91. [DOI] [PubMed] [Google Scholar]
- 12. Proudfoot AG, Davidson SJ, Strueber M. von Willebrand factor disruption and continuous‐flow circulatory devices. J Heart Lung Transplant. 2017;36:1155–63. [DOI] [PubMed] [Google Scholar]
- 13. Kawecki C, Lenting PJ, Denis CV. von Willebrand factor and inflammation. Thromb Haemost. 2017;15:1285–94. [DOI] [PubMed] [Google Scholar]
- 14. Casa L, Ku DN. Thrombus formation at high shear rates. Annu Rev Biomed Eng. 2017;19:415–33. [DOI] [PubMed] [Google Scholar]
- 15. Shankaran H, Alexandridis P, Neelamegham S. Aspects of hydrodynamic shear regulating shear‐induced platelet activation and self‐association of von Willebrand factor in suspension. Blood. 2003;101:2637–45. [DOI] [PubMed] [Google Scholar]
- 16. Nascimbene A, Neelamegham S, Frazier OH, Moake JL, Dong JF. Acquired von Willebrand syndrome associated with left ventricular assist device. Blood. 2016;127:3133–41. [DOI] [PMC free article] [PubMed] [Google Scholar]
- 17. Baumann Kreuziger L, Slaughter MS, Sundareswaran K, Mast AE. Clinical relevance of histopathologic analysis of HeartMate II thrombi. ASAIO J. 2018;64:754–9. [DOI] [PMC free article] [PubMed] [Google Scholar]
- 18. Gorbet MB, Sefton MV. Biomaterial‐associated thrombosis: roles of coagulation factors, complement, platelets and leukocytes. Biomaterials. 2004;25:5681–703. [DOI] [PubMed] [Google Scholar]
- 19. Jaffer IH, Fredenburgh JC, Hirsh J, Weitz JI. Medical device‐induced thrombosis: what causes it and how can we prevent it? J Thromb Haemost. 2015;13 Suppl 1:S72–81. [DOI] [PubMed] [Google Scholar]
- 20. Tsai WB, Grunkemeier JM, McFarland CD, Horbett TA. Platelet adhesion to polystyrene‐based surfaces preadsorbed with plasmas selectively depleted in fibrinogen, fibronectin, vitronectin, or von Willebrand’s factor. J Biomed Mater Res. 2002;60:348–59. [DOI] [PubMed] [Google Scholar]
- 21. Lehle K, Friedl L, Wilm J, Philipp A, Müller T, Lubnow M, et al. Accumulation of multipotent progenitor cells on polymethylpentene membranes during extracorporeal membrane oxygenation. Artif Organs. 2016;40:577–85. [DOI] [PubMed] [Google Scholar]
- 22. Nagasawa A, Matsuno K, Tamura S, Hayasaka K, Shimizu C, Moriyama T. The basis examination of leukocyte‐platelet aggregates with CD45 gating as a novel platelet activation marker. Int J Lab Hematol. 2013;35:534–41. [DOI] [PubMed] [Google Scholar]
- 23. Cerletti C, Tamburrelli C, Izzi B, Gianfagna F, de Gaetano G. Platelet‐leukocyte interactions in thrombosis. Thromb Res. 2012;129:263–6. [DOI] [PubMed] [Google Scholar]
- 24. Zarbock A, Singbartl K, Ley K. Complete reversal of acid‐induced acute lung injury by blocking of platelet‐neutrophil aggregation. J Clin Invest. 2006;116:3211–9. [DOI] [PMC free article] [PubMed] [Google Scholar]
- 25. Bunescu A, Seideman P, Lenkei R, Levin K, Egberg N. Enhanced Fcgamma receptor I, alphaMbeta2 integrin receptor expression by monocytes and neutrophils in rheumatoid arthritis: interaction with platelets. J Rheumatol. 2004;31:2347–55. [PubMed] [Google Scholar]
- 26. Arber N, Berliner S, Pras E, Arber L, Fishelson Z, Kahn Y, et al. Heterotypic leukocyte aggregation in the peripheral blood of patients with leukemia, inflammation and stress. Nouv Rev Fr Hematol. 1991;33:251–5. [PubMed] [Google Scholar]
- 27. Irving PM, Macey MG, Feakins RM, Knowles CH, Frye JN, Liyanage SH, et al. Platelet‐leucocyte aggregates form in the mesenteric vasculature in patients with ulcerative colitis. Eur J Gastroenterol Hepatol. 2008;20:283–9. [DOI] [PubMed] [Google Scholar]
- 28. Setianto BY, Hartopo AB, Gharini PP, Anggrahini DW, Irawan B. Circulating soluble CD40 ligand mediates the interaction between neutrophils and platelets in acute coronary syndrome. Heart Vessels. 2010;25:282–7. [DOI] [PubMed] [Google Scholar]
- 29. Zachem CR, Alpers CE, Way W, Shankland SJ, Couser WG, Johnson RJ. A role for P‐selectin in neutrophil and platelet infiltration in immune complex glomerulonephritis. J Am Soc Nephrol. 1997;8:1838–44. [DOI] [PubMed] [Google Scholar]
- 30. Kuligowski MP, Kitching AR, Hickey MJ. Leukocyte recruitment to the inflamed glomerulus: a critical role for platelet‐derived P‐selectin in the absence of rolling. J Immunol. 2006;176:6991–9. [DOI] [PubMed] [Google Scholar]
- 31. Maugeri N, Campana L, Gavina M, Covino C, De Metrio M, Panciroli C, et al. Activated platelets present high mobility group box 1 to neutrophils, inducing autophagy and promoting the extrusion of neutrophil extracellular traps. J Thromb Haemost. 2014;12:2074–88. [DOI] [PubMed] [Google Scholar]
- 32. Herbig BA, Diamond SL. Pathological von Willebrand factor fibers resist tissue plasminogen activator and ADAMTS13 while promoting the contact pathway and shear‐induced platelet activation. J Thromb Haemost. 2015;13:1699–708. [DOI] [PMC free article] [PubMed] [Google Scholar]
- 33. Fu H, Jiang Y, Yang D, Scheiflinger F, Wong WP, Springer TA. Flow‐induced elongation of von Willebrand factor precedes tension‐dependent activation. Nat Commun. 2017;8:324. [DOI] [PMC free article] [PubMed] [Google Scholar]
- 34. Siedlecki CA, Lestini BJ, Kottke‐Marchant KK, Eppell SJ, Wilson DL, Marchant RE. Shear‐dependent changes in the three‐dimensional structure of human von Willebrand factor. Blood. 1996;88:2939–50. [PubMed] [Google Scholar]
- 35. Colace TV, Diamond SL. Direct observation of von Willebrand factor elongation and fiber formation on collagen during acute whole blood exposure to pathological flow. Arterioscler Thromb Vasc Bio. 2013;33:105–13. [DOI] [PMC free article] [PubMed] [Google Scholar]
- 36. Wellings PJ, Ku DN. Mechanisms of platelet capture under very high shear. Cardiovasc Eng Tech. 2012;3:161–70. [Google Scholar]
- 37. Roch A, Hraiech S, Masson E, Grisoli D, Forel J‐M, Boucekine M, et al. Outcome of acute respiratory distress syndrome patients treated with extracorporeal membrane oxygenation and brought to a referral center. Intensive Care Med. 2014;40:74–83. [DOI] [PMC free article] [PubMed] [Google Scholar]
- 38. Uemura M, Fujimura Y, Ko S, Matsumoto M, Nakajima Y, Fukui H. Pivotal role of ADAMTS13 function in liver diseases. Int J Hematol. 2010;91:20–9. [DOI] [PubMed] [Google Scholar]
- 39. Claus R, Bockmeyer C, Budde U, Kentouche K, Sossdorf M, Hilberg T, et al. Variations in the ratio between von Willebrand factor and its cleaving protease during systemic inflammation and association with severity and prognosis of organ failure. Thromb Haemost. 2009;101:239–47. [PubMed] [Google Scholar]
- 40. Sonneveld MA, de Maat MP, Leebeek FW. Von Willebrand factor and ADAMTS13 in arterial thrombosis: a systematic review and meta‐analysis. Blood Rev. 2014;28:167–78. [DOI] [PubMed] [Google Scholar]
- 41. Maino A, Siegerink B, Lotta LA, Crawley JTB, le Cessie S, Leebeek FWG, et al. Plasma ADAMTS‐13 levels and the risk of myocardial infarction: an individual patient data meta‐analysis. J Thromb Haemost. 2015;13:1396–404. [DOI] [PubMed] [Google Scholar]
- 42. Sonneveld MAH, de Maat MPM, Portegies MLP, Kavousi M, Hofman A, Turecek PL, et al. Low ADAMTS13 activity is associated with an increased risk of ischemic stroke. Blood. 2015;126:2739–46. [DOI] [PubMed] [Google Scholar]
- 43. Denorme F, Kraft P, Pareyn I, Drechsler C, Deckmyn H, Vanhoorelbeke K, et al. Reduced ADAMTS13 levels in patients with acute and chronic cerebrovascular disease. PLoS ONE. 2017;12:e0179258. [DOI] [PMC free article] [PubMed] [Google Scholar]
- 44. Casa LD, Deaton DH, Ku DN. Role of high shear rate in thrombosis. J Vasc Surg. 2015;61:1068–80. [DOI] [PubMed] [Google Scholar]