Abstract
The receptor lipid Gb3 is responsible for the specific internalization of Shiga toxin (STx) into cells. The head group of Gb3 defines the specificity of STx binding, and the backbone with different fatty acids is expected to influence its localization within membranes impacting membrane organization and protein internalization. To investigate this influence, a set of Gb3 glycosphingolipids labeled with a BODIPY fluorophore attached to the head group was synthesized. C24 fatty acids, saturated, unsaturated, α‐hydroxylated derivatives, and a combination thereof, were attached to the sphingosine backbone. The synthetic Gb3 glycosphingolipids were reconstituted into coexisting liquid‐ordered (l o)/liquid‐disordered (l d) giant unilamellar vesicles (GUVs), and STx binding was verified by fluorescence microscopy. Gb3 with the C24:0 fatty acid partitioned mostly in the l o phase, while the unsaturated C24:1 fatty acid distributes more into the l d phase. The α‐hydroxylation does not influence its partitioning.
Keywords: carbohydrates, fatty acids, fluorescence, membranes, toxins
Making the invisible visible: Shiga toxin B subunits (STxB) bind to liquid‐ordered (l o) domains in model membranes, implying that its receptor Gb3 is localized in these l o domains. The synthetic access to Gb3 glycosphingolipids with labeled head groups allows quantification of their partitioning in coexisting l o/l d (liquid‐disordered) phase giant unilamellar vesicles prior to STxB binding. The data clearly indicate an impact of the fatty acid (un)saturation and α‐hydroxylation on the partitioning between phases.

Introduction
The eukaryotic plasma membrane of animals is a heterogeneous structure with a plethora of different lipids. The main lipid components are glycerophospholipids, sterols, and sphingolipids.1 Among them, glycosphingolipids serve a particular role. They are found in the outer leaflet of the plasma membrane and are discussed to reside preferentially in so‐called raft domains, which are enriched in sphingomyelin (SM) and cholesterol (Chol).2, 3, 4 Their size, chemical composition, and physical characteristics are tightly associated with their signal processing capabilities.5 Raft domains are supposed to have diameters of 10–200 nm and are highly dynamic structures.3, 6 This combination of smallness and dynamics bears the major challenge in visualizing raft domains in cellular membranes.4 Hence, two approaches have been pursued within the last decades to shed some light on the structure and function of these domains. On the one hand, detergent‐resistant membranes were extracted from cells and their composition analyzed, however they turned out to be prone to artefacts.7 On the other hand, artificial membranes with lipid compositions resembling the outer leaflet of the plasma membrane were reconstituted, which separate into a liquid‐disordered (l d) and a liquid‐ordered (l o) phase.8 Typical lipid compositions comprise a low‐melting glycerophospholipid, a high‐melting glycerophospholipid or SM, and Chol.9 The l d phase has loose lateral lipid packing, acyl chains with gtg kinks, and fast lateral diffusion. In contrast, the l o phase is characterized by a tighter lipid packing and a higher degree of order, but still rather fast lateral diffusion.10 However, the size and physical properties of l o domains formed in artificial membranes are very different from those found in the plasma membrane. This difference becomes obvious if comparing, for example, the physicochemical properties of coexisting l o/l d phase‐separated GUVs with those of phase‐separated cell‐derived membranes termed giant plasma membrane vesicles (GPMVs).11 Despite this difference between the natural and artificial membrane systems, artificial coexisting l o/l d membranes have been frequently used to analyze the partitioning of receptor lipids and proteins,12 such as bacterial toxins, in the different phases.13
Bacterial toxins are known to bind to specific glycosphingolipids embedded in the outer leaflet of the plasma membrane. Cholera toxin (CTx) produced by Vibrio cholerae and Shiga toxin (STx) produced by Shigella dysenteriae and by enterohemorrhagic strains of Escherichia coli, both belonging to the class of AB5 toxins,14 bind specifically to monosialotetrahexosylganglioside (GM1)15 and globotriaosyl ceramide (Gb3),16, 17 respectively. While the head groups of the glycosphingolipids indeed define the specificity of protein binding, not much attention has been drawn to the variability of the ceramide backbone harboring different fatty acids. In various cell types (human colon Caco‐2, HCT‐8 epithelial cells, human endothelial cell lines, primary human umbilical vein endothelial cells, primary human endothelial cells of the brain and the kidney,18 and references therein), a conserved repertoire of Gb3 species was found carrying saturated C16:0, C22:0, or C24:0 fatty acids as well as the unsaturated C24:1 fatty acid. Results of Lingwood and co‐workers19 suggest that the pathogenic outcome of Shiga toxin producing E. coli (STEC) infections is related to the different Gb3 species. To gather more molecular information, artificial membranes doped with Gb3 were employed. In coexisting l o/l d supported lipid membranes, Gb3 species differing in their fatty acid gave rise to a different phase behavior before and after binding of the B subunits of STx (STxB) as well as differences in the protein organization on the membrane surface.20, 21 In giant unilamellar vesicles (GUVs), Gb3 species with an unsaturated acyl chain caused the formation of tubular invaginations upon STxB binding, in contrast to Gb3 with a saturated acyl chain.22 In all these studies, it became evident that STxB binds exclusively to the l o phase, which also implies that the receptor Gb3 is localized in the l o phase after protein binding. However, it remains unclear how Gb3 is distributed in coexisting l o/l d membranes prior protein binding.
To get access to this information, an approach based on fluorescently labeled Gb3 molecules can be pursued. However, it turned out that, if a fluorescent label is attached to the fatty acid position to ensure that the STxB interaction with the head group is not influenced by the fluorophore, binding of STxB is greatly altered.23 If a fatty acid labeled Gb3 is reconstituted into l o/l d phase‐separated GUVs, the protein binds to the l d phase and not to the l o phase as known from membranes containing naturally occurring Gb3.
To date, only a few examples are found in the literature where synthetic routes towards glycosphingolipids with labeled head groups have been described.24 Here, we decided on a new strategy in line with approaches pursued for GM1 and GM3 25 and focused on head group labeled Gb3. The idea is to develop fluorescently labeled Gb3 glycosphingolipids without altering its binding properties to STxB. We attached a fluorophore via an oligoethylene glycol spacer to the 2′‐OH group of the middle galactose of the Gb3 head group, which is not involved in STxB binding as deduced from crystal structure analysis17 and binding studies of different trisaccarides.26 This approach in turn allows us to alter the fatty acid of the Gb3 molecules.
Results and Discussion
We synthesized a set of Gb3 sphingolipids as depicted in Scheme 1. Altogether eight different glycosphingolipids were synthesized and they consist of the globotriaose head group with two different oligoethylene glycol (PEG) linkers, to which a BODIPY fluorophore was attached and the sphingosine. Saturated, unsaturated, α‐hydroxylated derivatives, and a combination thereof were prepared, all based on a C24 fatty acid. C24 fatty acids were chosen as they are the major constituent (>50 %) found in natural Gb3 mixtures such as toxin insensitive erythrocytes,27 HeLa‐cells,28 and HEp‐2 cells.29
Scheme 1.
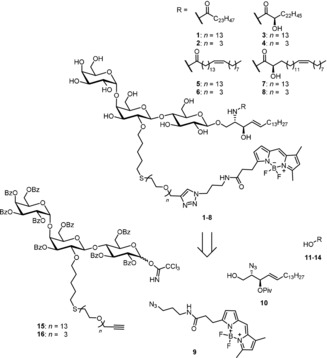
Retrosynthetic analysis of head group labeled Gb3PEGnR derivatives (n=3,13, R=different fatty acids C24:0H, C24:0OH, C24:1H and C24:1OH).
To access the head group labeled Gb3 derivatives with different fatty acids and PEG linker lengths we designed a modular convergent synthesis in which a variation of the fatty acid and the fluorophore is possible with minimal synthetic effort (Scheme 1). In contrast to semisynthetic approaches, a convergent total synthesis ensures the highly defined nature of the obtained material, which was crucial for our biophysical experiments. The retrosynthetic analysis of the desired structures 1–8 led to four different components. The commercially available BODIPY dye 9 should be attached to the carbohydrate head group in the last step of the synthesis by a Huisgen cycloaddition (click chemistry). The sphingosine core should be introduced as the azido sphingosine 10. The azide serves as a masked amine which undergoes amide coupling with the four selected fatty acids (11–14) with a C24 backbone. Assembling the globotriose building blocks 15 and 16, in which the 2‐hydroxy group of the middle galactose was modified with the PEG linker and the reducing end was activated for the glycosylation reaction with 10, would be the most challenging endeavor during this synthesis. Monosaccharide building blocks with carefully chosen patterns of temporary and permanent protecting groups had to be synthesized starting from the simple monosaccharides d‐glucose and d‐galactose.
Naturally occurring Gb3 molecules carry 24 carbon long fatty acids, either saturated or monounsaturated.30 The galactosyl trichloroacetimidate 17, galactosyl phosphate 18, and glucoside 19 were identified as suitable precursors to build up the trisaccharide (Scheme 2). They were prepared according to literature procedures.31 The union of 18 and 19 under Lewis‐acidic conditions utilizing TMSOTf as a promoter afforded the respective (1→4)‐linked disaccharide. Perfect β‐selectivity was observed because of the neighboring‐group participation of the Fmoc group of 18. During the course of the reaction the para‐methoxybenzyl group of the galactose was cleaved,32 yielding the lactose acceptor for the second glycosylation step with 17 under Lewis‐acidic conditions without any additional deprotection step. The desired α‐configured product was isolated as the main product when diethyl ether was used as a cosolvent. Subsequent removal of the Fmoc protecting group with piperidine led to the trisaccharide 20.
Scheme 2.
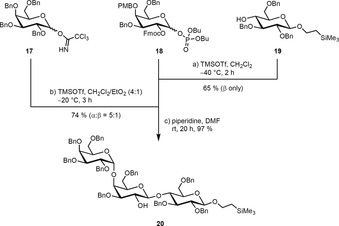
Assembly of the Gb3 trisaccharide.
The trisaccharide 20 was then equipped with a pentenyl chain in the position where the fluorophore needs to be attached (Scheme 3). In the next step the substrate was subjected to Birch conditions to remove all benzyl protecting groups. Despite the strongly reducing conditions, the anomeric CH2CH2TMS group and the pentenyl handle stayed intact. Deprotection was followed by DMAP‐mediated benzoylation. In contrast to benzyl groups, benzoyl esters have the advantage that they can be easily removed at the end of the synthetic route without affecting the double bond in the lipid part of the glycosphingolipid.21 To attach the PEG linker, the double bond of the pentenyl handle was first transformed into a thioester with tioacetic acid under radical conditions. This species was hydrolyzed under basic conditions and the emerging highly nucleophilic thiol was subsequently reacted with the PEG bromides 21 (13 ethylene glycol units) and 22 (3 ethylene glycol units). To ensure a full protection of all hydroxy groups, the benzoylation step was repeated. Finally, the anomeric protecting group was removed with trifluoroacetic acid and the reducing end was converted into the corresponding trichloroacetimidates 15 and 16.
Scheme 3.
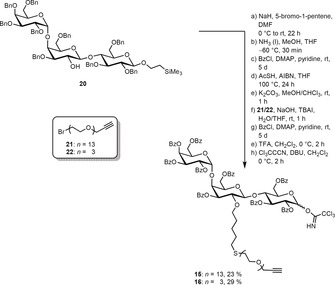
Synthesis of the trichloroacetimidates 15 and 16 with two different PEG linkers.
To build up the glycolipid, the trichloroacetimidates were reacted with the protected azidosphingosine 10,33 which was synthesized starting from the chiral pool compound l‐serine (for detailed information see the Supporting Information), in a glycosylation reaction utilizing TMSOTf as the Lewis acid to afford 23 and 24 in moderate yields (Scheme 4). Comparing experiments with globotriaosyl trichloroacetimidates devoid of the PEG modification indicated that the Lewis‐basic linker might hamper this very sensitive glycosylation step. Staudinger reduction of the azides and direct coupling with the fatty acids 11–14,21, 34 without isolating the intermediary amines, afforded the PEG‐modified glycosphingolipids 25–32. Global deprotection under Zemplén conditions set the stage for the final step of the synthesis. The commercially available BODIPY dye 9 was introduced into the glycosphingolipids by coupling its azide unit with the alkyne moiety of the PEG linker under mild copper(I)‐catalyzed conditions (Scheme 5). In total, eight different fluorescently labeled glycosphingolipids (1–8), varying in the PEG linker length and the acyl chain of the fatty acid, were obtained. The linker length (n) is either 3 or 13 oligoethylene glycol groups. The fatty acid (Cm:Δ) is either saturated (C24:0) or unsaturated (C24:1). Hydroxylation at the α‐position is indicated by OH, and non‐hydroxylation is indicated by H.
Scheme 4.
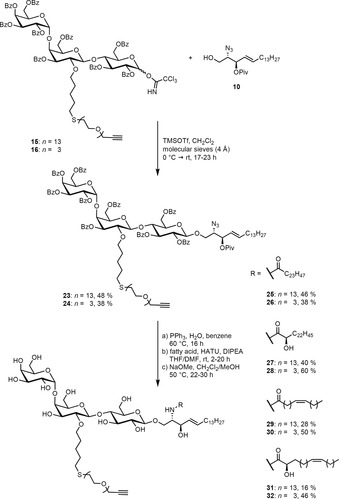
Gb3 glycosphingolipid assembly.
Scheme 5.
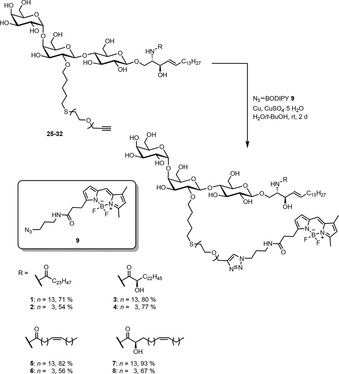
Huisgen cycloaddition of the BODIPY derivative 9 with the glycosphingolipids 25–32.
Starting with the saturated C24 fatty acid and a PEG spacer composed of 13 oligoethylene glycol units, we prepared GUVs composed of the well‐known raft mixture 1,2‐dioleoyl‐sn‐glycero‐3‐phosphocholine (DOPC)/SM‐porc/Chol labeled with 5 mol % 1 and 0.25 mol % Texas Red‐DHPE (39.75/35/20/5/0.25) to address the question of whether STxB is indeed still capable of binding to the head group modified Gb3 and whether it binds to the l o phase as expected.
Figure 1 shows representative confocal images of a GUV in a 500 nm STxB‐Cy5 (monomer) solution. Texas Red‐DHPE partitions preferentially in the l d phase, visualizing the coexisting l o/l d membrane (Figure 1 A). The fluorescence image of STxB‐Cy5 shows that STxB binds to the GUV and that it binds to the l o phase (Figure 1 B). This result confirms our hypothesis that the fluorescent label at the 2′‐OH position does not greatly interfere with the binding properties of STxB and is suited to investigate the partition of different Gb3 species as a function of the fatty acid in coexisting l o/l d membranes.
Figure 1.
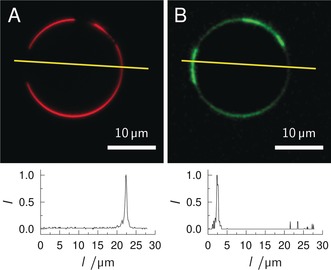
Confocal images of a phase‐separated GUV composed of DOPC/SM‐porc/Chol/1/Texas Red‐DHPE (39.75/35/20/5/0.25) in an aqueous solution of STxB‐Cy5 (500 nm, monomer). A) Texas Red‐DHPE fluorescence (red). B) STxB‐Cy5 fluorescence (green). The yellow lines indicate the position of the fluorescence intensity profiles shown below the images.
To quantitatively compare the phase partitioning among the different Gb3 species, we used the fluorophore Dy731‐DOPE as l d marker23 to guarantee that the fluorescence of the BODIPY labeled Gb3 does not spectrally overlap with the absorption of the l d marker. Moreover, the concentration of Gb3 was reduced from 5 to 1 mol % to ensure that self‐quenching of the BODIPY fluorophore is minimized (see Figure S1 in the Supporting Information). GUVs composed of DOPC/SM‐porc/Chol/Gb3/Dy731 (39/39/20/1/1) were prepared. As it is known that the composition of GUVs obtained by electroformation is rather heterogeneous,35 at least two independent GUV preparations with about 30 individual GUVs each were analyzed. Confocal z‐stack images were measured for each GUV and line profiles were taken from each slice, where phase separation was visible. An example of fluorescence images of a l o/l d coexisting GUV together with the line profile is shown in Figure 2. The fluorophore Dy731‐DOPE indicates the l d phase (Figure 2 A).23 From the BODIPY fluorescence intensity (Figure 2 B), the preferential localization of 1 is visible. To quantify the partition of 1, the BODIPY intensity of the l d phase (I(l d)) and of the l o phase (I(l o)) as obtained from the corresponding line profile was determined and the l o distribution (%l o) was calculated [Eq. (1)]:23
| (1) |
Figure 2.
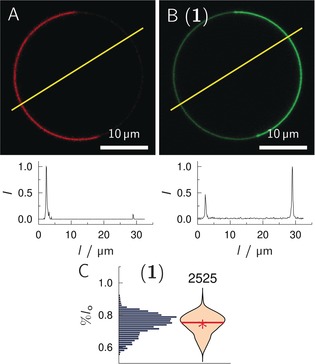
Confocal images of a phase‐separated GUV composed of DOPC/SM‐porc/Chol/1/Dy731‐DOPE (39/39/20/1/1). A) Dy731‐DOPE fluorescence (red). B) 1 fluorescence (green). The yellow lines indicate where the fluorescence intensity profiles (bottom images) were obtained. From the intensity profiles %l o=68.2 % was calculated for 1. C) Histogram and corresponding violin plot obtained from 60 GUVs (number of line profiles atop) with the composition as in (A/B). The red solid line indicates the median value, the red star the mean value.
Several tens of line profiles were taken from each GUV. All %l o values were cast into a histogram (Figure 2 C). Data obtained in this manner are presented as violin plots throughout the manuscript.
There is increasing evidence that the size of the linker attached to the head group of a lipid alters the phase behavior of the fluorescently labeled lipid.36, 37 To investigate whether the linker length, that is, the number of ethylene glycol units, influences the partition of the Gb3 sphingolipids in phase‐separated GUVs, we synthesized Gb3 molecules differing in their fatty acid with either 13 ethylene glycol units (PEG13) or 3 (PEG3). Independent of the fatty acid, the same trend is observed (Figure 3). All Gb3 sphingolipids with PEG13 partition more in the l o phase than the corresponding Gb3 species with PEG3.
Figure 3.
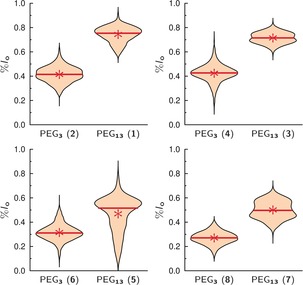
l o distribution of different Gb3 species in GUVs composed of DOPC/SM‐porc/Chol/Gb3/Dy731 (39/39/20/1/1). The partition of Gb3 sphingolipids with the short PEG linker (PEG3) was compared with those carrying the long PEG linker (PEG13). The mean values are given as a red star, while the red solid lines show the median value (Table 1).
The mean values are summarized in Table 1. The difference between the l o distribution of PEG13Gb3 species and PEG3Gb3 species lies between 0.15 and 0.33 (Table 2, ΔPEG). Such altered partitioning of a lipid as a function of linker length, to which a fluorophore has been attached, was also observed by Honigmann et al.36 They reported on a fluorophore that was either directly connected to the lipid 1,2‐distearoyl‐sn‐glycero‐3‐phosphoethanolamine (DSPE) or connected by a PEG‐linker with 45 ethylene glycol units, and was reconstituted into supported lipid membranes composed of 1,2‐diphytanoyl‐sn‐glycero‐3‐phosphocholine (DPhPC)/1,2‐dipalmitoyl‐sn‐glycero‐3‐phosphocholine (DPPC)/Chol. A fluorescence analysis of the partition clearly showed that the fluorescent lipid lacking the PEG‐linker was preferentially localized in the l d phase, while that with the PEG‐linker partitioned into the l o phase. Similarly, Momin et al.38 and Bordovsky et al.37 found that an increase in length of the hydrophilic PEG linker at the head group of lipids that are expected to be localized in the l o phase of coexisting l o/l d membranes is required to favor their partitioning in the l o phase. This observation is explained by the notion that the fluorophore itself is partially hydrophobic and might be also bulky. It changes the packing parameter of the lipid. If the fluorophore is directly connected to the lipid or attached by a short linker, the size of the lipid's head group is expanded and the lipid is more conically shaped, favoring the l d phase.39 For the slightly hydrophobic but small BODIPY fluorophore used in our study, a hydrophilic PEG spacer of suitable length is required to mitigate interactions with the membrane. Momin et al.38 found a linker with 10 ethylene glycol units to be sufficient to decouple the fluorophore from the membrane.39 In our study, a 13‐unit long linker decoupled the fluorophore from the membrane interface with the result that 1, which is expected to at least preferentially partition into the l o phase, indeed has a l o distribution of almost 0.75. From these results, we conclude that the Gb3 species with PEG13 are better suited to report on the natural partition of Gb3 than those with PEG3. Thus, the experiments in which we compare the influence of unsaturation and hydroxylation of the fatty acid of Gb3 are all performed with the PEG13 species. The corresponding results with the PEG3 linker can be found in the Supporting Information (see Figures S2 and S3).
Table 1.
Mean values of the l o distributions (%l o) for the different Gb3 sphingolipids in GUVs composed of DOPC/SM‐porc/Chol/Gb3/Dy731 (39/39/20/1/1).
|
No. |
Gb3 |
%l o (N) |
|---|---|---|
|
1 |
Gb3PEG13C24:0H |
0.74±0.07 (2525) |
|
2 |
Gb3PEG3C24:0H |
0.41±0.07 (2516) |
|
3 |
Gb3PEG13C24:0OH |
0.71±0.05 (3064) |
|
4 |
Gb3PEG3C24:0OH |
0.42±0.08 (2273) |
|
5 |
Gb3PEG13C24:1H |
0.47±0.15 (1654) |
|
6 |
Gb3PEG3C24:1H |
0.32±0.07 (2351) |
|
7 |
Gb3PEG13C24:1OH |
0.50±0.08 (2377) |
|
8 |
Gb3PEG3C24:1OH |
0.27±0.06 (2701) |
The errors are the standard deviation of the mean. N=number of line profiles.
Table 2.
Differences in the mean values dependent on the functional group.
|
ΔPEG |
ΔC24 |
ΔOH |
|||
|---|---|---|---|---|---|
|
1‐2: |
0.33±0.14 |
1‐5: |
0.27±0.22 |
1‐3: |
0.03±0.12 |
|
3‐4: |
0.29±0.13 |
3‐7: |
0.21±0.13 |
5‐7: |
0.03±0.23 |
|
5‐6: |
0.15±0.22 |
2‐6: |
0.09±0.14 |
2‐4: |
−0.01±0.15 |
|
7‐8: |
0.23±0.14 |
4‐8: |
0.15±0.14 |
6‐8: |
0.05±0.13 |
ΔPEG=%l o (PEG13)—%l o (PEG3); ΔC24=%l o (C24:0)—%l o (C24:1); ΔOH=%l o (H)—%l o (OH).
We investigated the influence of the fatty acid saturation on the partition behavior of Gb3 (Figure 4). The results show that introducing a fatty acid with a cis‐double bond redistributes the Gb3 sphingolipid in the l d phase, and can be rationalized by the increased space requirement of the Gb3 species with the C24:1 fatty acid. The differences between the l o distribution of 1/5 and 3/7 harboring the PEG13 linker are significant and range between 0.21 and 0.27 (Table 2, ΔC24).
Figure 4.
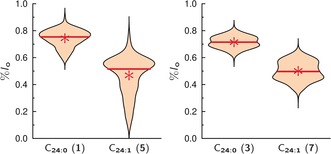
l o distribution of different Gb3 species with a PEG13 linker in GUVs composed of DOPC/SM‐porc/Chol/Gb3/Dy731 (39/39/20/1/1). The partition of the Gb3 species harboring a saturated fatty acid (C24:0) were compared with that with an attached unsaturated fatty acid (C24:1). The mean values are given as a red star, while the red lines show the median value (Table 1).
Björkqvist et al.40 investigated different glycosphingolipids as well as sphingomyelins and found by differential scanning calorimetry (DSC) that the phase‐transition temperature was decreased by about 20 K for all sphingolipids harboring the C24:1 fatty acid compared to the corresponding C24:0 sphingolipids, demonstrating their different packing behavior. The ability to pack tightly with ordered acyl chains in case of a saturated fatty acid41 is a requirement for membrane lipids to partition into l o domains and they concluded that the C24:1 sphingolipids are less likely to partition into the l o phase. Fluorescence quenching experiments revealed that sphingolipids with a C24:0 fatty acid form l o domains in multicomponent membranes composed of either the sphingolipid or mixed with palmitoyl sphingomyelin.40 This behavior was also found by Mate et al.,42 who reported that sphingomyelin with the C24:0 fatty acid reconstituted into a DOPC/Chol membrane leads to visible phase separation into an l o and l d phase, while the sphingomyelin with the C24:1 fatty results only in one lipid phase.
These results support our notion that the packing of the unsaturated Gb3 species disfavors its partition in the l o phase. Similar to our in vitro results, Legros et al.43 found in primary human blood brain barrier endothelial cells that Gb3 with C24:1 fatty acids resides more strongly in non‐detergent‐resistant membranes compared to Gb3 with C24:0 fatty acids.
In nature, about 50 % of the Gb3 sphingolipids are decorated with an OH group in the α‐position of the fatty acid, raising the question, whether this OH group alters the Gb3 partition. The results (Figure 5) clearly indicate that the OH group in the α‐position does not influence its distribution. The differences of %l o for 1/3 and 5/7 are in the range of −0.03–0.03 and are not significant (Table 2, ΔOH).
Figure 5.
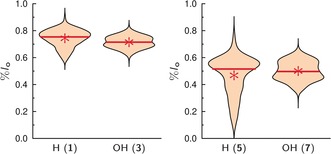
l o distribution of different Gb3 species with a PEG13 linker in GUVs composed of DOPC/SM‐porc/Chol/Gb3/Dy731 (39/39/20/1/1). The partition of the Gb3 sphingolipids, which are nonhydroxylated in the α‐position (H) is compared with that carrying an α‐hydroxylation (OH). The mean values are given as red stars, while the red solid lines are the median values (Table 1).
Monolayer experiments on galactosyl ceramide (GalCer), harboring either an α‐hydroxylated or nonhydroxylated C24:0 fatty acid on a Langmuir trough, suggest that the α‐hydroxylation does not change the area per lipid at 30 mN m−1,44 a surface pressure that reflects the packing density of bilayers.45 Using 2H NMR spectroscopy, Morrow and co‐workers41, 46 also demonstrated that the order parameter of the fatty acids of GalCer embedded in a POPC/Chol membrane and the orientation of the head group does not change considerably.
This report is in line with our observation that the OH group does not significantly alter the partitioning of the Gb3 species in phase‐separated GUVs. However, in a previous study, we found that the 2‐OH group influences the fraction of l o phase in phase‐separated supported lipid bilayers.21 In the case of the hydroxylated C24:0 fatty acid, the l o fraction was smaller than that of the nonhydroxylated species. Slotte and co‐workers47 showed that the 2‐OH group increases the hydration in the membrane interface and decreases the affinity of a sphingolipid for sterols. The same was found by Lingwood et al.48 and Yahi et al.49 and implies that the recruitment of Chol into the l o phase by hydroxylated Gb3 is reduced compared to the nonhydroxylated species, leading to a smaller l o fraction, while the amount of Gb3 in the l o fraction is the same.
Our results clearly demonstrate that the fatty acid of Gb3 influences its partitioning into the l o phase. One reason might be found in the interaction of the Gb3 fatty acid with the fatty acid of SM, which we next analyzed. To investigate this aspect in more detail, we replaced the SM mixture isolated from pigs with synthetic pure SM. Exchanging a sphingomyelin mixture with sphingomyelins with a defined fatty acid is known to alter the phase separation behavior of ternary mixtures.50 Five different SM species with a saturated fatty acid of varying length were chosen, namely palmitoyl SM (C16:0), stearoyl SM (C18:0), arachidoyl SM (C20:0), behenoyl SM (C22:0), and lignoceroyl SM (C24:0), and the l o distribution of each Gb3 species in these membranes was determined (Figure 6, Table 3).
Figure 6.
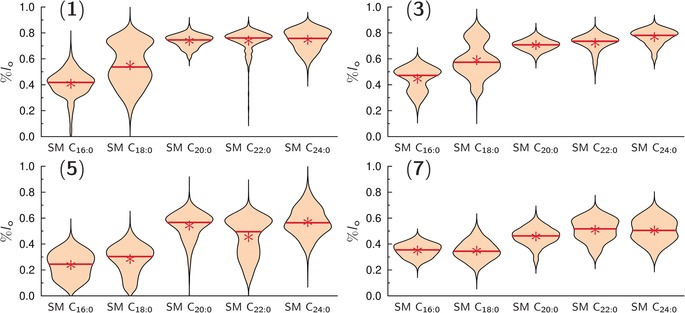
l o distribution of different Gb3 species with a PEG13 linker composed of DOPC/SM/Chol/Gb3/Dy731 (39/39/20/1/1). The partition of four different Gb3 sphingolipids in l o/l d phase‐separated GUVs with different sphingomyelin species are shown: SM C16:0 (palmitoyl SM), SM C18:0 (stearoyl SM), SM C20:0 (arachidoyl SM), SM C22:0 (behenoyl SM) and SM C24:0 (lignoceroyl SM). The mean values are given as red stars and the solid red lines represent the median value(Table 3).
Table 3.
Mean values of the l o distributions (%l o) for the different Gb3 sphingolipids with the PEG13 linker in GUVs composed of DOPC/SM/Chol/Gb3/Dy731 (39/39/20/1/1) varying in the SM species.
|
Gb3 |
%l o(SM C16:0) (N) |
%l o(SM C18:0) (N) |
%l o(SM C20:0) (N) |
%l o(SM C22:0) (N) |
%l o(SM C24:0) (N) |
|---|---|---|---|---|---|
|
1 |
0.41±0.11 (2392) |
0.55±0.17 (2986) |
0.74±0.05 (2397) |
0.74±0.09 (2077) |
0.75±0.09 (1707) |
|
3 |
0.45±0.10 (3232) |
0.59±0.14 (3396) |
0.71±0.05 (2414) |
0.72±0.07 (2893) |
0.77±0.07 (2509) |
|
5 |
0.24±0.10 (2035) |
0.28±0.11 (1845) |
0.54±0.11 (2482) |
0.45±0.15 (2759) |
0.57±0.12 (1730) |
|
7 |
0.35±0.06 (1814) |
0.34±0.08 (2465) |
0.46±0.08 (2648) |
0.51±0.09 (2266) |
0.50±0.10 (2491) |
SM C16:0 (palmitoyl SM), SM C18:0 (stearoyl SM), SM C20:0 (arachidoyl SM), SM C22:0 (behenoyl SM), and SM C24:0 (lignoceroyl SM). The errors are the standard deviation of the mean. N=number of line profiles.
The fatty‐acid chain length also determines the length difference between the two hydrophobic chains, which increases with an increase in fatty‐acid chain length. This mismatch results in interdigitation of both leaflets,51 which was—for fatty acids with a length of more than 20 carbon atoms—not only observed in the gel phase but also in the liquid‐crystalline phase.52, 53 Interdigitation was also reported for glycosphingolipids carrying a C24 fatty acid.53, 54 Hence, it is likely that the Gb3 species under investigation preferentially partition into the l o phase if SM interdigitates. Interdigitation of SM in the liquid‐crystalline phase occurs for C20 fatty acids and longer, in agreement with our observation that the partition in the l o phase is increased for SM species with C20 fatty acids or longer.
However, the l o phase consists not only of SM but also of Chol owing to its better solubility in SM membranes than in PC membranes.55, 56, 57 Chol is best soluble in SM C16:0.56, 57 If the solubility of Chol in the l o phase greatly influenced the Gb3 distribution in the l o phase, the opposite trend would have been observed. This trend was not found and agrees with the idea that the interaction of Gb3 with Chol is less important than the one with SM.
Conclusion
GM1 and Gb3 detection by fluorescently labeled Cholera toxin B subunits (CTxB) and Shiga toxin B subunits (STxB), respectively is a well‐established tool for monitoring l o membrane domains58 and implies that these glycosphingolipids are localized in the l o phase. However, as each CTxB and STxB pentamer can recruit a maximum of 5 (CTx) or 15 (STx) receptor lipids, the glycosphingolipid partitioning in coexisting l o/l d membranes after protein binding does not necessarily reflect the situation prior protein binding. Hence, to be able to quantify the partitioning of Gb3 in phase coexisting l o/l d membranes by means of fluorescence readout, chemical access to fluorescently labeled pure Gb3 molecules is required. The approach of synthesizing head group labeled glycosphingolipids enables one to address the question how the fatty acid of a glycosphingolipid influences its distribution in l o/l d phase‐separated membranes, a question that has been hardly addressed because most of the glycosphingolipids are not available in chemically pure form. Our results clearly demonstrate that the fatty acid (un)saturation significantly shifts the Gb3 molecules from the l o phase (C24:0) to the l d phase (C24:1). As STxB exclusively binds to Gb3 in the l o phase, the amount of redistributed Gb3 and probably also other l o phase lipids thus depends on the fatty acid of Gb3. However, the α‐hydroxylation does not alter the partition of Gb3, even though it has been shown that the OH group of Chol can form a hydrogen bond only to the nonhydroxylated fatty acid. Instead, the length match of the fatty acids of SM and Gb3 appear to play a more decisive role in determining where the Gb3 glycosphingolipids are preferentially localized. As the combination of the attached fatty acids of SM and Gb3 considerably impacts the distribution of the Gb3 glycosphingolipids, it is conceivable that the overall recruitment of lipids and thus the Shiga toxin induced membrane reorganization that eventually leads to the invagination of the protein into the host cell, is strongly influenced by the fatty acid composition of Gb3.
Conflict of interest
The authors declare no conflict of interest.
Supporting information
As a service to our authors and readers, this journal provides supporting information supplied by the authors. Such materials are peer reviewed and may be re‐organized for online delivery, but are not copy‐edited or typeset. Technical support issues arising from supporting information (other than missing files) should be addressed to the authors.
Supplementary
Acknowledgements
The authors are grateful to the DFG (SFB 803, project A05) for financial support. We acknowledge Jutta Gerber‐Nolte for technical support.
J. Sibold, K. Kettelhoit, L. Vuong, F. Liu, D. B. Werz, C. Steinem, Angew. Chem. Int. Ed. 2019, 58, 17805.
Contributor Information
Dr. Katharina Kettelhoit, http://www.werzlab.de.
Prof. Dr. Daniel B. Werz, Email: d.werz@tu-braunschweig.de.
Prof. Dr. Claudia Steinem, Email: claudia.steinem@chemie.uni-goettingen.de.
References
- 1.
- 1a. van Meer G., de Kroon A. I. P. M., J. Cell Sci. 2011, 124, 5; [DOI] [PubMed] [Google Scholar]
- 1b. Binder W. H., Barragan V., Menger F. M., Angew. Chem. Int. Ed. 2003, 42, 5802; [DOI] [PubMed] [Google Scholar]; Angew. Chem. 2003, 115, 5980. [Google Scholar]
- 2.
- 2a. Simons K., Ikonen E., Nature 1997, 387, 569; [DOI] [PubMed] [Google Scholar]
- 2b. Cebecauer M., Amaro M., Jurkiewicz P., Sarmento M. J., Šachl R., Cwiklik L., Hof M., Chem. Rev. 2018, 118, 11259; [DOI] [PubMed] [Google Scholar]
- 2c. Wang C., Yu Y., Regen S. L., Angew. Chem. Int. Ed. 2017, 56, 1639; [DOI] [PubMed] [Google Scholar]; Angew. Chem. 2017, 129, 1661. [Google Scholar]
- 3. Pike L. J., J. Lipid Res. 2006, 47, 1597. [DOI] [PubMed] [Google Scholar]
- 4. Goñi F. M., Chem. Phys. Lipids 2019, 218, 34. [DOI] [PubMed] [Google Scholar]
- 5.
- 5a. Erazo-Oliveras A., Fuentes N. R., Wright R. C., Chapkin R. S., Cancer Metastasis Rev. 2018, 37, 519; [DOI] [PMC free article] [PubMed] [Google Scholar]
- 5b. Cheng X., Smith J. C., Chem. Rev. 2019, 119, 5849. [DOI] [PubMed] [Google Scholar]
- 6. Lingwood D., Simons K., Science 2010, 327, 46. [DOI] [PubMed] [Google Scholar]
- 7. Lichtenberg D., Goñi F. M., Heerklotz H., Trends Biochem. Sci. 2005, 30, 430. [DOI] [PubMed] [Google Scholar]
- 8. Goñi F. M., Alonso A., Bagatolli L. A., Brown R. E., Marsh D., Prieto M., Thewalt J. L., Biochim. Biophys. Acta Mol. Cell Biol. Lipids 2008, 1781, 665. [DOI] [PMC free article] [PubMed] [Google Scholar]
- 9. Aufderhorst-Roberts A., Chandra U., Connell S. D., Biophys. J. 2017, 112, 313. [DOI] [PMC free article] [PubMed] [Google Scholar]
- 10. London E., Acc. Chem. Res. 2019, 52, 2382. [DOI] [PMC free article] [PubMed] [Google Scholar]
- 11. Koukalová A., Amaro M., Aydogan G., Gröbner G., Williamson P. T. F., Mikhalyov I., Hof M., Šachl R., Sci. Rep. 2017, 7, 5460. [DOI] [PMC free article] [PubMed] [Google Scholar]
- 12.
- 12a. Kahya N., Brown D. A., Schwille P., Biochemistry 2005, 44, 7479; [DOI] [PubMed] [Google Scholar]
- 12b. Morigaki K., Tanimoto Y., Biochim. Biophys. Acta Biomembr. 2018, 1860, 2012. [DOI] [PubMed] [Google Scholar]
- 13.
- 13a. Bacia K., Scherfeld D., Kahya N., Schwille P., Biophys. J. 2004, 87, 1034; [DOI] [PMC free article] [PubMed] [Google Scholar]
- 13b. Safouane M., Berland L., Callan-Jones A., Sorre B., Römer W., Johannes L., Toombes G. E. S., Bassereau P., Traffic 2010, 11, 1519. [DOI] [PubMed] [Google Scholar]
- 14. Pina D. G., Johannes L., Toxicon 2005, 45, 389. [DOI] [PubMed] [Google Scholar]
- 15.
- 15a. Merritt E. A., Sarfaty S., van den Akker F., L'Hoir C., Martial J. A., Hol W. G., Protein Sci. 1994, 3, 166; [DOI] [PMC free article] [PubMed] [Google Scholar]
- 15b. Branson T. R., McAllister T. E., Garcia-Hartjes J., Fascione M. A., Ross J. F., Warriner S. L., Wennekes T., Zuilhof H., Turnbull W. B., Angew. Chem. Int. Ed. 2014, 53, 8323; [DOI] [PMC free article] [PubMed] [Google Scholar]; Angew. Chem. 2014, 126, 8463. [Google Scholar]
- 16.
- 16a. Shi J., Yang T., Kataoka S., Zhang Y., Diaz A. J., Cremer P. S., J. Am. Chem. Soc. 2007, 129, 5954; [DOI] [PMC free article] [PubMed] [Google Scholar]
- 16b. Dasgupta S., Kitov P. I., Sadowska J. M., Bundle D. R., Angew. Chem. Int. Ed. 2014, 53, 1510; [DOI] [PubMed] [Google Scholar]; Angew. Chem. 2014, 126, 1536; [Google Scholar]
- 16c. Bosse M., Sibold J., Scheidt H. A., Patalag L. J., Kettelhoit K., Ries A., Werz D. B., Steinem C., Huster D., Phys. Chem. Chem. Phys. 2019, 21, 15630. [DOI] [PubMed] [Google Scholar]
- 17. Ling H., Boodhoo A., Hazes B., Cummings M. D., Armstrong G. D., Brunton J. L., Read R. J., Biochemistry 1998, 37, 1777. [DOI] [PubMed] [Google Scholar]
- 18. Kouzel I. U., Pohlentz G., Schmitz J. S., Steil D., Humpf H.-U., Karch H., Müthing J., Toxins 2017, 9, 338. [DOI] [PMC free article] [PubMed] [Google Scholar]
- 19.
- 19a. Lingwood C. A., Binnington B., Manis A., Branch D. R., FEBS Lett. 2010, 584, 1879; [DOI] [PubMed] [Google Scholar]
- 19b. Khan F., Proulx F., Lingwood C. A., Kidney Int. 2009, 75, 1209. [DOI] [PubMed] [Google Scholar]
- 20.
- 20a. Windschiegl B., Orth A., Römer W., Berland L., Stechmann B., Bassereau P., Johannes L., Steinem C., PLoS ONE 2009, 4, e6238; [DOI] [PMC free article] [PubMed] [Google Scholar]
- 20b. Watkins E. B., Gao H., Dennison A. J. C., Chopin N., Struth B., Arnold T., Florent J.-C., Johannes L., Biophys. J. 2014, 107, 1146; [DOI] [PMC free article] [PubMed] [Google Scholar]
- 20c. Schütte O. M., Patalag L. J., Weber L. M. C., Ries A., Römer W., Werz D. B., Steinem C., Biophys. J. 2015, 108, 2775; [DOI] [PMC free article] [PubMed] [Google Scholar]
- 20d. Pezeshkian W., Chaban V. V., Johannes L., Shillcock J., Ipsen J. H., Khandelia H., Soft Matter 2015, 11, 1352; [DOI] [PubMed] [Google Scholar]
- 20e. Solovyeva V., Johannes L., Simonsen A. C., Soft Matter 2015, 11, 186. [DOI] [PubMed] [Google Scholar]
- 21. Schütte O. M., Ries A., Orth A., Patalag L. J., Römer W., Steinem C., Werz D. B., Chem. Sci. 2014, 5, 3104. [Google Scholar]
- 22. Römer W., Berland L., Chambon V., Gaus K., Windschiegl B., Tenza D., Aly M. R. E., Fraisier V., Florent J.-C., Perrais D. et al., Nature 2007, 450, 670. [DOI] [PubMed] [Google Scholar]
- 23. Patalag L. J., Sibold J., Schütte O. M., Steinem C., Werz D. B., ChemBioChem 2017, 18, 2171. [DOI] [PubMed] [Google Scholar]
- 24.
- 24a. Marushchak D., Gretskaya N., Mikhalyov I., Johansson L. B.-A., Mol. Membr. Biol. 2007, 24, 102; [DOI] [PubMed] [Google Scholar]
- 24b. Polyakova S. M., Belov V. N., Yan S. F., Eggeling C., Ringemann C., Schwarzmann G., de Meijere A., Hell S. W., Eur. J. Org. Chem. 2009, 5162; [Google Scholar]
- 24c. Suzuki K. G. N., Ando H., Komura N., Konishi M., Imamura A., Ishida H., Kiso M., Fujiwara T. K., Kusumi A., Methods Enzymol. 2018, 598, 267. [DOI] [PubMed] [Google Scholar]
- 25.
- 25a. Komura N., Suzuki K. G. N., Ando H., Konishi M., Koikeda M., Imamura A., Chadda R., Fujiwara T. K., Tsuboi H., Sheng R. et al., Nat. Chem. Biol. 2016, 12, 402; [DOI] [PubMed] [Google Scholar]
- 25b. Suzuki K. G. N., Ando H., Komura N., Fujiwara T. K., Kiso M., Kusumi A., Biochim. Biophys. Acta. Gen. Subj. 2017, 1861, 2494. [DOI] [PubMed] [Google Scholar]
- 26.
- 26a. Kitov P. I., Shimizu H., Homans S. W., Bundle D. R., J. Am. Chem. Soc. 2003, 125, 3284; [DOI] [PubMed] [Google Scholar]
- 26b. Kitov P. I., Bundle D. R., J. Chem. Soc. Perkin Trans. 1 2001, 838. [Google Scholar]
- 27. Römer W., Pontani L.-L., Sorre B., Rentero C., Berland L., Chambon V., Lamaze C., Bassereau P., Sykes C., Gaus K. et al., Cell 2010, 140, 540. [DOI] [PubMed] [Google Scholar]
- 28. Smith D. C., Sillence D. J., Falguières T., Jarvis R. M., Johannes L., Lord J. M., Platt F. M., Roberts L. M., Mol. Biol. Cell 2006, 17, 1375. [DOI] [PMC free article] [PubMed] [Google Scholar]
- 29. Raa H., Grimmer S., Schwudke D., Bergan J., Wälchli S., Skotland T., Shevchenko A., Sandvig K., Traffic 2009, 10, 868. [DOI] [PubMed] [Google Scholar]
- 30.
- 30a. Mahfoud R., Manis A., Binnington B., Ackerley C., Lingwood C. A., J. Biol. Chem. 2010, 285, 36049; [DOI] [PMC free article] [PubMed] [Google Scholar]
- 30b. Mahfoud R., Manis A., Lingwood C. A., J. Lipid Res. 2009, 50, 1744. [DOI] [PMC free article] [PubMed] [Google Scholar]
- 31.
- 31a. Isobe H., Cho K., Solin N., Werz D. B., Seeberger P. H., Nakamura E., Org. Lett. 2007, 9, 4611; [DOI] [PubMed] [Google Scholar]
- 31b. Jansson K., Ahlfors S., Frejd T., Kihlberg J., Magnusson G., Dahmen J., Noori G., Stenvall K., J. Org. Chem. 1988, 53, 5629; [Google Scholar]
- 31c. Kozikowski A. P., Lee J., J. Org. Chem. 1990, 55, 863; [Google Scholar]
- 31d. Lin Y. A., Chalker J. M., Davis B. G., J. Am. Chem. Soc. 2010, 132, 16805; [DOI] [PubMed] [Google Scholar]
- 31e. Vogel C., Murphy P. V., Murphy P., Carbohydrate Chemistry, CRC, Boca Raton, 2017; [Google Scholar]
- 31f. Bucher C., Gilmour R., Angew. Chem. Int. Ed. 2010, 49, 8724; [DOI] [PubMed] [Google Scholar]; Angew. Chem. 2010, 122, 8906; [Google Scholar]
- 31g. Adinolfi M., Iadonisi A., Ravidà A., Schiattarella M., J. Org. Chem. 2005, 70, 5316. [DOI] [PubMed] [Google Scholar]
- 32. Jung M. E., Koch P., Tetrahedron Lett. 2011, 52, 6051. [Google Scholar]
- 33. Zimmermann P., Schmidt R. R., Liebigs Ann. Chem. 1988, 663. [Google Scholar]
- 34. Pawliczek M., Wallbaum J., Werz D., Synlett 2014, 25, 1435. [Google Scholar]
- 35.
- 35a. Veatch S. L., Keller S. L., Biophys. J. 2003, 85, 3074; [DOI] [PMC free article] [PubMed] [Google Scholar]
- 35b. Veatch S. L., Keller S. L., Biophys. J. 2003, 84, 725; [DOI] [PMC free article] [PubMed] [Google Scholar]
- 35c. Veatch S. L., Gawrisch K., Keller S. L., Biophys. J. 2006, 90, 4428; [DOI] [PMC free article] [PubMed] [Google Scholar]
- 35d. Konyakhina T. M., Feigenson G. W., Biochim. Biophys. Acta Biomembr. 2016, 1858, 153; [DOI] [PMC free article] [PubMed] [Google Scholar]
- 35e. Baykal-Caglar E., Hassan-Zadeh E., Saremi B., Huang J., Biochim. Biophys. Acta Biomembr. 2012, 1818, 2598. [DOI] [PubMed] [Google Scholar]
- 36. Honigmann A., Mueller V., Hell S. W., Eggeling C., Faraday Discuss. 2013, 161, 77. [DOI] [PubMed] [Google Scholar]
- 37. Bordovsky S. S., Wong C. S., Bachand G. D., Stachowiak J. C., Sasaki D. Y., Langmuir 2016, 32, 12527. [DOI] [PubMed] [Google Scholar]
- 38. Momin N., Lee S., Gadok A. K., Busch D. J., Bachand G. D., Hayden C. C., Stachowiak J. C., Sasaki D. Y., Soft Matter 2015, 11, 3241. [DOI] [PubMed] [Google Scholar]
- 39. Klymchenko A. S., Kreder R., Chem. Biol. 2014, 21, 97. [DOI] [PubMed] [Google Scholar]
- 40. Björkqvist Y. J. E., Brewer J., Bagatolli L. A., Slotte J. P., Westerlund B., Biochim. Biophys. Acta Biomembr. 2009, 1788, 1310. [DOI] [PubMed] [Google Scholar]
- 41. Morrow M. R., Singh D., Grant C. W. M., Biochim. Biophys. Acta Biomembr. 1995, 1235, 239. [DOI] [PubMed] [Google Scholar]
- 42. Maté S., Busto J. V., García-Arribas A. B., Sot J., Vazquez R., Herlax V., Wolf C., Bakás L., Goñi F. M., Biophys. J. 2014, 106, 2606. [DOI] [PMC free article] [PubMed] [Google Scholar]
- 43. Legros N., Dusny S., Humpf H.-U., Pohlentz G., Karch H., Müthing J., Glycobiology 2017, 27, 99. [DOI] [PubMed] [Google Scholar]
- 44. Stefaniu C., Ries A., Gutowski O., Ruett U., Seeberger P. H., Werz D. B., Brezesinski G., Langmuir 2016, 32, 2436. [DOI] [PubMed] [Google Scholar]
- 45. Blume A., Biochim. Biophys. Acta Biomembr. 1979, 557, 32. [DOI] [PubMed] [Google Scholar]
- 46. Morrow M. R., Singh D. M., Grant C. W., Biophys. J. 1995, 69, 955. [DOI] [PMC free article] [PubMed] [Google Scholar]
- 47. Ekholm O., Jaikishan S., Lönnfors M., Nyholm T. K. M., Slotte J. P., Biochim. Biophys. Acta Biomembr. 2011, 1808, 727. [DOI] [PubMed] [Google Scholar]
- 48. Lingwood D., Binnington B., Róg T., Vattulainen I., Grzybek M., Coskun U., Lingwood C. A., Simons K., Nat. Chem. Biol. 2011, 7, 260. [DOI] [PubMed] [Google Scholar]
- 49. Yahi N., Aulas A., Fantini J., PLoS ONE 2010, 5, e9079. [DOI] [PMC free article] [PubMed] [Google Scholar]
- 50. Balleza D., Mescola A., Marín-Medina N., Ragazzini G., Pieruccini M., Facci P., Alessandrini A., Biophys. J. 2019, 116, 503. [DOI] [PMC free article] [PubMed] [Google Scholar]
- 51. Kodama M., Kawasaki Y., Ohtaka H., Thermochim. Acta 2012, 532, 22. [Google Scholar]
- 52.
- 52a. Maulik P. R., Atkinson D., Shipley G. G., Biophys. J. 1986, 50, 1071; [DOI] [PMC free article] [PubMed] [Google Scholar]
- 52b. Takahashi H., Hayakawa T., Kawasaki Y., Ito K., Fujisawa T., Kodama M., Kobayashi T., J. Appl. Crystallogr. 2007, 40, s312–s317. [Google Scholar]
- 53. Niemelä P. S., Hyvönen M. T., Vattulainen I., Biophys. J. 2006, 90, 851. [DOI] [PMC free article] [PubMed] [Google Scholar]
- 54. Róg T., Orłowski A., Llorente A., Skotland T., Sylvänne T., Kauhanen D., Ekroos K., Sandvig K., Vattulainen I., Biochim. Biophys. Acta Biomembr. 2016, 1858, 281. [DOI] [PubMed] [Google Scholar]
- 55. Ramstedt B., Slotte J. P., Biophys. J. 1999, 76, 908. [DOI] [PMC free article] [PubMed] [Google Scholar]
- 56. Jaikishan S., Slotte J. P., Biochim. Biophys. Acta Biomembr. 2011, 1808, 1940. [DOI] [PubMed] [Google Scholar]
- 57. Jaikishan S., Björkbom A., Slotte J. P., Biochim. Biophys. Acta Biomembr. 2010, 1798, 1987. [DOI] [PubMed] [Google Scholar]
- 58. Rissanen S., Grzybek M., Orłowski A., Róg T., Cramariuc O., Levental I., Eggeling C., Sezgin E., Vattulainen I., Front. Physiol. 2017, 8, 252. [DOI] [PMC free article] [PubMed] [Google Scholar]
Associated Data
This section collects any data citations, data availability statements, or supplementary materials included in this article.
Supplementary Materials
As a service to our authors and readers, this journal provides supporting information supplied by the authors. Such materials are peer reviewed and may be re‐organized for online delivery, but are not copy‐edited or typeset. Technical support issues arising from supporting information (other than missing files) should be addressed to the authors.
Supplementary


