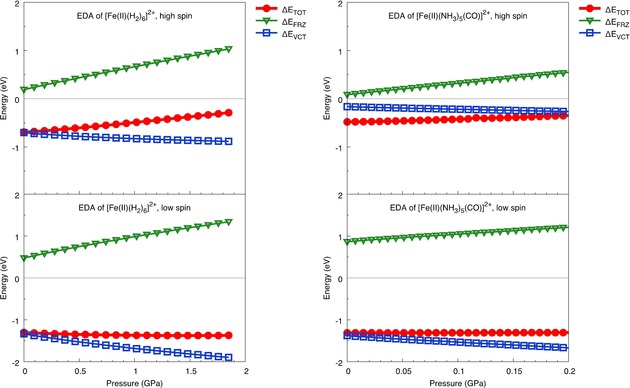
Figure 4.

Energy Decomposition Analysis of contributions to total energy in high spin (top) and low spin (bottom) [Fe(II)(H2)6]2+ (left) and [Fe(II)(NH3)5CO]2+ (right). ▵ETOT (red circles) refers to the total SCF energy, ▵EFRZ (green triangles) to changes in Pauli repulsion and ▵EVCT (blue squares) to charge transfer as a function of hydrostatic pressure.
