Abstract
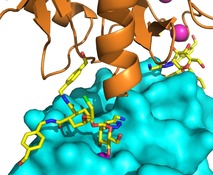
Chemical modification of pseudo‐dimannoside ligands guided by fragment‐based design allowed for the exploitation of an ammonium‐binding region in the vicinity of the mannose‐binding site of DC‐SIGN, leading to the synthesis of a glycomimetic antagonist (compound 16) of unprecedented affinity and selectivity against the related lectin langerin. Here, the computational design of pseudo‐dimannoside derivatives as DC‐SIGN ligands, their synthesis, their evaluation as DC‐SIGN selective antagonists, the biophysical characterization of the DC‐SIGN/16 complex, and the structural basis for the ligand activity are presented. On the way to the characterization of this ligand, an unusual bridging interaction within the crystals shed light on the plasticity and potential secondary binding sites within the DC‐SIGN carbohydrate recognition domain.
Keywords: carbohydrates, DC-SIGN, glycomimetics, ligand design, virtual screening
Fragment‐based design: A high affinity monovalent DC‐SIGN ligand was obtained by targeting an ammonium‐binding pocket identified by virtual screening. The structural basis of its activity was elucidated by X‐ray crystallography, also unveiling an unusual bridging interaction within the crystals.
Introduction
DC‐SIGN is a transmembrane C‐type lectin expressed at the surface of dendritic cells. It plays a key role in the recognition of several pathogens and in the development of various infections, including Dengue and the HIV virus.1 Over the past decade, several glycomimetic ligands have been designed to act as antagonists of DC‐SIGN mediated viral infections by using as template the pseudo‐dimannoside (ps‐diMan) scaffold 1 (Figure 1 A), composed of a mannose ring connected to a conformationally locked cyclohexane diol. Chemical modifications of both the cyclohexane appendages and the 6‐position of mannose, as in 2 and 3, led to improvements in the affinity of the ligands towards DC‐SIGN—which remains modest (from a 0.9 mm IC50 of 1 in SPR inhibition experiments to 0.3–0.2 mm for 2 and 3) but can be magnified by their polyvalent presentation.2 Most importantly, these structural modifications also led to improved selectivity against the related C‐type lectin langerin, which could be explained by comparative structural analysis of the two proteins.3
Figure 1.
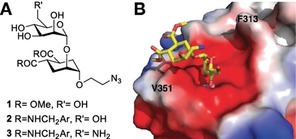
A) The structure of known DC‐SIGN antagonists with a pseudo‐dimannoside core. B) X‐ray structure of DC‐SIGN/ 1 complex PDB 2XR5: the 2‐hydroxyl group of the mannose ring (Man‐O2) points towards the Phe313 side‐chain.
In this work, we describe our efforts to improve the affinity of the pseudo‐dimannoside ligands by computational design, using a fragment‐based screening in the X‐ray structure of DC‐SIGN carbohydrate recognition domain (CRD) in complex with 1 (PDB 2XR5; PDB=Protein Data Bank). This screening identified several moieties, predicted to bind to sites adjacent to the bound pseudo‐dimannoside, and potentially amenable to modify its structures. Among them, we focused on fragments that favorably interact in the proximity of Phe313. This region, which is involved in binding several natural oligomannosides,4 is near the 2‐hydroxyl group of the mannose ring (Man‐O2) in the DC‐SIGN/ 1 complex (Figure 1 B). Pseudo‐dimannoside structures could be therefore expanded at this position and could, in principle, engage more productively with the protein, while remaining easily chemically accessible. The newly designed compounds derived from 1 were predicted to bind in the DC‐SIGN CRD with favorable interactions. As opposed to screening of non‐glycan small molecules, the present approach takes advantage of a natural sugar element to direct the ligand to the CRD, thus avoiding off‐target effects and interaction with other hot spots of the protein, which have been suggested to allosterically influence glycan binding.5
Results and Discussion
Fragment‐based virtual screening and ligand design
To locate vicinal pockets as putative additional binding regions, we explored the surrounding of the pseudo‐dimannoside binding site of DC‐SIGN. A virtual screening (VS) of the Maybridge database (over one thousand drug‐like fragments, http://www.maybridge.com) was performed by means of Glide using as starting point the crystallographic structure of DC‐SIGN in complex with 1 (PDB 2XR5). The center of the VS box was placed at the centroid among residues Phe313, Ser360 and Lys373, and was expanded by 10 Å in each x, y and z axis. A total of 50 fragments were selected (5 % best docked fragments) for visual inspection. Most of the fragments were placed in the region enclosed by residues Asn344, Glu358, Ser360, Asn365, Asp367, Phe313, Leu371 and Lys373 (Figure 2 A) and they all bore an ammonium moiety and an aromatic ring. The ammonium group was docked into an “ammonium‐binding pocket” in close proximity to the Ca2+ binding site and lined by Phe313, Glu358 and Ser360. Stabilizing interactions thus include ion pair with Glu358 side chain, hydrogen bond with Ser360 side chain, and cation–π contacts with Phe313 phenyl ring (Figure 2 A). Interestingly, the ammonium‐binding pocket identified by virtual screening corresponds to a region occupied by highly conserved water molecules in the known X‐ray structures of DC‐SIGN and its sugar complexes (PDB 2IT5, 2IT6, 2XR5, 1SL4 and 1K9I). The aromatic moiety of the fragments (either a phenyl or a heterocyclic ring) was found docked close to Phe313, Asn344 and Leu371 side chains and established π–π or CH–π interactions with these residues. Other fragments were predicted to bind outside the ammonium‐binding pocket, but were not prioritized for further design and synthesis.
Figure 2.
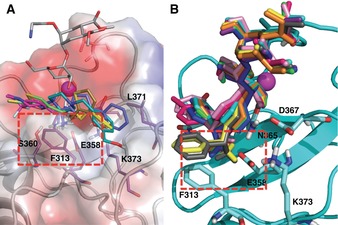
A) Selected superimposed fragments from virtual screening into the DC‐SIGN/1 complex (PDB 2XR5). The red box highlights the ammonium‐binding site and the main residues that flank it. B) Selected newly designed compounds with general structure 5. Superimposed docked poses into the average structure of DC‐SIGN from MD simulations are shown.
Excitingly, the pose of the fragments docked into the ammonium‐binding pocket clearly allowed for conjugation to the position 2 of the mannose ring of ps‐diMan 1, a position with many opportunities for functionalization not completely exploited so far. Among the possibilities explored, we focused on structures that can be easily accessible starting from the 2‐azido derivative of 1 (compound 4 in Scheme 1) and using Copper(I)‐catalyzed Alkyne Azide Cycloaddition (CuAAC) reaction with α‐aminoalkynes, to afford the amino triazoles 5 (Scheme 1). Thus, a number of derivatives of general formula 5 were computationally built as putative ligands (including the S and R configurations; Figures 3 and Figure S1 in the Supporting Information) and docked in the DC‐SIGN CRD (Figure 2 B), to predict their binding capability. The details of the calculations are reported in the Supporting Information.
Scheme 1.
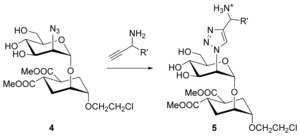
Putative ligands designed for docking analysis and synthesis.
Figure 3.

Triazole derivatives synthesized and tested as DC‐SIGN ligands.
The designed compounds were docked in three different DC‐SIGN conformations: two from the X‐ray crystallographic structures 2XR5 and 2IT5 (differing in some side chains orientations of the residues close to the carbohydrate binding site, Figure S2 in the Supporting Information), and a third one obtained as an average from the molecular dynamics (MD) simulation of apo DC‐SIGN from PDB 2XR5, in which rotamers of Val351 were observed. All designed compounds were predicted to bind the CRD mannoside‐binding site with the pseudo‐dimannoside moiety bound in similar pose to that of 1 in the complex with DC‐SIGN (PDB 2XR5). The triazole moiety has optimal orientation to reach the ammonium‐binding pocket and to allow the ammonium group to interact with Phe313 and Glu358 side chains (Figure 2 B and Figure S3 in the Supporting Information). On this basis, the synthesis of several triazole derivatives 5 was planned and executed as described below and selected DC‐SIGN/5 complexes were also submitted to MD simulations (see below).
Synthesis
For the synthesis of the 2‐azido pseudo‐dimannoside 4, glycosyl donor 9 was prepared in three steps starting from d‐mannosamine hydrochloride 6 (Scheme 2). Compound 6 was converted into the corresponding azide 8 by diazotransfer with imidazole‐1‐sulfonyl azide hydrogensulfate 7,6 as previously described for GlcNH2 and GalNH2. Applying the same reaction conditions to ManNH2 6 initially led to poor yields and irreproducible results. Alternative procedures for the preparation of 2‐deoxy‐2‐azidoMan derivatives have indeed been reported in the literature as producing manno‐/gluco‐ mixtures, in which the gluco‐like impurities are often ascribed to contamination of the mannosamine starting material.7 We found that formation of the gluco‐ by‐product (GlcN3) during the diazotransfer is actually due to epimerization at position 2, promoted by the excess of potassium carbonate. Stepwise addition of K2CO3 at low temperature (−20 °C) and careful pH control allow to avoid epimerization and to obtain reproducible high yields (90 %) of pure 1,3,4,6‐tetra‐O‐acetyl‐2‐deoxy‐2‐azidoMan 8, from which the 2‐deoxy‐2‐azidomannosyl donor 9 was obtained following established protocols.8
Scheme 2.
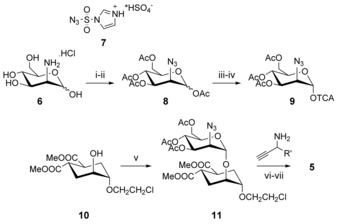
Synthesis of the ligands. i) 7, K2CO3, CuSO4*5H2O, MeOH, −20 °C to R.T., 4 h; ii) Ac2O, Py, RT, 12 h, 90 % over two steps; iii) MeNH2, THF, 0 °C–R.T., 5 h, 97 %; iv) Cl3CCN, DBU, CH2Cl2, 0 °C, 30 min, 79 %; v) 9, TMSOTf, CH2Cl2, −30 °C, 1 h, 95 %; vi) CuSO4⋅5 H2O, Na ascorbate, THF/water; vii) MeONa, MeOH, RT, 30 min.
The known acceptor 10 3a was glycosylated with 9 in the presence of a catalytic amount of TMSOTf, affording the desired common intermediate 11 in 90 % overall yield. Reaction of the azide 11 with alkynes through CuAAC9 followed by Zemplén deprotection afforded the triazole derivatives 5 and 12–16 (Scheme 2 and Figure 3), as detailed in the Supporting Information. The required alkynes were either commercially available, or prepared in a few steps, as described in the Supporting Information (Figure S7, Supporting Information). The synthesis of aryl‐propargyl amines in enantiomerically pure form is not trivial.10 For this preliminary screening we prepared triazole 5 d (Figure 3) as an epimeric mixture at the N‐bearing stereocenter by using the corresponding racemic propargyl amine (commercially available). The two isomers proved to be chromatographically inseparable, just as the corresponding methyl derivatives 5 c, and both molecules were tested as diastereomeric mixtures. On the contrary, the benzyl alcohols 15 b (Figure 3) synthesized as an epimeric mixture from (±)‐1‐phenylpropynol could be separated chromatographically and were tested as individual isomers, although the configuration of the benzylic stereocenter was not assigned (15 b R/S and 15 b S/R in Figure 3). The 2‐ and 3‐pyridyl derivatives 13 and 14 were synthesized from the corresponding commercially available alkynes.
SPR competition assay
The compounds obtained were tested by surface plasmon resonance (SPR) as potential inhibitors of DC‐SIGN interaction with an immobilized mannosylated bovine serum albumin (BSA). The IC50 values obtained from the SPR inhibition assays for the triazole derivatives and their parent compounds 1–3 (Figure 1 A) are plotted in Figure 4 A and the corresponding values collected in Table S1 (Supporting Information). In bearing with the computational predictions for the ammonium‐binding site, the methylenamino triazole derivative 5 a gave an IC50 of 108±1 μm, with one order of magnitude improvement over the parent ps‐diMan 1. Addition of methyl substituents on the α carbon of the triazole ring, as in 5 b,c was detrimental for the affinity. Similarly, additional methyl groups on the nitrogen atom, meant to stabilize the positive charge as in 12 a–c, led to a significant decrease in affinity. Collectively, these data suggest a negative effect of steric hindrance at, or near to, the ammonium‐binding site. Interestingly, ligand 15 a, in which the amine is replaced by a hydroxyl group, also provided a threefold affinity improvement over 1 (IC50 of 339±7 μm) suggesting a positive role of H‐bonding ability in that position. Indeed, docking of 15 a yielded a pose that placed the OH group into the ammonium‐binding site (not shown). This result is also in agreement with the observation that the ammonium‐binding site identified by VS overlaps with a highly conserved hydration site in the DC‐SIGN CRD crystals. The effect of aromatic substituents on the α carbon of the triazole ring was more difficult to dissect, because the epimeric mixture of α‐phenyl derivatives 5 d could not be separated. SPR analysis of the mixture yielded an IC50 of 407±7 μm (Figure 4 A), indicating a fourfold loss of activity relative to 5 a. Luckily, the corresponding epimeric alcohols 15 b R/S and 15 b S/R could be separated by flash chromatography and were tested separately in the inhibition experiment, yielding an IC50 value of 870±1 μm and 590±4 μm, respectively. Thus, none of the epimers provided an improvement over the parent alcohol 15 a. Alternatively, the 2‐pyridyltriazole 13, which does not feature a positive charge at the pH of the assay (pH 8), but presents the pyridine nitrogen adjacent to the triazole ring, afforded an IC50 180±6 μm and, thus, a very significant improvement over 1. This suggests that the pyridine moiety can be engaged in stabilizing (lipophilic) contacts with the protein surface. Docking calculations predict the pyridine ring to be involved in edge‐to‐face interactions with the Phe313 side chain and possibly in H‐bonding interaction with Lys373. Indeed, the position of the pyridine nitrogen appears to play a crucial role, since the 3‐pyridyl derivative 14, with an IC50 609±6 μm, shows a fivefold loss of activity relative to 13. Overall, functionalization of the mannose residue with a triazole ring carrying an ammonium group was found to increase the DC‐SIGN affinity, as expected based on the computational models. So far, the beneficial effects of an aromatic substituent have not been fully confirmed by the limited set of compounds synthesized and analyzed.
Figure 4.
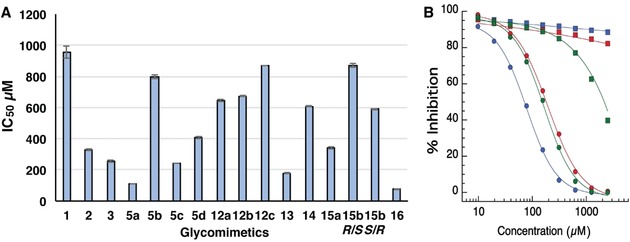
A) IC50 of triazoles derivatives towards DC‐SIGN (corresponding numerical values in Table S1); B) SPR inhibition assay for 5 a (green), 13 (red) and 16 (blue). Inhibition curves of DC‐SIGN (circle) and langerin (square) binding to a mannosylated surface are shown.
Based on the SPR results, 5 a was chosen as lead compound for transformation into 16 (Figure 3), which combines the backbone structure of 2 (carrying two p‐hydroxymethylenebenzylamide substituents on the cyclohexane ring) and the functionalization of 5 a at mannose C‐2. As mentioned above, 2 has an enhanced affinity towards DC‐SIGN compared to 1 (IC50=329 μm and 956 μm for 2 and 1, respectively) and is significantly more selective against langerin.3a Thus, this switch of scaffold was expected to improve both affinity and selectivity of the ammonium‐carrying ligand. SPR binding inhibition studies were performed for 16 and DC‐SIGN affording an IC50 of 76±3 μm (Figure 4 A). Additionally, 5 a, 13 and 16 were also tested against langerin: selectivity towards DC‐SIGN increased from 5 a to 13 and reached a maximum with 16 (Figure 4 B). Thus, 16 is the most effective and selective mannose‐based glycomimetic antagonist developed to date against DC‐SIGN.
Biophysical characterization of 16 binding to DC‐SIGN
To further characterize the binding interaction of 16 with DC‐SIGN, an ITC titration was performed. Ligand 16 (2.5 mm) was titrated into a DC‐SIGN solution (100 μm) (Figure S5 A, Supporting Information). A one binding site model fitting of the data with an assumed stoichiometry value fixed to 1 yielded an equilibrium dissociation constant K D of 52.0±1.3 μm, in agreement with the IC50 determined by competition assay (IC50 76±3 μm). The high affinity of 16 for DC‐SIGN also allowed for the evaluation of the interaction in a SPR direct binding mode by using a DC‐SIGN functionalized surface.11 The resulting K Dapp from steady state fitting was found to be 52.7±2.7 μm (Figure S5 B, Supporting Information) in good agreement with the results obtained by ITC. The ITC analysis yielded ΔH=−19.6±0.2 kJ mol−1 and a TΔS=4.9±0.2 kJ mol−1, leading to a ΔG of −24.46 kJ mol−1. Thus, 16 binding is mainly enthalpically driven, potentially due to the additional interactions brought by the amino group added in 16.
X‐ray crystallography
Co‐crystallization experiments of DC‐SIGN CRD and 16 were conducted. Crystals were obtained and their structure was solved at 2.1 Å resolution (PDB 6GHV). The data revealed a totally new crystal packing, compared to previous DC‐SIGN structures, with an asymmetric unit composed of six CRDs and six molecules of 16 (Figure 5 A). This crystal packing (space group P1211) is enabled by each ligand molecule reaching out to a second CRD unit, thus forming a symmetric network (Figure 5 C). Each ligand therefore bridges the canonical Ca2+ binding site in one CRD and a cavity generated between helix 2 and the following loop upstream of the β4 strand of the next CRD (Figure 5 C). As expected, the Ca2+ ion is coordinated by Man‐O3 and Man‐O4, while the noncanonical site in the next CRD is occupied by one of the p‐hydroxymethylenebenzylamide substituents of 16. In addition to these two main interactions sites, 16 is also in contact with a neighboring third CRD (the green chain in Figure 5 B), thanks to the second benzylamide arm. The binding mode of 16, due to the extended interaction with DC‐SIGN CRDs in this packing, is very well defined, allowing a fine analysis within each different binding site (Figure 5 B,C as well as Figures 6 and 7). Compared to the X‐ray structure of DC‐SIGN/ 1 complex, the two additional fragments of 16 that make contact with the protein, both the ammonium group and the intercalated benzylamide arm, point to druggable secondary sites recently identified by Aretz et al.12 (Figure S6, Supporting Information).
Figure 5.
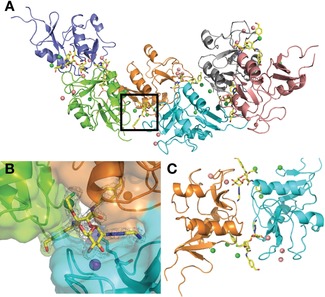
Crystallization packing dependence on 16. A) Crystal packing within crystals of the DC‐SIGN CRD/16 complex, dark square is zoomed in B). B) Omit map of 16 highlighting its position at the interface of three CRD units. The majority of interactions occur with two of the CRDs (cyan and orange chains). C) Symmetrical dimer of CRDs bridged by two molecules of 16. Both ligands are bound to one of the CRDs through the canonical Ca2+ ion site and establish an additional interaction with a second CRD, involving one benzylamide arm of 16 and a cavity between helix 2 and the loop upstream of the CRD ß5 strand. Pink spheres are Ca2+ ions, green spheres are chloride ions.
Figure 6.
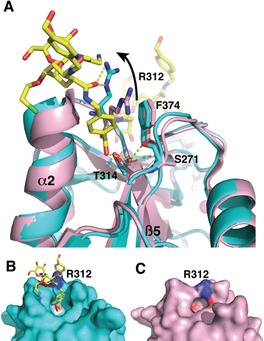
Non‐canonical binding site of 16. A) Overlay of DC‐SIGN CRD X‐ray structure (pink, PDB 1K9I) and DC‐SIGN CRD co‐crystallized with 16 (cyan, PDB 6GHV) highlighting the kink of helix‐2 due to insertion of the p‐hydroxymethylenebenzylamide fragment. A second copy of 16 in its canonical Ca2+ binding site can be seen in the back of the Figure, where the Ca2+ ion is shown in magenta. B) and C) The comparison between the two CRDs shows the cavity generated by Arg312 movement (see in A).
Figure 7.
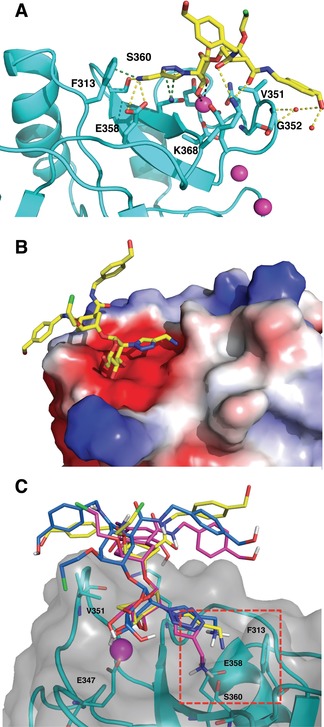
A) Binding mode of 16 in the canonical Ca2+ binding site of DC‐SIGN (PDB 6GHV). H bonds are represented in yellow, van der Waals and cation–π interactions with Phe313 in green. Ca2+ ions are represented as magenta sphere. B) The same complex. View rotated by 180° and protein represented as electrostatic surface. C) 3D Structure of DC‐SIGN (cyan) in complex with compound 16 (blue) from MD simulation. Superimposed crystallographic (yellow, PDB 6GHV) and docked (magenta) poses of compound 16 are depicted.
The noncanonical interaction site that determines the bridge between CRDs by 16 in the crystals is shown in Figure 6. The overlay of the backbone structures of DC‐SIGN CRD (PDB 1K9I, Figure 6, pink) with the structure of our complex (Figure 6, cyano) shows a conservation of structural elements, with the exception of a kink in helix 2. This helix movement results from the insertion of a p‐hydroxymethylenebenzylamide arm between the helix and a facing loop (Figure 6). Backbone CO group from Ser271 provides stabilizing H‐bond with the benzylic hydroxy group of 16 through a bridging water molecule (Figure 6 A), whereas a large movement of Arg312 generates the required cavity (compare Figure 6 B and C) and provides additional stabilization through H‐bond with the amide carbonyl (Figure 6 A). These structural adjustments for the p‐hydroxymethylenebenzylamide arm illustrate the plasticity of the CRD backbone of DC‐SIGN as previously observed for langerin.13
In the crystal, 16 interacts similarly to the previously characterized binding mode for the glycomimetics 1–3 3, 14 exploiting Val351 side chain for nonpolar interactions with the cyclohexane ring. Here, for the first time, details of the interaction of the benzylamide arm with the primary CRD surface, previously suggested by NMR studies, are highlighted. Thus, the amide carbonyl is H‐bonded to Lys368 in the CRD, the benzyl ring is in van der Waals contact with the loop containing Val351 and Gly352 and the terminal OH group is involved in a H‐bonding network with the protein surface through two water molecules (Figure 7 A). These results are in agreement with MD calculations of the complex, which anticipated one of the benzylamide arms to be dangling in the solvent (thus becoming available for the secondary interactions described above) and the second one oscillating CH–π interactions with Val351 and Gly352, whereas its terminal hydroxyl group alternates H‐bonds with the backbone CO of Asn350, Gly352 NH and solvent water molecules (Figure 7 C and Figure S4 in the Supporting Information). The additional ammonium group, connected to mannose C‐2 through a triazole linker, reaches Ser360 and Glu358, as initially predicted from the docking analysis. Interestingly, also the MD simulations of DC‐SIGN/16 described a stable complex, with the ammonium group interacting with Phe313 and Glu358 side chains during the entire simulation time (100 ns, Figure S4, Supporting Information). In this position, a cation–π interaction is also generated with Phe313, as expected from the distance of 3.3 Å between the ammonium group and the phenyl ring (Figure 7 A). The cumulative interactions resulting from the ammonium ion may account for the improved enthalpy contribution to the binding observed in the ITC studies described above. In Figure 7 B, the CRD representation as electrostatic surface potential highlights the negative potential favoring ammonium binding.
Due to the peculiar position of 16 at the interface of three CRDs in the crystal packing, the relevance of the binding mode observed in the Ca2+ binding site could be questioned. However, the conservation of the binding mode observed with 1 and 2, from which 16 is derived, and the perfect correlation of the ammonium group binding pocket with the computational prediction support the coherence of the complex structure observed. The question remains whether the unexpected bridging interaction observed in the crystal may also be present in solution and account for the improved affinity of 16 for DC‐SIGN. Bridging of DC‐SIGN tetramers by glycomimetic ligands in solution has been previously observed and characterized by analytical ultracentrifugation (AUC) with a pseudo‐trimannoside compound.15 Thus, to discriminate between a crystallization‐induced artefact and a genuine additional binding site in solution, AUC experiments were performed by using either DC‐SIGN CRD (Figure 8 A, crystallization condition) or the full tetrameric extracellular domain (ECD, Figure 8 B) at fixed concentration (56 and 26 μm, respectively), while increasing the concentration of 16. For the CRD, the sedimentation coefficient remained unchanged to a value around 1.8 S (s 20 w=2.1 S), at all the used concentrations of 16, showing the absence of dimerization and, therefore, the absence of a clustering effect of 16 towards DC‐SIGN CRD in solution, as opposed to the crystal context. The same was found for DC‐SIGN ECD, which sedimented as a tetramer at 4.5 S (s 20 w=5.4 S, close to the previously published), alone and in the presence of 16.15, 16 From this last characterization, we can assume that only binding in the canonical Ca2+ site exists in solution and is by itself responsible for the unprecedented affinity observed with this glycomimetic.
Figure 8.
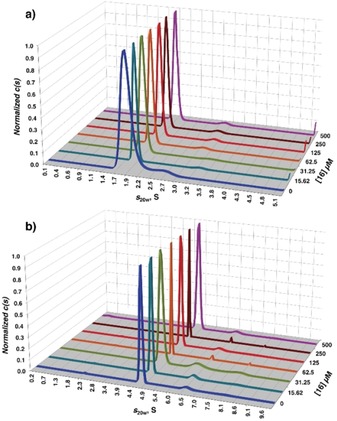
AUC analysis of A) DC‐SIGN CRD/16 complex and B) DC‐SIGN ECD/16 complex in solution.
Conclusion
In summary, chemical modification of the known glycomimetic ligand 1 guided by fragment‐based design allowed for the exploitation of an ammonium‐binding region in the vicinity of the sugar‐binding site of DC‐SIGN, improving by one order of magnitude the inhibitory potency. ITC confirmed that the novel antagonist 16, with a K D of 52±1 μm, is among the most potent monovalent DC‐SIGN ligands so far described,17 whereas SPR analysis showed that it is also fully selective for DC‐SIGN versus langerin. The X‐ray structure of the DC‐SIGN/16 complex fully validated the modeling prediction and offered a structural basis for the result interpretation. In particular, the presence of an ammonium ion in 16 contributes simultaneously to the high affinity for DC‐SIGN, by interacting with an ammonium‐binding region in the vicinity of Phe313, and to the selectivity for DC‐SIGN vs. langerin, which harbors a largely positive binding site rich in lysine residues.3b AUC analysis convincingly confirmed that the affinity increase observed for 16 relative to previous pseudo‐dimannoside‐type ligands is not due to induced aggregation of soluble DC‐SIGN CRD. Altogether, these features make 16, originated from a fragment‐based design approach, the best glycomimetic developed to date to efficiently target DC‐SIGN. In addition, the intriguing features observed in the X‐ray structure of the DC‐SIGN/16 complex offer a glimpse of the plasticity of the receptor CRD, which is likely to be central to a full understanding of its machinery.
Experimental Section
Computational methods
Virtual screening was performed by using Glide and the Maybridge Ro3 core set fragment library. Ligand docking was performed by using AutoDock 4 and the MD simulations using AMBER14. The experimental details are reported in the Supporting Information.
Syntheses
General experimental conditions are reported in the Supporting information. 3‐Azidosulfonyl‐3H‐imidazol‐1‐ium hydrogen sulfate 7 was synthesized as described in Ref. 6b. The alkynes used for the CuAAC reactions are collected in Figure S7 (Supporting Information). The synthesis of the non‐commercially available alkynes and the full synthesis of 16 are described in the Supporting information.
1,3,4,6‐Tetra‐O‐acetyl‐2‐azido‐2‐deoxy‐d‐mannopyranose (8): d‐Mannosamine hydrochloride (1.2050 g, 5.59 mmol, 1 mol equiv) was suspended in dry MeOH (50 mL) and cooled to −20 °C. K2CO3 (811 mg, 5.87 mmol, 1.05 mol equiv) was dissolved in 4 mL water and added to the stirred suspension. CuSO4*5H2O (14 mg, 0.06 mmol, 0.01 mol equiv) was added to the mixture. Another portion of K2CO3 (811 mg, 5.87 mmol, 1.05 mol equiv) in 4 mL water was added, immediately followed by the addition of imidazole‐1‐sulfonyl azide (1.8190 g, 6.7080 mmol, 1.2 mol equiv). The pH was continuously controlled and the reaction was stirred at −20 °C for 2 hours, when it was left to warm to RT (light‐blue suspension). After 4 hours, only one major spot was detected by TLC (R f=0.4 in 8:2 CH2Cl2/MeOH). The solvent was evaporated in vacuo and the crude was suspended in dry pyridine (20 mL). The mixture was cooled to 0 °C and Ac2O (4.22 mL, 44.72 mmol, 8 mol equiv) was added dropwise. The reaction was stirred overnight at RT and the next day only one major spot was detected on TLC (R f=0.36 in toluene/EtOAc=9:1). The crude was purified by flash chromatography (toluene/EtOAc=9:1) to yield the pure product 8 as a white foam (1.9 g, 92 %), α/β=2:1. α‐anomer: 1H NMR (400 MHz, CDCl3): δ=6.09 (d, 1 H, H1, J 1‐2=1.9 Hz), 5.43–5.34 (m, 2 H, H3, H4), 4.21 (dd, 1 H, H6a, J=4.6 Hz, J=12.4 Hz), 4.08 (dd, 1 H, H6b, J=2.2 Hz, J=12.4 Hz), 4.04–3.98 (m, 2 H, H2, H5), 2.16 (s, 3 H, AcO), 2.11 (s, 3 H, AcO), 2.09 (s, 3 H, AcO), 2.05 ppm (s, 3 H, AcO); 13C NMR (100 MHz, CDCl3): δ=170.6 (C=O (AcO)); 169.9 (C=O (AcO)); 169.3 (C=O (AcO)); 168.1 (C=O (AcO)); 91.7 (C1); 71.1 (C3); 71.1 (C5); 65.6 (C4); 62.1 (C6); 60.1 (H2); 21.2 (Me (OAc)); 20.9 (Me (OAc)); 20.9 (Me (OAc)); 20.8 ppm (Me (OAc)).
β‐anomer: δ=5.81 (d, 1 H, H1, J 1‐2=1.4 Hz), 5.27 (t, 1 H, H4), 5.04 (dd, 1 H, H3, J=3.7 Hz, J=9.8 Hz), 4.23 (dd, 1 H, H6a, J=4.9 Hz, J=12.4 Hz), 4.06 (dd, 1 H, H6b, J=2.4 Hz, J=12.4 Hz), 4.04–3.98 (m, 1 H, H2), 3.70 (ddd, 1 H, H5, J=2.4 Hz, J=4.9 Hz, J=9.9 Hz), 2.18 (s, 3 H, AcO), 2.11 (s, 3 H, AcO), 2.08 (s, 3 H, AcO), 2.04 ppm (s, 3 H, AcO). 13C NMR (100 MHz, CDCl3): δ=170.6 (C=O (AcO)); 169.9 (C=O (AcO)); 169.3 (C=O (AcO)); 168.1 (C=O (AcO)); 91.5 (C1); 73.6 (C5); 72.2 (C3); 65.3 (C4); 62.1 (C6); 61.4 (H2); 21.1 (Me (OAc)); 21.1 (Me (OAc)); 21.0 (Me (OAc)); 20.9 ppm (Me (OAc)).
3,4,6‐Tri‐O‐acetyl‐2‐azido‐2‐deoxy‐d‐mannopyranose . 1,3,4,6‐tetra‐O‐acetyl‐2‐azido‐2‐deoxy‐d‐mannopyranose 8 (506 mg, 1.36 mmol, 1 mol equiv) was dissolved in 1 mL dry THF and cooled to 0 °C. 813 μL 2 m MeNH2 in THF (1.63 mmol, 1.2 mol equiv) was added to the solution and the reaction was stirred at RT for 1.5 hours. After completion, the mixture was concentrated and the crude was purified by flash chromatography (R f: 0.27 (α) and 0.24 (β) in toluene/EtOAc=6:4). The product was obtained in 97 % yield (437 mg) as a 87:13 α : β anomeric mixture. 1H NMR (400 MHz, CDCl3): α‐anomer: δ=5.45 (dd, 1 H, H3, J2‐3=3.8 Hz, J 3‐4=9.8 Hz), 5.35 (t, 1 H, H4, J 4‐5=9.5 Hz), 5.27 (s, 1 H, H1), 4.26–4.09 (m, 3 H, H6a,b, H5), 4.06 (dd, 1 H, H2, J 1‐2=1.8 Hz), 2.10 (s, 3 H, OAc), 2.09 (s, 3 H, OAc), 2.05 (s, 3 H, OAc). β‐anomer: δ=5.29–5.23 (m, 1 H, H4), 5.13 (dd, 1 H, H3, J 2‐3=3.8 Hz, J 2‐3=9.9 Hz), 4.91 (d, 1 H, H1, J 1‐2=6.4 Hz), 4.26–4.10 (m, 2 H, H6a,b), 3.67–3.60 (m, 2 H, H5, H2), 2.12 (s, 3 H, OAc), 2.10 (s, 3 H, OAc), 2.05 ppm (s, 3 H, OAc); 13C NMR (100 MHz, CDCl3): α‐anomer: δ=170.8 (C=O (AcO)); 170.0 (C=O (AcO)); 169.6 (C=O (AcO)); 92.8 (C1); 70.7 (C3); 68.6 (C5); 65.9 (C4); 62.2 (C6); 61.7 (C2); 20.8 (Me (OAc)); 20.7 (Me (OAc)); 20.6 (Me (OAc)). β‐anomer: δ=170.8 (C=O (AcO)); 170.0 (C=O (AcO)); 169.6 (C=O (AcO)); 92.7 (C1); 72.8 (C3); 72.4 (C5); 65.4 (C4); 63.5 (C2); 62.1 (C6); 20.8 (Me (OAc)); 20.7 (Me (OAc)); 20.6 ppm (Me (OAc)); MS (ESI): m/z calculated for [C12H17N3O8Na]+: 354.1 [M+Na]+; found: 354.1.
2‐Azido‐2‐deoxy‐3,4,6‐tri‐O‐acetyl‐d‐mannose trichloroacetimidate (9): 3,4,6‐tri‐O‐acetyl‐2‐azido‐2‐deoxy‐d‐mannopyranose (400 mg, 1.20 mmol, 1 mol equiv) was dissolved in 5 mL CH2Cl2, cooled to 0 °C and trichloroacetonitrile (1.33 mL, 13.29 mmol, 11 mol equiv) was added to the solution. Then, 1,8‐diazabicyclo[5.4.0]undec‐7‐ene (DBU; 45 μL, 0.30 mmol, 0.25 mol equiv) was added and the reaction was stirred at RT under N2 overnight. After completion, the mixture was concentrated and the crude was purified by flash chromatography (R f: 0.38 in hexane/EtOAc=75:25) to yield the pure product as a white foam (439 mg, 77 % yield, exclusively α‐product). [α] : +88.9° (c=0.6 in CH2Cl2). 1H NMR (400 MHz, CDCl3): δ=8.77 (s, 1 H, NH), 6.29 (d, 1 H, H1, J 1‐2=1.8 Hz), 5.45 (t, 1 H, H4, J 4‐3=J 4‐5=10.0 Hz), 5.43 (m, 1 H, H3), 4.28 (dd, 1 H, H2, J 2‐3=3.3 Hz), 4.25 (dd, 1 H, H6a, J 6a‐6b=12.7 Hz, J 6a‐5=4.8 Hz,), 4.18–4.12 (m, 2 H, H5, H6b), 2.12 (s, 3 H, OAc), 2.09 (s, 3 H, OAc), 2.07 ppm (s, 3 H, OAc); 13C NMR (100 MHz, CDCl3): δ=170.8 (C=O (AcO)); 170.1 (C=O (AcO)); 169.6 (C=O (AcO)); 160.0 (C=NH); 95.5 (C1); 90.42 (CCl3); 71.4 (C5); 70.8 (C3); 65.2 (C4); 61.8 (C6); 60.0 (C2); 20.9 (OAc); 20.8 (OAc); 20.7 ppm (OAc); MS (ESI): m/z calculated for [C14H17Cl3N4O8Na]+: 497.01 [M+Na]+; found: 496.88.
1,2‐Cyclohexanedicarboxylic acid, 4‐(2‐chloroethoxy)‐5‐((3,4,6‐O‐triacetyl)‐2‐azido‐α‐d‐2‐deoxymannopyranosyloxy)‐1,2‐dimethylester (1S,2S,4S,5S) (11): A mixture of the acceptor 10 3a (124 mg, 0.42 mmol, 1 mol equiv) and the donor 9 (200 mg, 0.42 mmol, 1 mol equiv) was co‐evaporated with toluene three times. Powdered and activated 4 Å molecular sieves (acid washed) were added. The mixture was kept under vacuum for 3–4 hours and then dissolved in dry CH2Cl2 (10 mL). After cooling to −30 °C, trimethylsilyl trifluoromethanesulfonate (TMSOTf; 15.2 μL, 0.084 mmol, 0.2 mol equiv) was added to the stirred mixture. The solution was stirred at −30 °C for 1 hour and upon completion, the reaction was quenched with triethylamine (TEA). The mixture was warmed to room temperature and filtered over a Celite pad. The filtrate was evaporated at reduced pressure and the crude product was purified by flash chromatography (hexane/EtOAc=72:28) to yield the pure product as a white foam (240 mg, 94 % yield, exclusively α‐product). [α] : +73.4° (c=0.68 in CH2Cl2); 1H NMR (400 MHz, CDCl3): δ=5.35 (dd, 1 H, H3, J 3‐2=3.6 Hz, J 3‐4=9.6 Hz), 5.29 (dd, 1 H, H4, J 4‐5 = 9.4 Hz), 4.98 (d, 1 H, H1, J 1‐2 = 1.5 Hz), 4.21 (dd, 1 H, H6a, J 6‐5 = 5.4 Hz, J 6‐6b = 12.2 Hz), 4.08 (dd, 1 H, H6b, J 6b‐5=2.3 Hz), 4.03 (m, 1 H, H2), 3.98–3.94 (m, 1 H, H5), 3.94–3.90 (m, 1 H, C2), 3.87–3.80 (m, 1 H, H7a), 3.70 (s, 3 H, H10), 3.69 (s, 3 H, H10), 3.68–3.64 (m, 1 H, H7b), 3.62–3.59 (m, 2 H, H8a,b), 3.59–3.58 (m, 1 H, C1), 3.02 (dt, 1 H, C4, J C4‐C3eq=4.0 Hz, J C4‐C3ax=J C4‐C5=12.0 Hz), 2.88 (dt, 1 H, HC5, J C5‐C6eq = 4.0 Hz, J C5‐C6ax =12.0 Hz), 2.10 (s, 3 H, OAc), 2.08 (s, 3 H, OAc), 2.04 (s, 3 H, OAc), 2.10–1.80 ppm (m, 4 H, HC3ax, HC3eq, HC6eq, HC6ax); 13C NMR (100 MHz, CDCl3): δ=174.9 (C9); 174.6 (C9); 170.8 (C=O (AcO)); 170.0 (C=O (AcO)); 169.6 (C=O (AcO)); 95.9 (C1); 75.3 (CC1); 71.7 (CC2); 71.0 (C3); 69.6 (C7); 69.2 (C5); 66.3 (C4); 62.6 (C6); 61.9 (C2); 52.2 (C10); 43.2 (C8); 39.2 (CC5); 39.0 (CC4); 28.0, 26.8 (CC3, CC6); 20.9 (Me (AcO)); 20.8 (Me (AcO)); 20.7 ppm (Me (AcO)); MS (ESI): m/z calculated for [C24H34ClN3O13Na]+: 630.17 [M+Na]+, found: 630.51
General procedure for CuAAC reactions. 1 m CuSO4⋅5 H2O and Na ascorbate solutions were prepared in degassed water. The alkyne (1 mol equiv) was dissolved in degassed THF and 0.1 equiv CuSO4⋅5 H2O solution and 0.4 mol equiv Na ascorbate solutions were added, under nitrogen atmosphere. The azide was also dissolved in degassed THF and added to the mixture. The reaction was stirred under nitrogen, then, upon completion, QuadraSilTM MP metal scavenger was added to remove the copper, the mixture was filtered and concentrated in vacuo. When the purity of the protected product was satisfactory, the crude was used directly in the following Zemplén‐deprotection step.
General procedure for Zemplén deacetylation: 1 mol equiv acetylated compound was dissolved in distilled MeOH and 1 m freshly prepared NaOMe in MeOH was added to the solution (1.5 mol equiv NaOMe) to 0.1 m final concentration of the substrate. After completion, the reaction was neutralized with Amberlite® IR120 hydrogen form ion‐exchange resin, filtered and concentrated in vacuo. The crude was purified by direct (CH2Cl2/MeOH) or reversed‐phase flash chromatography (water/MeOH/MeCN, for ammonium salts 0.01 % TFA was added), yielding the pure product. Compounds 5 a–c, 12 a–c and 16 were isolated as ammonium trifluoroacetate salts.
Compound 16: Obtained in 76 % yield over two steps (CuAAC and deacetylation). R f: 0.38 in water/MeOH=1:1 +0.01 % TFA. 1H NMR (400 MHz, CD3OD): δ=8.29 (s, 1 H, HTrCH), 7.30–7.18 (m, 8 H, H12, H13), 5.28 (s, 1 H, H1), 5.22 (dd, 1 H, H2, J 1‐2=1.0 Hz, J 2‐3=5.1 Hz), 4.55 (d, 4 H, H10, J=2.6 Hz), 4.32–4.20 (m, 7 H, H3, H15, H16), 4.12–4.08 (m, 1 H, C2), 3.92–3.82 (m, 3 H, H6a,b, H7a), 3.79–3.72 (m, 3 H, H5, H7b, C1), 3.69–3.60 (m, 3 H, H8a,b, H4), 3.01–2.83 (m, 2 H, C4, C5), 2.03–1.89 ppm (m, 4 H, C3, C6); 13C NMR (100 MHz, D2O): δ=177.9 (C9); 177.6 (C9); 142.5, 142.4 (C14); 140.7 (CTrq); 139.8 (C11); 129.3 (C13); 129.2 (C12); 126.8 (CTrCH); 98.3 (C1); 77.1 (CC1 or C5); 76.7 (C5 or CC1); 73.2 (CC2); 71.6 (C7); 71.1 (C3); 69.0 (C4); 65.8 (C10); 65.5 (C2); 63.0 (C6); 45.2 (C8); 44.6, 44.5 (C15); 42.5 (CC4, CC5); 36.3 (C16); 30.8, 29.3 ppm (CC3, CC6). MS (HRMS): m/z calculated for [C35H48ClN6O10]+: 747.3120 [M+H]+, found: 747.3123.
Sample preparation for ITC
ITC experiments were performed at 25 °C by using a TA Instrument Nano Isothermal Titration Calorimeter Low Volume (Nano ITC LV) with a 190 μL cell volume. Compound 16 and DC‐SIGN ECD were prepared in 25 mm Tris‐HCl at pH 8, 150 mm NaCl, 4 mm CaCl2 and 4 % DMSO. 100 μm of DC‐SIGN ECD and 2.5 mm compound concentrations were used. The compound was stepwise injected (1.03 μL) into DC‐SIGN solution by using 5 min intervals between injections. A blank titration (compound to buffer) was done for subtraction of dilution heat from the integrated data. A one‐site binding model was fitted to the data (nanoAnalyse 2.20 TA), yielding dissociation constants (K D) and binding enthalpies (ΔH).
Surface plasmon resonance (SPR) analysis
The extracellular domain (ECD) of DC‐SIGN (residues 66–404) was overexpressed and purified as previously described. The SPR experiments were performed on a BIAcore T200 using a CM3 sensor chip. Flow cells were activated as previously described.18 Flow cell one was functionalized with BSA and blocked with ethanolamine and subsequently used as a control surface. Flow cells 2 and 3 were treated with BSA‐Manα1‐3[Manα1‐6]Man (Dextra) (60 μg mL−1) in 10 mm NaOAc pH 4 to reach different binding densities and blocked with ethanolamine. The final densities on flow cells 2 and 3 were 2579 and 2923 RU, respectively. The affinity of the various compounds for DC‐SIGN ECD were evaluated via an established inhibition assay18 in which DC‐SIGN ECD was injected at 20 μm alone or in the presence of increasing concentration of inhibitors (ranging from 0 to 5 mm). Injections were performed at 5 μL min−1 using 25 mm Tris‐HCl pH 8, 150 mm NaCl, 4 mm CaCl2, 0,05 % P20 surfactant as running buffer. The surface was regenerated by the injection of 50 mm EDTA.
Crystallization and X‐ray data collection
HTX crystallization platform (EMBL) was used to screen conditions of co‐crystallization with the hanging‐drop vapor‐diffusion method at 293 K. The drop was composed of a protein/reservoir ratio of 1:1 with protein concentrated at 5.54 mg mL−1 in 150 mm NaCl, 4 mm CaCl2, 25 mm Tris‐HCl pH 8, 2 % (v/v) DMSO buffer and 3.25 mm 16. Among the crystallization hits obtained, the condition F04 (200 mm Mg(NO3)2, 20 % PEG 3350) from the kit PEGs‐Suite Qiagen was chosen for manual optimization screening with four different buffers (MES pH 6, HEPES pH 7, Tris pH 8 and Bicine pH 9), concentration of PEG 3350 (15 %‐25 %) and Mg(NO3)2 concentration (from 150 to 200 mm). Finally, the best crystals were obtained in the following condition: 20 % PEG 3350, 200 mm Mg(NO3)2, 100 mm MES pH 6.
Crystals were directly flash frozen in liquid nitrogen using Paratone‐N as cryoprotectant. Data collection was performed at id30A‐1 beamline (MASSIF‐1), ESRF Grenoble, 3200 images were collected at 100°K, with an oscillation range of 0.05°, an exposure time of 0.039 s per image, and a wavelength of 0.966 Å. Data processing and refinement statistics are described in Table S2 (Supporting Information). Coordinates and associated structure factors have been deposited in the PDB database, code: 6GHV.
Analytical ultracentrifugation
Sedimentation velocity experiments were performed in a Beckman XL‐I analytical ultracentrifuge with a rotor Anti‐50 (Beckman Coulter, Palo Alto, USA) and double‐sector cells of optical path length 3 and 1.5 mm equipped of Sapphire windows (Nanolytics, Potsdam, DE). Samples were centrifuged at 42 000 rpm (130 000 g), at 20 °C. Sedimentation velocity profiles were acquired at 280 nm, every 10 min, with a 30 mm radial step size. DC‐SIGN CRD or ECD concentration was fixed at 1.0 mg mL−1 (56 and 26 μm, respectively), and compound 16 was used at variable concentration of 0, 15.6, 31.25, 62.5, 125, 250, and 500 μm. Solvent was 25 mm Tris‐HCl pH8, 150 mm NaCl, 4 mm CaCl2, 4 mm DMSO (density 1.0055 g mL−1 and viscosity 1.0235 cp, estimated, neglecting DMSO, using the SEDNTERP software (available free at http://sednterp.unh.edu/). The partial specific volume (v̄) for DC‐SIGN CRD and DC‐SIGN ECD, was estimated from the amino acid compositions as 0.712, and 0.731 mL g−1, respectively, and their molar mass (M) as 17.7 and 38.8 kDa, by using the SEDFIT software (available free at https://sedfitsedphat.nibib.nih.gov). Data were analyzed in terms of continuous size distribution c(s) of sedimentation coefficients, s,19 by using SEDFIT. Peak integration and figures were done with the GUSSI software20 (http://biophysics.swmed.edu/MBR/software.html). The s and M values were combined in the Svedberg equation to calculate the hydrodynamic radius, R H, or frictional ratio f min (f/f min=R H/R min, with R min the radius of the anhydrous volume) [Eq. 1]:

for DC‐SIGN CRD considered as a monomer, f/f min=1.4 is derived from the experimental s=1.8 S, which corresponds to a moderately anisotropic shape.21 The Svedberg equation was also used to derive corrected in water and at 20 °C s 20w values.
Conflict of interest
The authors declare no conflict of interest.
Supporting information
As a service to our authors and readers, this journal provides supporting information supplied by the authors. Such materials are peer reviewed and may be re‐organized for online delivery, but are not copy‐edited or typeset. Technical support issues arising from supporting information (other than missing files) should be addressed to the authors.
Supplementary
Acknowledgements
This project has received funding from the European Union Horizon 2020 research and innovation program under the Marie Sklowdowska‐Curie grant agreement No. 642870 (Immunoshape. Fellowships to L.M. and S.A.). Support by the Italian Ministry of Research through a PRIN grant (prot. 2015RNWJAM 002) and by the Spanish Ministry of Science MICINN (grants CTQ2014‐57141‐R and CTQ2017‐88353‐R, and fellowship BES 2015–071588 to J.G.C.) is acknowledged. The platforms of the Grenoble Instruct center (ISBG; UMS 3518 CNRS‐CEA‐UGA‐EMBL) and the Unitech Cospect platform in Milano (HRMS analysis) were used. SPR and MP3 platforms support from FRISBI (ANR‐10‐INSB‐05‐02) and GRAL (ANR‐10‐LABX‐49‐01) within the Grenoble Partnership for Structural Biology (PSB). F.F. also acknowledge the French Agence Nationale de la Recherche (ANR) PIA for Glyco@Alps (ANR‐15‐IDEX‐02). We are grateful to C. Rademacher for sharing structural file highlighting the secondary druggable binding sites of DC‐SIGN described in Ref. [12].
L. Medve, S. Achilli, J. Guzman-Caldentey, M. Thépaut, L. Senaldi, A. Le Roy, S. Sattin, C. Ebel, C. Vivès, S. Martin-Santamaria, A. Bernardi, F. Fieschi, Chem. Eur. J. 2019, 25, 14659.
Contributor Information
Dr. Sonsoles Martin‐Santamaria, Email: smsantamaria@cib.csic.es.
Prof. Anna Bernardi, Email: anna.bernardi@unimi.it.
Prof. Franck Fieschi, Email: franck.fieschi@ibs.fr.
References
- 1.
- 1a. Brown G. D., Willment J. A., Whitehead L., Nat. Rev. Immunol. 2018, 18, 374–389; [DOI] [PubMed] [Google Scholar]
- 1b. van Kooyk Y., Geijtenbeek T. B., Nat. Rev. Immunol. 2003, 3, 697–709. [DOI] [PubMed] [Google Scholar]
- 2.
- 2a. Ordanini S., Varga N., Porkolab V., Thepaut M., Belvisi L., Bertaglia A., Palmioli A., Berzi A., Trabattoni D., Clerici M., Fieschi F., Bernardi A., Chem. Commun. 2015, 51, 3816–3819; [DOI] [PubMed] [Google Scholar]
- 2b. Berzi A., Ordanini S., Joosten B., Trabattoni D., Cambi A., Bernardi A., Clerici M., Sci. Rep. 2016, 6, 35373; [DOI] [PMC free article] [PubMed] [Google Scholar]
- 2c. Ordanini S., Goti G., Bernardi A., Can. J. Chem. 2017, 95, 881–890. [Google Scholar]
- 3.
- 3a. Varga N., Sutkeviciute I., Guzzi C., McGeagh J., Petit-Haertlein I., Gugliotta S., Weiser J., Angulo J., Fieschi F., Bernardi A., Chem. Eur. J. 2013, 19, 4786–4797; [DOI] [PubMed] [Google Scholar]
- 3b. Porkolab V., Chabrol E., Varga N., Ordanini S., Sutkeviciute I., Thepaut M., Garcia-Jimenez M. J., Girard E., Nieto P. M., Bernardi A., Fieschi F., ACS Chem. Biol. 2018, 13, 600–608. [DOI] [PubMed] [Google Scholar]
- 4.
- 4a. Feinberg H., Mitchell D. A., Drickamer K., Weis W. I., Science 2001, 294, 2163–2166; [DOI] [PubMed] [Google Scholar]
- 4b. Feinberg H., Castelli R., Drickamer K., Seeberger P. H., Weis W. I., J. Biol. Chem. 2006, 282, 4202–4209; [DOI] [PMC free article] [PubMed] [Google Scholar]
- 4c. Angulo J., Díaz I., Reina J. J., Tabarani G., Fieschi F., Rojo J., Nieto P. M., ChemBioChem 2008, 9, 2225–2227. [DOI] [PubMed] [Google Scholar]
- 5.
- 5a. Ng S., Bennett N. J., Schulze J., Gao N., Rademacher C., Derda R., Bioorg. Med. Chem. 2018, 26, 5368–5377; [DOI] [PubMed] [Google Scholar]
- 5b. Aretz J., Anumala U. R., Fuchsberger F. F., Molavi N., Ziebart N., Zhang H., Nazaré M., Rademacher C., J. Am. Chem. Soc. 2018, 140, 14915–14925; [DOI] [PubMed] [Google Scholar]
- 5c. Prost L. R., Grim J. C., Tonelli M., Kiessling L. L., ACS Chem. Biol. 2012, 7, 1603–1608. [DOI] [PMC free article] [PubMed] [Google Scholar]
- 6.
- 6a. Goddard-Borger E. D., Stick R. V., Org. Lett. 2007, 9, 3797–3800; [DOI] [PubMed] [Google Scholar]
- 6b. Fischer N., Goddard-Borger E. D., Greiner R., Klapotke T. M., Skelton B. W., Stierstorfer J., J. Org. Chem. 2012, 77, 1760–1764; [DOI] [PubMed] [Google Scholar]
- 6c. Potter G. T., Jayson G. C., Miller G. J., Gardiner J. M., J. Org. Chem. 2016, 81, 3443–3446. [DOI] [PubMed] [Google Scholar]
- 7.
- 7a. Briner K., Vasella A., Helv. Chim. Acta 1987, 70, 1341–1356; [Google Scholar]
- 7b. Schmidt R. R., Michel J., Roos M., Liebigs Ann. Chem. 1984, 1984, 1343–1357. [Google Scholar]
- 8. Zong G., Liang X., Zhang J., Duan L., Tan W., Wang D., Carbohydr. Res. 2014, 388, 87–93. [DOI] [PubMed] [Google Scholar]
- 9.
- 9a. Rostovtsev V. V., Green L. G., Fokin V. V., Sharpless K. B., Angew. Chem. Int. Ed. 2002, 41, 2596–2599; [DOI] [PubMed] [Google Scholar]; Angew. Chem. 2002, 114, 2708–2711; [Google Scholar]
- 9b. Tornøe C. W., Christensen C., Meldal M., J. Org. Chem. 2002, 67, 3057–3064. [DOI] [PubMed] [Google Scholar]
- 10.
- 10a. Aschwanden P., Stephenson C. R. J., Carreira E. M., Org. Lett. 2006, 8, 2437–2440; [DOI] [PubMed] [Google Scholar]
- 10b. Messina F., Botta M., Corelli F., Schneider M. P., Fazio F., J. Org. Chem. 1999, 64, 3767–3769; [DOI] [PubMed] [Google Scholar]
- 10c. Ma S., Wu B., Jiang X., J. Org. Chem. 2005, 70, 2588–2593; [DOI] [PubMed] [Google Scholar]
- 10d. Detz R. J., Delville M. M. E., Hiemstra H., van Maarseveen J. H., Angew. Chem. Int. Ed. 2008, 47, 3777–3780; [DOI] [PubMed] [Google Scholar]; Angew. Chem. 2008, 120, 3837–3840. [Google Scholar]
- 11.V. Porkolab, C. Pifferi, I. Sutkeviciute, S. Ordanini, M. Taouai, M. Thepaut, C. Vives, M. Benazza, A. Bernardi, O. Renaudet, F. Fieschi, bioRvix 2019, DOI 10.1101/780452. [DOI] [PubMed]
- 12. Aretz J., Baukmann H., Shanina E., Hanske J., Wawrzinek R., Zapol'skii V. A., Seeberger P. H., Kaufmann D. E., Rademacher C., Angew. Chem. Int. Ed. 2017, 56, 7292–7296; [DOI] [PubMed] [Google Scholar]; Angew. Chem. 2017, 129, 7398–7402. [Google Scholar]
- 13. Hanske J., Aleksić S., Ballaschk M., Jurk M., Shanina E., Beerbaum M., Schmieder P., Keller B. G., Rademacher C., J. Am. Chem. Soc. 2016, 138, 12176–12186. [DOI] [PubMed] [Google Scholar]
- 14. Thépaut M., Guzzi C., Sutkeviciute I., Sattin S., Ribeiro-Viana R., Varga N., Chabrol E., Rojo J., Bernardi A., Angulo J., Nieto P. M., Fieschi F., J. Am. Chem. Soc. 2013, 135, 2518–2529. [DOI] [PubMed] [Google Scholar]
- 15. Sutkeviciute I., Thepaut M., Sattin S., Berzi A., McGeagh J., Grudinin S., Weiser J., Le Roy A., Reina J. J., Rojo J., Clerici M., Bernardi A., Ebel C., Fieschi F., ACS Chem. Biol. 2014, 9, 1377–1385. [DOI] [PubMed] [Google Scholar]
- 16.
- 16a. Tabarani G., Reina J. J., Ebel C., Vives C., Lortat-Jacob H., Rojo J., Fieschi F., FEBS Lett. 2006, 580, 2402–2408; [DOI] [PubMed] [Google Scholar]
- 16b. Tabarani G., Thépaut M., Stroebel D., Ebel C., Vives C., Vachette P., Durand D., Fieschi F., J. Biol. Chem. 2009, 284, 21229–21240. [DOI] [PMC free article] [PubMed] [Google Scholar]
- 17. Tomašić T., Hajšek D., Švajger U., Luzar J., Obermajer N., Petit-Haertlein I., Fieschi F., Anderluh M., Eur. J. Med. Chem. 2014, 75, 308–326. [DOI] [PubMed] [Google Scholar]
- 18. Tamburrini A., Achilli S., Vasile F., Sattin S., Vives C., Colombo C., Fieschi F., Bernardi A., Bioorg. Med. Chem. 2017, 25, 5142–5147. [DOI] [PubMed] [Google Scholar]
- 19. Schuck P., Biophys. J. 2000, 78, 1606–1619. [DOI] [PMC free article] [PubMed] [Google Scholar]
- 20. Brautigam C. A., Methods Enzymol. 2015, 562, 109–133. [DOI] [PubMed] [Google Scholar]
- 21. Salvay A. G., Communie G., Ebel C., in Intrinsically Disordered Protein Analysis: Vol. 2 Methods and Experimental Tools (Eds.: V. N. Uversky, A. K. Dunker), Springer, New York, 2012, pp. 91–105. [Google Scholar]
Associated Data
This section collects any data citations, data availability statements, or supplementary materials included in this article.
Supplementary Materials
As a service to our authors and readers, this journal provides supporting information supplied by the authors. Such materials are peer reviewed and may be re‐organized for online delivery, but are not copy‐edited or typeset. Technical support issues arising from supporting information (other than missing files) should be addressed to the authors.
Supplementary


