Figure 1.

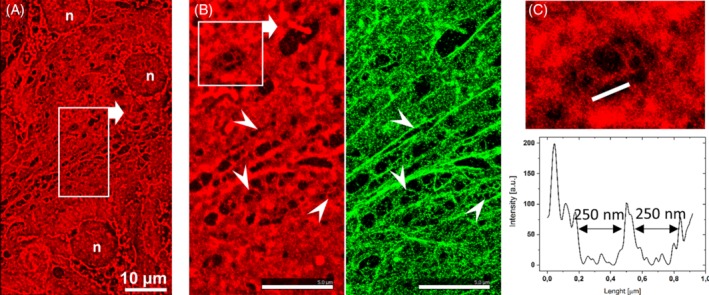
Two‐colored dSTORM images revealing the organization of the LSEC membrane and the localization of Actin. A, A low‐magnification image of the cell membrane (CellMask Deep Red) acquired at the interconnection of a few LSECs. B, Magnification of the area indicated in image A. The cell membrane (CellMask Deep Red, red) and actin (phalloidin‐Atto488, green) are shown. The arrowheads indicate the selected fenestrae that can be distinguished in both channels. C, Magnification of the area indicated in image B for CellMask presenting a single sieve plate with a few fenestrae. The cross section shows the diameters of the selected fenestrae determined based on the intensity of the fluorescence signal
