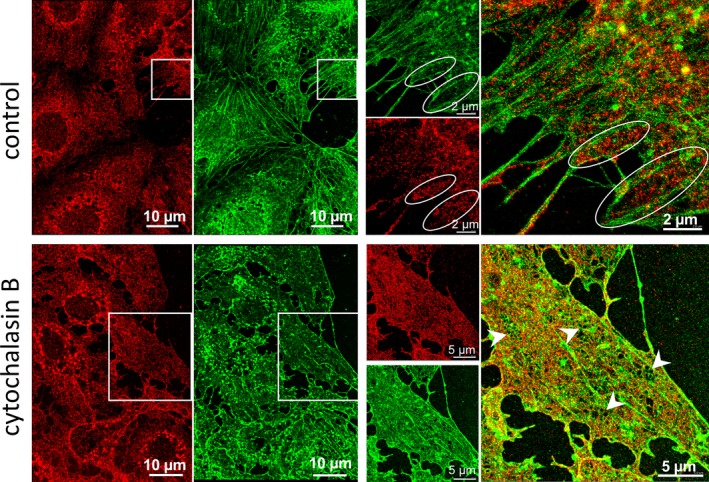
Figure 2.

Two‐colored dSTORM images revealing the organization of actin and spectrin in the LSEC cytoskeleton. Intact control cells (first row) and LSECs treated with 21 μM CB for 30 minutes before fixation (second row). Spectrin (red, spectrin β II Antibody conjugated with Alexa Fluor 647) and actin (green, phalloidin Atto488) distribution at the interconnection of several LSECs are shown in the left panels. The right panels present the magnifications of the selected areas (white squares) where independent and merged channels are shown. In the control samples, the encircled areas indicate sieve plates. The individual fenestrae are identified only in CB‐treated samples in TIRF mode as black (eg, arrowheads)
