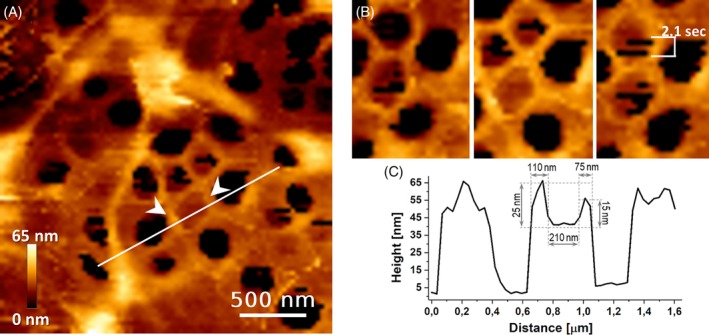
Figure 7.

High‐resolution AFM image on a part of a single‐laying sieve plate within a live LSEC. A, Note, measurements are derived after exposure to 10 μM IAA. B, FACRs (white arrowheads) remained unchanged while the fenestrae changed from an open to closed state. C, The cross section indicated as a white line in A shows elevated FACR surrounding a closed fenestra. Each AFM image/frame took 55 seconds and consisted of 80 × 80 pixels. See Supplementary Animation 1 for the corresponding 18‐minute long video animation
