

Summary
Background
Sunlight contains ultraviolet (UV)A and UVB radiation. UVB is essential for vitamin D synthesis but is the main cause of sunburn and skin cancer. Sunscreen use is advocated to reduce the sun's adverse effects but may compromise vitamin D status.
Objectives
To assess the ability of two intervention sunscreens to inhibit vitamin D synthesis during a week‐long sun holiday.
Methods
The impact of sunscreens on vitamin D status was studied during a 1‐week sun holiday in Tenerife (28° N). Comparisons were made between two formulations, each with a sun protection factor (SPF) of 15. The UVA‐protection factor (PF) was low in one case and high in the other. Healthy Polish volunteers (n = 20 per group) were given the sunscreens and advised on the correct application. Comparisons were also made with discretionary sunscreen use (n = 22) and nonholiday groups (51·8° N, n = 17). Sunscreen use in the intervention groups was measured. Behaviour, UV radiation exposure, clothing cover and sunburn were monitored. Serum 25‐hydroxyvitamin D3 [25(OH)D3] was assessed by high‐performance liquid chromatography–tandem mass spectrometry.
Results
Use of intervention sunscreens was the same (P = 0·60), and both equally inhibited sunburn, which was present in the discretionary use group. There was an increase (P < 0·001) in mean ± SD 25(OH)D3 (28·0 ± 16·5 nmol L−1) in the discretionary use group. The high and low UVA‐PF sunscreen groups showed statistically significant increases (P < 0·001) of 19·0 ± 14·2 and 13·0 ± 11·4 nmol L−1 25(OH)D3, respectively with P = 0·022 for difference between the intervention sunscreens. The nonholiday group showed a fall (P = 0·08) of 2·5 ± 5·6 nmol L−1 25(OH)D3.
Conclusions
Sunscreens may be used to prevent sunburn yet allow vitamin D synthesis. A high UVA‐PF sunscreen enables significantly higher vitamin D synthesis than a low UVA‐PF sunscreen because the former, by default, transmits more UVB than the latter.
What's already known about this topic?
Action spectra (wavelength dependence) for erythema and the cutaneous formation of vitamin D overlap considerably in the ultraviolet (UV)B region.
Theoretically, sunscreens that inhibit erythema should also inhibit vitamin D synthesis.
To date, studies on the inhibitory effects of sunscreens on vitamin D synthesis have given conflicting results, possibly, in part, because people typically apply sunscreen suboptimally.
Many studies have design flaws.
What does this study add?
Sunscreens (sun protection factor, SPF 15) applied at sufficient thickness to inhibit sunburn during a week‐long holiday with a very high UV index still allow a highly significant improvement of serum 25‐hydroxyvitamin D3 concentration.
An SPF 15 formulation with high UVA protection enables better vitamin D synthesis than a low UVA protection product. The former allows more UVB transmission.
Short abstract
Linked Editorial: https://doi.org/10.1111/bjd.18273.
https://doi.org/10.1111/bjd.18492 available online
Terrestrial solar ultraviolet radiation (UVR ~295–400 nm) contains UVB (280–315 nm) and UVA (315–400 nm). The maximal UVB content is ~5% but this region is three to four orders of magnitude more damaging than UVA per unit dose (J m−2) for sunburn,1 potentially mutagenic epidermal DNA lesions, such as cyclobutane pyrimidine dimers (CPDs),1 and keratinocyte cancers.2
However, UVB initiates cutaneous vitamin D3 synthesis. Indeed, most vitamin D (about 80%) is acquired from solar exposure,3 resulting in seasonal variations in temperate climates.3, 4 Vitamin D is essential for skeletal integrity and has been associated with many other health benefits, although these remain controversial5 or disputed.6 It also enhances the repair of epidermal DNA photolesions.7
Solar UVR is responsible for an increasing incidence of melanoma, basal cell carcinoma and squamous cell carcinoma (SCC), particularly in white‐skinned populations,8, 9, 10 for whom sunburn is a risk factor.11, 12 Much public health effort has been spent advising those at risk to minimize solar UVR exposure. The use of sunscreens is one approach, and there is evidence from randomized trials that sunscreens inhibit SCC,13 actinic keratosis (a surrogate risk marker for SCC)14 and melanoma.15 The role of sunscreens in melanoma prevention has also been supported by large population‐based studies.16, 17 However, sunscreen use may impact vitamin D status. Reviews report that different studies reach different conclusions.18, 19 There is a consensus that typical suboptimal sunscreen use probably has a limited effect on vitamin D production.
The sun protection factor (SPF) of a sunscreen is a quantitative measure of its ability to inhibit erythema. Regulatory authorities specify many requirements for SPF determination, one of which is an application thickness of 2 mg cm−2.20 However, people typically apply much less, for example 0·8 mg cm−2, with a commensurate reduction in SPF.21, 22 Furthermore, application is often patchy with, for example, missing facial coverage.23 Additionally, people use sunscreens to prolong their intentional solar exposure time.24, 25
The SPF primarily quantifies protection from UVB, because this waveband is much more erythemogenic than UVA.1 However, regulatory bodies require UVA protection, the definition of which varies with regional domain.20 This UVA protection factor (PF) is typically a qualitative index that describes the spectral profile of the sunscreen. One de facto consequence of increased UVA protection is a decrease in UVB protection for a given SPF. This would be expected to have a beneficial effect on vitamin D synthesis.
Holidays result in a highly significant enhancement of vitamin D3 status in adults26 and children.27 However, this was accompanied with a high level of sunburn in adults in Tenerife.28 In both adults and children there were also very high levels of epidermal CPDs, which are a determining event for skin cancer. Sunscreen use can inhibit CPDs,29 even with very high UVR doses when applied at a typical user application thickness (e.g. 0·75 mg cm−2).30 It is therefore important to determine conditions of sun exposure that maximize benefit and minimize risk.
The primary aim of this investigation was to assess the ability of two sunscreens to inhibit 25‐hydroxyvitamin D3 [25(OH)D3] synthesis during a week‐long sun holiday in Tenerife. The study was designed to compare these sunscreens (intervention groups) under optimal use with typical sunscreen use (discretionary group). The secondary aim was to determine whether the different optical properties of the intervention sunscreen would affect 25(OH)D3 synthesis. This was done by formulating two SPF 15 sunscreens with different levels of UVA protection. The hypothesis under test was that the sunscreen with high UVA‐PF (by default more UVB transmission) would enable better 25(OH)D3 synthesis than the product with low UVA‐PF. We have previously reported that sunscreen intervention in the same participants inhibited erythema. In contrast, there was marked erythema with discretionary sunscreen use.31
Patients and methods
The study was approved by the Ethics Committee of the Medical University of Łódź, Poland and done according to the Declaration of Helsinki. All participants (n = 79) gave written informed consent. Most were of Fitzpatrick skin type (FST) II and III.32 The group demographics and study locations are summarized in Tables 1 and 2. Briefly, three groups of holidaymakers from Łódź, Poland, spent a week during March 2011 in Tenerife (28° N) with cloudless weather at a maximum UV index (UVI) of 9, which is classified as very high by the World Health Organization.33 Sunscreen intervention groups A and B (each n = 20) were given three ~50‐g tubes of SPF 15 sunscreens daily with high or low UVA‐PF, respectively.31 Participants were instructed how to apply the sunscreens to achieve their labelled SPF, and to use one tube in the morning, one mid‐day and one in the afternoon.
Table 1.
Summary of study locations, sunscreen use, age and body surface area
| Group | A | B | C | D | All | Main conclusions from between‐group comparisons |
|---|---|---|---|---|---|---|
| Location | Tenerife | Tenerife | Tenerife | Łódź | NA | |
| Sunscreen use | High UVA‐PF (label SPF 15) | Low UVA‐PF (label SPF 15) | Discretionary | None | NA | |
| No. participants | 20 | 20 | 22 | 17 | 79 | |
| Age (years), mean ± SD | 33 ± 7 | 38 ± 7 | 33 ± 8 | 34 ± 9 | 34 ± 8 | No age differences (P = 0·20), but B older than C (P = 0·047; anova and post hoc) |
| BSA (m2), mean ± SD | 1·81 ± 0·23 | 1·90 ± 0·25 | 1.81 ± 0.16 | 1.74 ± 0.12 | 1·82 ± 0·20 | No BSA differences for M, F and M + F (P > 0·1, anova) |
Fuller details of all aspects apart from vitamin D status are described in Narbutt et al.31 As previously reported,31 all nonvitamin D parameters were normally distributed. Values are mean ± SD. BSA, body surface area; F, female; M, male; NA, not applicable; PF, protection factor; SPF, sun protection factor.
Table 2.
Summary of skin type and sex of participants
| Group | A | B | C | D | All | Main conclusions from between‐group comparisons |
|---|---|---|---|---|---|---|
| II | 13 | 12 | 15 | 7 | 47 | Significant skin type difference in all groups (P = 0·047) but lost without control group D (P = 0.16, χ2‐test) |
| III | 7 | 8 | 5 | 10 | 30 | |
| IV | 0 | 0 | 2 | 0 | 2 | |
| Male | 8 | 11 | 8 | 2 | 29 | No sex difference in all groups (P = 0·057) or holiday groups only (P = 0·53, χ2‐test) |
| Female | 12 | 9 | 14 | 15 | 50 |
Sun‐exposure behaviour was monitored half‐hourly in diaries,34, 35 which included clothing cover to estimate the percentage body surface area (BSA) exposed. The time of sunscreen application was monitored, and application thickness was estimated (by weighing tubes before and after use) in cases when the first application per tube was on 85% BSA exposed (i.e. in swimwear). Participants with discretionary use of sunscreen, group C (n = 22), were instructed to bring their own sunscreens to use as normal. No instructions were given, and use was not monitored. Control group D (n = 17) remained in Łódź (51·8° N). The allocation of individuals to the four groups depended on several factors. Group C agreed to invasive procedures, which have previously been reported,31 and group D was unwilling or unable to travel. Groups A and B were randomized as room‐sharing pairs by being sequentially allocated to sunscreen A or B as they entered the study. Pairs were given the same sunscreen to avoid inadvertent mixing of product.
The full details of the holiday, participants, sunscreens, personal UVR exposures and sunburn have been previously published.31 Briefly, standard erythema doses (SEDs)35 were measured using personal wrist‐worn electronic dosimeters and erythema was assessed at the end of each day by reflectance spectroscopy on five exposed body sites.
Assessment of 25‐hydroxyvitamin D
Serum samples from groups A, B and C were prepared from blood taken 24 h before and 24–48 h after the holiday. The bloods from control group D were taken at the same times. All samples were stored at –80 °C. 25(OH)D3 was analysed by high‐performance liquid chromatography–tandem mass spectrometry by two independent laboratories. One was the Department of Clinical Chemistry, Birmingham City Hospital (BCH), Sandwell and Birmingham Hospitals NHS Trust, Birmingham, U.K. BCH is a U.K. Clinical Pathology Accreditation laboratory and a member of the Vitamin D External Quality Assessment scheme.36 The other was the Department of Dermatology, Bispebjerg Hospital,37 Copenhagen University Hospital, Copenhagen, Denmark. Pre‐ and postsamples (n = 158) from a given individual were analysed in the same batch. BCH and Bispebjerg Hospital ran two and three aliquots from each sample, respectively, and means from each laboratory were used. In theory, the double laboratory analysis gave data from 316 runs, but in practice this was 307 (97%) because nine aliquots could not be analysed for technical reasons; however, all participants provided data from at least one pre‐ and postsample. BCH also assessed 25(OH)D2.
Statistics
Sample sizes were based on a previous study of 50 adults under controlled laboratory conditions using nonsolar UVB with changes in 25(OH)D3 as the end point.37 Sixteen people completing the study were deemed sufficient to detect a mean ± SD of Δ23·3 ± 26·5 nmol L−1 25(OH)D3 using a paired design (i.e. preholiday vs. postholiday) with a significance level of 5% and 90% power. This was calculated by Power and Sample Size Calculation version 3·1·2 (http://biostat.mc.vanderbilt.edu/wiki/Main/PowerSampleSize). The larger sample sizes of those in Tenerife (20–22) allowed some leeway for the less‐controlled conditions of ‘real‐life’ solar UVR behaviour and the possibility of dropouts. SPSS software v22 (IBM Corp., Armonk, NY, U.S.A.) was used for the data analysis. Normality was determined by the Kolmogorov–Smirnov test, and the Bland–Altman test was used to assess the difference between the 25(OH)D3 assessment in the two laboratories. The relationship between the two laboratories was determined by linear regression. Comparisons between the treatment groups were made by anova with post hoc tests where necessary. This adjusts for baseline 25(OH)D because this influences UVR response.37 Pre‐ and postholiday comparisons within the same individuals were made by paired t‐tests. Group differences of categorical data were analysed by the χ2‐test. The significance value was set at P < 0·05 and all tests were two‐sided. Analyses were also made of total 25(OH)D (i.e. D2 and D3 combined).
Results
All nonvitamin D parameters have been previously reported31 and were normally distributed. There was no overall difference in age between the groups (P = 0·20, anova), but the sunscreen B group was just significantly older (mean ± SD, 4·8 ± 2·4 years) than the discretionary sunscreen group C (P = 0·047, post hoc test). The BSA and mean sunscreen application thicknesses of the intervention sunscreens are given in Tables 1 and 3. There was no difference (P > 0·1) in BSA between any of the groups (male, female and male + female participants), although this was significantly greater in male participants. There was no difference in the amount of sunscreen applied in the intervention groups (P = 0·60), based on the first application from each tube over 85% BSA. The participants had FST II (60%), III (38%) and IV (3%). There was a borderline significant difference in skin type between all groups (P = 0·047), which was lost when the control group was excluded (P = 0·15). Erythema, quantified by area under the curve with time, showed virtually no change in both sunscreen intervention groups, and no difference between these groups (P ≥ 0·36), but was marked in the discretionary sunscreen use group. The differences were highly significant (P < 0·001), showing that the sunscreen interventions inhibited erythema.
Table 3.
Summary of actual sun protection factor (SPF), sunscreen application, ultraviolet radiation (UVR) exposure, erythema and 25‐dihydroxyvitamin D3 [25(OH)D3] and study results
| Group | A | B | C | D | All | Main conclusions from between‐group comparisons |
|---|---|---|---|---|---|---|
| Actual SPF, mean ± SD | 18·9 ± 2·8 | 17·7 ± 2·7 | ND | NA | NA | No difference between SPF in A and B (P = 0·7, unpaired t‐test) |
| Sunscreen application thickness (mg cm−2), mean ± SD | 2·43 ± 0·55 | 2·44 ± 0·48 | ND | NA | NA | No difference in sunscreen application thickness in groups A and B (P = 0·6, unpaired t‐test) |
| UVR exposure (SED), mean ± SD | 41·0 ± 13·6 | 38·6 ± 15·4 | 49·4 ± 18·4 | 1·9 ± 3·4 | 43·2 ± 16·5a | No SED difference in A, B and C (P = 0·08, anova) |
| Hours outside, mean ± SD | 39·5 ± 6·5 | 38·0 ± 6·4 | 46·7 ± 10·0 | 3·7 ± 3·9 | 41·6 ± 8·7a | No differences in A and B (P = 1·0), but group C had more time outdoors than A or B (P ≤ 0·014; anova and post hoc) |
| Erythema (reflectance spectroscopy)31 | No | No | Yes | NA | NA | No differences in A and B on five exposed body sites (P ≥ 0·36), but C had more erythema than A and B (P < 0·001; anova and post hoc) |
|
Preholiday 25(OH)D3 (nmol L−1), mean ± SD |
67·0 ± 31·5 | 59·0 ± 24·5 | 59·9 ± 24·7 | 47·9 ± 23·8 | 58·9 ± 26·7 | No baseline 25(OH)D3 differences in A, B, C and D (P = 0·19), but A > D (P = 0·031; anova and post hoc) |
|
Postholiday 25(OH)D3 (nmol L−1), mean ± SD |
85·9 ± 25·3 | 72·0 ± 21·5 | 88·0 ± 20·4 | 45·4 ± 20·9 | NA | With baseline adjustment, A, B and C higher 25(OH)D3 than D (P < 0·001), C higher than B (P < 0·001) and A (P = 0·037) and A higher than B (P = 0·022; anova and post hoc) |
| Δ25(OH)D3 (nmol L−1) | 19·0 ± 14·2 | 13·0 ± 11·4 | 28·0 ± 16·5 | –2·5 ± 5·6 | NA | With baseline adjustment, A, B and C higher 25(OH)D3 than D (P < 0·001), C higher than B (P < 0·001) and A (P = 0·037) and A higher than B (P = 0·022; anova and post hoc) |
| P‐values for pre‐ and postholiday changes in 25(OH)D3 | < 0·001 | < 0·001 | < 0·001 | 0·087 | NA | NA |
| Preholiday % < 50 nmol L−1 25(OH)D3 | 30 | 35 | 32 | 71 | 41 | High % with < 50 nmol L−1 25(OH)D3, particularly in group D |
| Postholiday % < 50 nmol L−1 25(OH)D3 | 0 | 15 | 5 | 65 | NA | A reduction in % with < 50 nmol L−1 25(OH)D3 in holiday groups |
Fuller details of all aspects apart from vitamin D status are described in Narbutt et al.31 As previously reported,31 all nonvitamin D parameters were normally distributed, as are pre‐ and postholiday 25(OH)D3 and the differences between them. The addition of the 25(OH)D2 data (Fig. S1; see Supporting Information) increases the combined means from ~4 to 6 nmol L−1. Note that the data on sunscreen application thickness are based on the first application from each tube to 85% of body surface area and that the group D exposure data are based on 13 of 17 volunteers from whom there was a full 7‐day dataset. Values are mean ± SD. ND, no data; NA, not applicable; SED, standard erythema dose; SPF, sun protection factor. aExcludes group D.
Ultraviolet radiation exposure
Figure 1(a) shows the mean daily ambient UVR exposure and the exposure profiles of the holiday groups that obtained 13–17% of ambient exposure. The mean cumulative SED exposures in the three groups (Table 3) were not significantly different from each other (P = 0·08). The mean cumulative exposure of the groups combined was 43·2 ± 16·5 SED, which is equivalent to ~18 and ~11 minimal erythema doses (MEDs) in FST II and III, respectively.38 However, there was a difference in the number of hours outside (P = 0·02) (Table 3). Post hoc multiple comparisons of hours outside showed no differences between the two sunscreen intervention groups (~5 h 30 min daily, P = 1·0), each of which had significantly fewer hours of exposure than the discretionary use group (~6 h 40 min daily, P ≤ 0·014). The mean cumulative exposure in the control group was 1·9 ± 3·4 SED, which is < 1 MED, irrespectively of FST.
Figure 1.
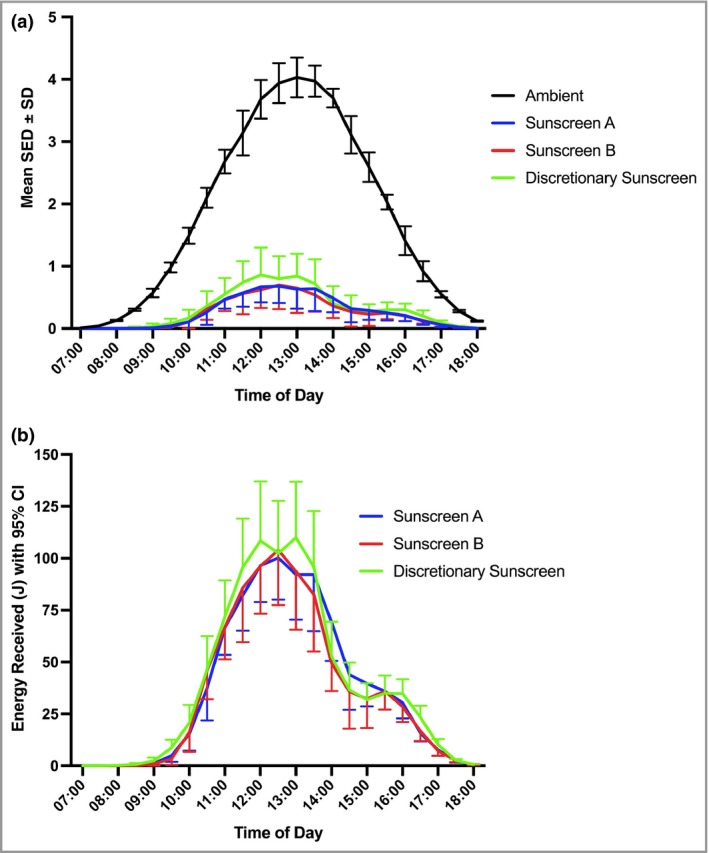
Solar ultraviolet radiation exposure during the 7‐day holiday in Tenerife. (a) Mean half‐hourly ambient and study group exposure [standard erythema doses (SEDs) per 0·5 h]. Groups A, B (sunscreen intervention) and C (discretionary sunscreen use) received 14% [95% confidence interval (CI) 11–17], 13% (95% CI 10–16) and 17% (95% CI 14–20) of ambient, respectively (based on area under the curve). (b) Erythemally effective energy (J) received at the skin surface. This is the product of SED (expressed as 100 J m−2) and body surface area (m2) exposed each 30 min in groups A, B and C. The individual data are shown in Figure S2 (see Supporting Information).
Body surface area exposed, sunscreen transmittance properties and application, and erythema assessments
We have previously shown a relationship between holiday UVB dose and production of 25(OH)D3 after adjustment for amount of BSA exposed.26 In effect, this is a product of exposed BSA and SED. Thus, Figure 1(b) shows the half‐hourly product of BSA exposed (m2) × SED (100 J m−2) to give the total energy received (J) at the skin surface. There was no significant difference between the three holiday groups (P = 0·75, anova) using individual area under the curve as the outcome. The individual data (Fig. S2; see Supporting Information) show a very wide range of individual behavioural patterns.
The UVR transmittance spectra of the sunscreens are shown in Figure 2; the inset shows that high UVA‐PF sunscreen (group A) transmitted ~20% more UVB than the low UVA‐PF sunscreen (group B).
Figure 2.
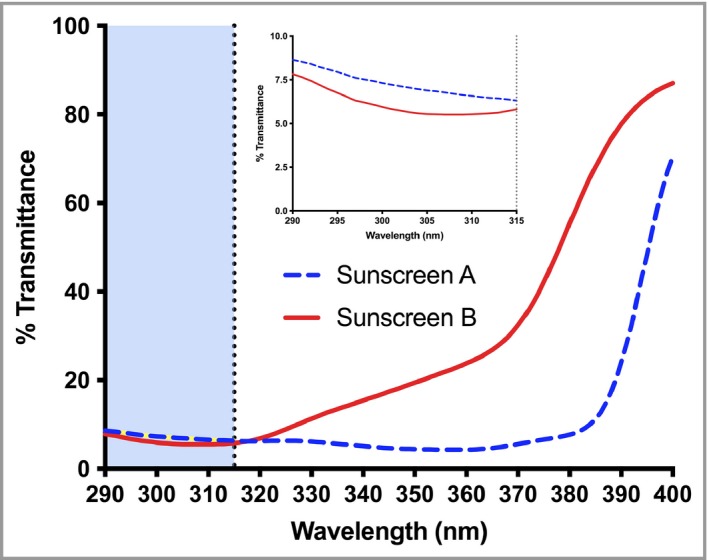
Ultraviolet radiation (UVR) transmittance of the two intervention sunscreens. For full details of sunscreen properties, including UVR absorption properties (as monochromatic protection factors) see Narbutt et al.31 The inset shows the transmittance in the UVB region. Based on area under the curve, sunscreen A (with high UVA‐protection factor) transmits ~20% more UVB than sunscreen B (with low UVA‐protection factor).
25‐Hydroxyvitamin D2 and D3, and total 25‐hydroxyvitamin D
The values of 25(OH)D2 were low with the means ranging from 3·5 to 5·6 nmol L−1. All 25(OH)D2 data were normally distributed (P > 0·15) apart from preholiday sunscreen A (P = 0·022). In 26 of the 158 pre‐ and postsamples (16·5%), both aliquot runs were at the limit of detection (2·8 nmol L−1). The pre‐ and postholiday 25(OH)D2 results are given in Figure S1 (see Supporting Information), with additional statistical information in the figure legend. There was no significant difference between pre‐ and postholiday samples for the control and sunscreen A and B groups (P > 0·09). However, the postholiday value was lower in the discretionary sunscreen group C (P = 0·003).
The Bland–Altman test (Fig. S3; see Supporting Information) showed a significant (P < 0·001) systematic mean difference of 7·3 nmol L−1 25(OH)D3 (95% confidence interval 5·9–8·8) between the two laboratories. The interlaboratory results were compared by linear regression (Fig. 3) to give an equation of y = 1·01x + 6·73 (95% confidence interval of slope 0·96–1·06 and intercept 3·06–10·40) with r 2 = 0·91 and slope P < 0·001. A slope of 1·01 means there is no laboratory bias for the Δ values (i.e. postholiday – preholiday). Thus, given the excellent correlation, the mean values from the two laboratories were used in the statistical analyses. Data from a single laboratory were used in the nine missing cases.
Figure 3.
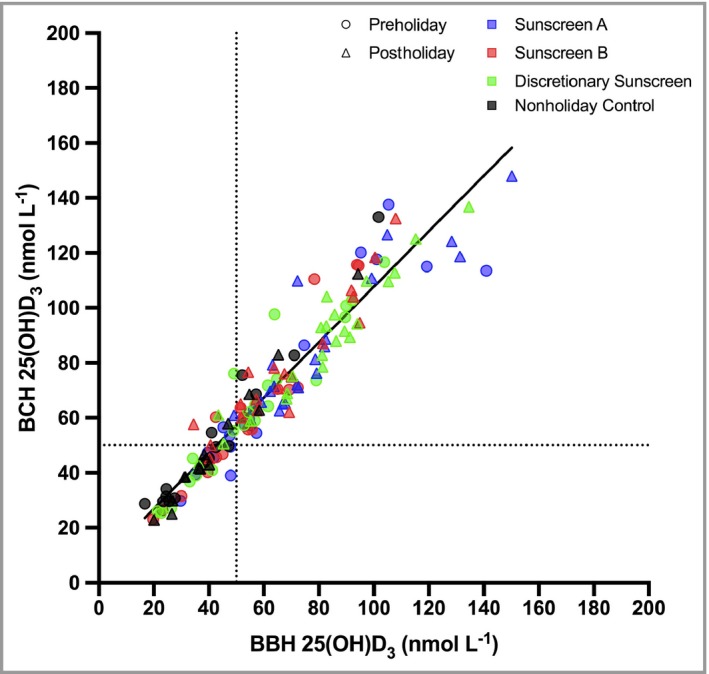
Linear relationship between 25(OH)D3 measurements from two independent laboratories. The linear regression (n = 149) equation is y = 1·01(± 0·03)x + 6·73(± 1·86) and the slope is highly significant (P < 0·001) with r 2 = 0·91. Errors are SE. The intercept is consistent with the Bland–Altman test (Fig. S3; see Supporting Information). Colour squares refer to study group and the shapes (Ο and Δ) refer to pre‐ and postholiday, respectively; dotted lines represent the 50 nmol L−1 boundary between vitamin D3 insufficiency and sufficiency. 25(OH)D3, 25‐hydroxyvitamin D3; BBH, Bispebjerg Hospital; BCH, Birmingham City Hospital.
Analyses were done for 25(OH)D3 and total 25(OH)D. Pre‐, postholiday and Δ25(OH)D3 were normally distributed (P > 0·31 with the exception of the preholiday sunscreen A group with P = 0·054). All total 25(OH)D data (preholiday, postholiday and Δ) were also normally distributed (P > 0·27) except for sunscreen A preholiday (P = 0·054).
The 25(OH)D3 results are shown in Table 3. The overall mean baseline (preholiday) 25(OH)D3 value was 58·9 ± 26·7 nmol L−1. There was no significant difference (P = 0·19, anova) between the baseline 25(OH)D3 values of any group, or for total 25(OH)D (P = 0·22, anova). However, post hoc analysis showed there was a significant difference between the baseline 25(OH)D3 of groups D and A of P = 0·031 [P = 0·041 for total 25(OH)D]; importantly, such analyses showed no differences between the three holiday groups (P ≥ 0·34).
Table 3 also shows a nonsignificant decline of 25(OH)D3 for the Łódź control group during the study, but highly significant postholiday increases in all Tenerife groups. The ranking of this increase is discretionary (group C) > high UVA‐PF sunscreen (group A) > low UVA‐PF sunscreen (group B).
anova showed a highly significant (P < 0·001) difference between the poststudy 25(OH)D3 values for the four groups [P < 0·001 for total 25(OH)D], after adjustment for prelevel (baseline), and differences between the groups were tested by post hoc analyses. The greatest differences [for 25(OH)D3 and total 25(OH)D] were between the Łódź control and the three Tenerife groups with P < 0·001. The poststudy value in the discretionary sunscreen group was greater than the low UVA‐PF [P < 0·001 for both 25(OH)D3 and total 25(OH)D] and high UVA‐PF [P = 0·037 for 25(OH)D3 and P = 0·068 for total 25(OH)D] sunscreen groups, and the increase in the latter was significantly greater [P = 0·022 for 25(OH)D3 and P = 0·025 for total 25(OH)D] than the former. The baseline adjusted postholiday group differences for 25(OH)D3 are C > A by 7·2 ± 3·4 nmol L−1 (mean ± SEM), C > B by 15·3 ± 3·4 nmol L−1 and A > B by 8·1 ± 3·5 nmol L−1 (note same P‐values as above). The latter comparison supports the hypothesis of the secondary aim, which is that better vitamin D synthesis would occur with the sunscreen that transmitted more UVB.
Table 3 shows the percentage with 25(OH)D3 > 50 nmol L−1 (D3 sufficiency) in each study group before and after the holiday. In all holiday groups, this percentage was reduced and the 25(OH)D3 level increased in all individuals. The sunscreen B group had three volunteers with a postholiday 25(OH)D3 level < 50 nmol L−1, two of whom had 25(OH)D < 25 nmol L−1 preholiday. Only one person remained insufficient in the discretionary sunscreen group but increased from 39·7 to 48 nmol L−1. The Łódź control group D had a much higher preholiday percentage of insufficiency.
There was no relationship seen between age and postholiday 25(OH)D3 (with correction for baseline) for all groups combined (P = 0·53) and for the individual groups (P = 0·53–0·96). There was also no significant correlation between age and preholiday, postholiday or Δ25(OH)D3 values and total 25(OH)D (P > 0·23 all four groups, P > 0·19 holiday groups, P > 0·40 individual groups), or any significant effect of sex on vitamin D markers in holiday groups [P = 0·73 for 25(OH)D3 values and 0·79 for total 25(OH)D]. There was also no relationship between duration of solar exposure and postholiday vitamin D markers (with correction for baseline) for all holiday groups combined [P = 0·23 for 25(OH)D3 and P = 0·30 for total 25(OH)D] or for the individual holiday groups [P = 0·53–0·68 for 25(OH)D3 and P = 0·52–0·67 for total 25(OH)D].
Discussion
Holidays contribute substantially to UVR burden.39, 40 Over 5·5 million northern Europeans visited the Canary Islands in 2017,41 the latitude of which is comparable with the U.S. holiday destination of Florida. Sunscreens are important for photoprotection, but concerns about their possible inhibitory effects on vitamin D3 production have been largely based on laboratory studies with inappropriate UVB phototherapy sources that contain short‐wave nonsolar UVB, which is very effective at forming previtamin D3,42 or theoretical calculations.43 In contrast, we studied sunscreen use under holiday conditions with excellent weather. Furthermore, the study was designed to test the possible inhibitory effect of sunscreens on vitamin D3 synthesis under optimal conditions of use.
The study participants received an overall mean ± SD of 43·2 ± 16·5 SED (range 12–93) that was 13–17% ambient erythemal UVR. It has been estimated that an indoor worker in northern Europe receives ~150 SED annually on the face.40 The SED measurements were made on the wrist, but studies have shown that this is ~50% of the facial dose,44 although this depends on behaviour. Without any body site adjustment, the wrist data confirm that a very high fraction of annual UVR exposure (~30%) can be obtained in a 1‐week sun holiday in spring. Many northern Europeans take summer holidays, in which case the doses are probably considerably higher.
In a previous Tenerife study, in March 2010, we reported that Danes (n = 25) obtained a total of 57·0 ± 24·7 SED (range 21–115) over 6 days, which represented ~43% of their annual solar UVR burden.34 This is a higher value than in the current study and may be because sun seekers were specifically targeted during the recruitment of the Danes. Overall, these data from Tenerife support studies that estimate that a high fraction of annual UVR burden is received during sunny holidays.40 Such exposure, particularly if associated with sunburn, is probably an important risk factor for skin cancer.11, 12
There was no difference in cumulative SED between the three holiday groups, although the discretionary sunscreen use group spent significantly more time outdoors (~1 h per day) than the intervention groups. However, this additional time had no effect on any of the vitamin D outcomes. This is not surprising because photochemical reactions limit the production of previtamin D3 after ~3 h, which in turn limits the production of 25(OH)D3.45 Measurements on the same participants31 showed that sunscreens A and B equally and significantly inhibited erythema, on five exposed body sites, in comparison with the discretionary sunscreen group C, which had marked erythema. Importantly, because the amount of BSA exposed affects serum 25(OH)D3,46 there was no significant difference between the product of BSA exposed and SED. Thus, we may conclude that the overall patterns of UVR exposure of the three holiday groups were the same. The contemporaneous control group had very low UVR exposures in Poland, where the mean ± SD temperature was 5·8 ± 4·1 °C with a maximum UVI of 2–3.
There was no significant difference between the baseline 25(OH)D3 in any of the groups, with an overall mean ± SD (n = 79) of 58·9 ± 26·7 nmol L−1, even though the sunscreen A group had a 19·1 ± 8·7 nmol L−1 higher 25(OH)D3 than the Łódź control group D. At least 50 nmol L−1 total 25(OH)D is regarded as sufficient by the Institute of Medicine, though different organizations use different levels for sufficiency.47 The negative control group declined insignificantly by 2·5 ± 5·6 nmol L−1 25(OH)D3, which is indicative of the gradual loss of UVB‐induced vitamin D3 reserves acquired in summer. It should be noted that food is not vitamin D fortified in Poland.
There was a highly significant increase of 25(OH)D3 in all three holiday groups, which was greatest in the discretionary sunscreen use group (28·0 ± 16·5 nmol L−1), which showed sunburn.31 We have previously reported a mean increase of 21·5 nmol L−1 25(OH)D3 after a mean cumulative exposure of 57·0 SED over 50% BSA48 in a 6‐day study of sun‐worshipping Danes in Tenerife during March 2010.26 All participants had sunburn28 despite discretionary sunscreen use.34
The increase in 25(OH)D3 was significantly greater with high compared with low UVA‐PF (19·0 ± 14·2 vs. 13·0 ± 11·4 nmol L−1), which is a consequence of greater UVB transmittance through the high UVA‐PF sunscreen (see Fig. 2). The percentage with > 50 nmol L−1 (vitamin D3 sufficiency) was reduced in all groups postholiday (Table 3). There was increased 25(OH)D3 in all individuals, although three in the sunscreen group B and one in the discretionary sunscreen use group C did not reach sufficiency postholiday [i.e. 25(OH)D3 < 50 nmol L−1]. The higher preholiday percentage of insufficiency in the Łódź control group D may reflect its sun‐behaviour habits as members chose not to travel.
Based on measurements from 21 tubes per person,31 the intervention sunscreens were applied at a mean thickness of 2·4 mg cm−2, resulting in SPFs of at least 15. Thus, assuming a constant level of protection, the average cumulative UVR dose received through the sunscreen was ~40/15 (SPF) = 2·7 SED (or ~0·4 SED per day). This results in an increase of 7·0 and 4·8 nmol L−1 25(OH)D3 per SED through the high and low UVA‐PF sunscreens, respectively. A recent study, with an acute exposure of fluorescent solar‐simulated radiation over 35% BSA, showed an estimated increase of ~3 and ~2·5 nmol L−1 per SED in people of FST II and III, respectively (L. Rhodes, personal communication).49 These results are compatible with ours given that the relationships between 25(OH)D3 synthesis and UVR dose and the BSA exposed are complex.46 It was not possible to estimate the doses received by the discretionary sunscreen use group C.
Overall, the conclusions from the group comparisons of 25(OH)D3 and total 25(OH)D were the same with one exception: the significance of the greater increase in the discretionary use (group C) over high UVA‐PF sunscreen (group A) was lost when the total 25(OH)D was used. As previously reported by others in adults50 the levels of 25(OH)D2 were very low. Pre‐ vs. postholiday 25(OH)D2 did not change apart from a fall in group C, which had the greatest increase in 25(OH)D3. It is possible that 25(OH)D2 and 25(OH)D3 interact with each other, but this would require additional study.
Several laboratory studies have compared the protection from UVR‐induced epidermal and dermal damage after the application of high vs. low UVA protection, for a given SPF.51, 52, 53 These investigations demonstrate the benefits from better UVA protection. To the best of our knowledge, this is the first time that higher UVA protection, for a given SPF, has been shown to be beneficial for vitamin D synthesis. Apart from biological benefits from increased UVA protection, the labelled SPF is a much more robust indicator of protection with a broad‐spectrum product.54 This is because solar UVB content, which varies considerably with the height of the sun, is a major determinant of SPF with low UVA‐PF. Furthermore, high UVA protection is probably advantageous because there is increasing evidence that UVA, particularly UVA1 (340–400 nm), may be more harmful than previously thought.55 For example, the basal layer of the epidermis, which contains melanocytes and proliferating keratinocytes, is particularly susceptible to UVA1‐induced DNA damage.56 UVA may cause oxidative damage to DNA repair proteins.57 There are also epidemiological data to suggest that solar UVA may be more important for melanoma in comparison with keratinocyte cancers.58, 59 However, we lack definitive data for the action spectrum of melanoma in mammalian skin.
One strength of this investigation is that it was done under ‘real‐life’ holiday conditions during a week of cloudless weather with very high UVI. Furthermore, there was no difference in cumulative SED exposure between the groups, including after adjustment for the exposed BSA. Another strength is that the measurements for the high‐performance liquid chromatography–tandem mass spectrometry study of 25(OH)D3 were independently assessed in two laboratories, including a Vitamin D External Quality Assessment Scheme laboratory, with excellent interlaboratory agreement. A major concern of many vitamin D studies is lack of standardization of measurements.36, 60 One weakness of the study was that the participants were not fully randomized, which was not possible for practical and logistical reasons. However, the baseline and demographic characteristics of the study groups were not significantly different from each other except that sunscreen group B, which has the smallest increase in 25(OHD)3, was older than the other groups. This difference was of borderline significance and had no effect on any of the vitamin D outcomes. However, it should be noted that vitamin D synthesis decreases with age.61 Another weakness is the lack of data on sunscreen use in the discretionary group C, but collecting such data might have altered sunscreen application behaviour, the so‐called Hawthorn effect.62 Our goal was to compare optimal with typical holiday sunscreen use (e.g. 0·79 mg cm−2).22 This is important because laboratory studies, with a UVB phototherapy source, have shown that sunscreen application thickness has an impact of serum 25(OH)D3.63
In conclusion, there was an increase of 25(OH)D3 during a week of cloudless weather with very high UVI, even when sunscreens were used to achieve their labelled SPFs and inhibit sunburn. We estimate that the measured increases of 25(OH)D3 occur with ~0·4 SED per day through the sunscreens, which is equivalent to ~0·1 MED per day in fair‐skinned people. Although labelled as SPF 15, the products used in the current study were in the region of SPF 18–19. A sunscreen with SPF 50+ (mean ± SD 64 ± 15·8) used at 0·75 mg cm−2 has an SPF of 20·9 ± 3·3.30 This means that typical use of high SPF sunscreens probably has a limited impact on vitamin D synthesis. However, the use of high SPF sunscreens in a way that achieves their labelled SPF may have an impact on vitamin D synthesis, but this needs to be tested under field conditions. There is interaction between the BSA exposed and UVR dose46 and this is probably complicated by the addition of sunscreens.
Significantly more 25(OH)D3 synthesis occurred with a high UVA‐PF (broad‐spectrum) sunscreen when compared with a low UVA‐PF sunscreen for a given SPF. This is what would be expected based on the action spectrum for previtamin D3 and the optical properties of the sunscreens. Thus, sunscreens can be designed to optimize the balance between the adverse and beneficial effects of solar UVR exposure as suggested by theoretical calculations.64 Our data support the use of sunscreens to prevent adverse effects of UVR, without compromising vitamin D synthesis. This is in agreement with the conclusions of two recent reviews of a wide range of different types of studies on the effect of sunscreen use on vitamin D synthesis.65, 66
Supporting information
Fig S1. Mean serum 25‐hydroxyvitamin D2 [25(OH)D2] status pre‐ and postholiday for all groups.
Fig S2. Erythemally effective energy (J) received at skin surface.
Fig S3. Bland–Altman plot of serum 25‐hydroxyvitamin D3 [25(OH)D3] measured in two laboratories.
Acknowledgments
We wish to thank Professor Mary Norval for scientific advice during the project and thank Dr Margarita Triguero‐Mas (Centre for Research in Environmental Epidemiology, Barcelona, Spain) for study logistics support.
Funding sources The European Commission, under the Framework 7 Programme Environment Theme, funded the research (contract no. 227020: The Impact of Climate and Environmental Factors on Personal Ultraviolet Radiation Exposure and Human Health). Walgreens Boots Alliance Inc. supported the sunscreen intervention studies and formulated the sunscreens. The research was also funded by the Medical University of Łódź, Poland (research project number 503/5‐064‐01/503‐01) and the National Institute for Health Research (NIHR) Biomedical Research Centre based at Guy's and St Thomas’ NHS Foundation Trust and King's College London.
Conflicts of interest M.B. and C.O'C. are employed by Walgreens Boots Alliance Inc. All of the other authors have none to declare.
A.R.Y. and J.N. share first authorship.
https://doi.org/10.1111/bjd.18492 available online
References
- 1. Young AR, Chadwick CA, Harrison GI et al The similarity of action spectra for thymine dimers in human epidermis and erythema suggests that DNA is the chromophore for erythema. J Invest Dermatol 1998; 111:982–8. [DOI] [PubMed] [Google Scholar]
- 2. de Gruijl FR, Sterenborg HJ, Forbes PD et al Wavelength dependence of skin cancer induction by ultraviolet irradiation of albino hairless mice. Cancer Res 1993; 53:53–60. [PubMed] [Google Scholar]
- 3. Macdonald HM, Mavroeidi A, Fraser WD et al Sunlight and dietary contributions to the seasonal vitamin D status of cohorts of healthy postmenopausal women living at northerly latitudes: a major cause for concern? Osteoporos Int 2011; 22:2461–72. [DOI] [PubMed] [Google Scholar]
- 4. Kasahara AK, Singh RJ, Noymer A. Vitamin D (25OHD) serum seasonality in the United States. PLOS ONE 2013; 8:e65785. [DOI] [PMC free article] [PubMed] [Google Scholar]
- 5. Autier P, Mullie P, Macacu A et al Effect of vitamin D supplementation on non‐skeletal disorders: a systematic review of meta‐analyses and randomised trials. Lancet Diabetes Endocrinol 2017; 5:986–1004. [DOI] [PubMed] [Google Scholar]
- 6. Manson JE, Cook NR, Lee IM et al Vitamin D supplements and prevention of cancer and cardiovascular disease. N Engl J Med 2019; 380:33–44. [DOI] [PMC free article] [PubMed] [Google Scholar]
- 7. Dixon KM, Tongkao‐On W, Sequeira VB et al Vitamin D and death by sunshine. Int J Mol Sci 2013; 14:1964–77. [DOI] [PMC free article] [PubMed] [Google Scholar]
- 8. Lomas A, Leonardi‐Bee J, Bath‐Hextall F. A systematic review of worldwide incidence of nonmelanoma skin cancer. Br J Dermatol 2012; 166:1069–80. [DOI] [PubMed] [Google Scholar]
- 9. Lens MB, Dawes M. Global perspectives of contemporary epidemiological trends of cutaneous malignant melanoma. Br J Dermatol 2004; 150:179–85. [DOI] [PubMed] [Google Scholar]
- 10. Whiteman DC, Green AC, Olsen CM. The growing burden of invasive melanoma: projections of incidence rates and numbers of new cases in six susceptible populations through 2031. J Invest Dermatol 2016; 136:1161–71. [DOI] [PubMed] [Google Scholar]
- 11. Wu S, Cho E, Li WQ et al History of severe sunburn and risk of skin cancer among women and men in 2 prospective cohort studies. Am J Epidemiol 2016; 183:824–33. [DOI] [PMC free article] [PubMed] [Google Scholar]
- 12. Wu S, Han J, Laden F et al Long‐term ultraviolet flux, other potential risk factors, and skin cancer risk: a cohort study. Cancer Epidemiol Biomarkers Prev 2014; 23:1080–9. [DOI] [PMC free article] [PubMed] [Google Scholar]
- 13. van der Pols JC, Williams GM, Pandeya N et al Prolonged prevention of squamous cell carcinoma of the skin by regular sunscreen use. Cancer Epidemiol Biomarkers Prev 2006; 15:2546–8. [DOI] [PubMed] [Google Scholar]
- 14. Darlington S, Williams G, Neale R et al A randomized controlled trial to assess sunscreen application and beta carotene supplementation in the prevention of solar keratoses. Arch Dermatol 2003; 139:451–5. [DOI] [PubMed] [Google Scholar]
- 15. Green AC, Williams GM, Logan V et al Reduced melanoma after regular sunscreen use: randomized trial follow‐up. J Clin Oncol 2011; 29:257–63. [DOI] [PubMed] [Google Scholar]
- 16. Ghiasvand R, Weiderpass E, Green AC et al Sunscreen use and subsequent melanoma risk: a population‐based cohort study. J Clin Oncol 2016; 34:3976–83. [DOI] [PubMed] [Google Scholar]
- 17. Watts CG, Drummond M, Goumas C et al Sunscreen use and melanoma risk among young Australian adults. JAMA Dermatol 2018; 154:1001–9. [DOI] [PMC free article] [PubMed] [Google Scholar]
- 18. Springbett P, Buglass S, Young AR. Photoprotection and vitamin D status. J Photochem Photobiol B 2010; 101:160–8. [DOI] [PubMed] [Google Scholar]
- 19. Norval M, Wulf HC. Does chronic sunscreen use reduce vitamin D production to insufficient levels? Br J Dermatol 2009; 161:732–6. [DOI] [PubMed] [Google Scholar]
- 20. Young AR, Claveau J, Rossi AB. Ultraviolet radiation and the skin: photobiology and sunscreen photoprotection. J Am Acad Dermatol 2017; 76:S100–9. [DOI] [PubMed] [Google Scholar]
- 21. Petersen B, Wulf HC. Application of sunscreen—theory and reality. Photodermatol Photoimmunol Photomed 2014; 30:96–101. [DOI] [PubMed] [Google Scholar]
- 22. Petersen B, Datta P, Philipsen PA et al Sunscreen use and failures—on site observations on a sun‐holiday. Photochem Photobiol Sci 2013; 12:190–6. [DOI] [PubMed] [Google Scholar]
- 23. Pratt H, Hassanin K, Troughton LD et al UV imaging reveals facial areas that are prone to skin cancer are disproportionately missed during sunscreen application. PLOS ONE 2017; 12:e0185297. [DOI] [PMC free article] [PubMed] [Google Scholar]
- 24. Autier P, Boniol M, Dore JF. Sunscreen use and increased duration of intentional sun exposure: still a burning issue. Int J Cancer 2007; 121:1–5. [DOI] [PubMed] [Google Scholar]
- 25. Autier P. Sunscreen abuse for intentional sun exposure. Br J Dermatol 2009; 161 (Suppl. 3):40–5. [DOI] [PubMed] [Google Scholar]
- 26. Petersen B, Wulf HC, Triguero‐Mas M et al Sun and ski holidays improve vitamin D status, but are associated with high levels of DNA damage. J Invest Dermatol 2014; 134:2806–13. [DOI] [PubMed] [Google Scholar]
- 27. Narbutt J, Philipsen PA, Lesiak A et al Children sustain high levels of skin DNA photodamage, with a modest increase of serum 25(OH)D3, after a summer holiday in Northern Europe. Br J Dermatol 2018; 179:940–50. [DOI] [PubMed] [Google Scholar]
- 28. Petersen B, Thieden E, Philipsen PA et al A sun holiday is a sunburn holiday. Photodermatol Photoimmunol Photomed 2013; 29:221–4. [DOI] [PubMed] [Google Scholar]
- 29. Olsen CM, Wilson LF, Green AC et al Prevention of DNA damage in human skin by topical sunscreens. Photodermatol Photoimmunol Photomed 2017; 33:135–42. [DOI] [PubMed] [Google Scholar]
- 30. Young AR, Greenaway J, Harrison GI et al Sub‐optimal application of a high SPF sunscreen prevents epidermal DNA damage in vivo. Acta Derm Venereol 2018; 98:880–7. [DOI] [PubMed] [Google Scholar]
- 31. Narbutt J, Philipsen PA, Harrison GI et al Sunscreen applied at ≥2 mg cm−2 during a sunny holiday prevents erythema, a biomarker of ultraviolet radiation‐induced DNA damage and suppression of acquired immunity. Br J Dermatol 2019; 180:604–14. [DOI] [PubMed] [Google Scholar]
- 32. Fitzpatrick TB. The validity and practicality of sun‐reactive skin types I through VI. Arch Dermatol 1988; 124:869–71. [DOI] [PubMed] [Google Scholar]
- 33. World Health Organization . Ultraviolet radiation (UV). Available at: http://www.who.int/uv/intersunprogramme/activities/uv_index/en/ (last accessed 5 April 2019).
- 34. Petersen B, Thieden E, Philipsen PA et al Determinants of personal ultraviolet‐radiation exposure doses on a sun holiday. Br J Dermatol 2013; 168:1073–9. [DOI] [PubMed] [Google Scholar]
- 35. Petersen B, Triguero‐Mas M, Maier B et al Sun behaviour and personal UVR exposure among Europeans on short term holidays. J Photochem Photobiol B 2015; 151:264–9. [DOI] [PubMed] [Google Scholar]
- 36. Carter GD, Berry J, Durazo‐Arvizu R et al Hydroxyvitamin D assays: an historical perspective from DEQAS. J Steroid Biochem Mol Biol 2018; 177:30–5. [DOI] [PubMed] [Google Scholar]
- 37. Bogh MK, Schmedes AV, Philipsen PA et al Vitamin D production after UVB exposure depends on baseline vitamin D and total cholesterol but not on skin pigmentation. J Invest Dermatol 2010; 130:546–53. [DOI] [PubMed] [Google Scholar]
- 38. Harrison GI, Young AR. Ultraviolet radiation‐induced erythema in human skin. Methods 2002; 28:14–19. [DOI] [PubMed] [Google Scholar]
- 39. Diffey BL. Time and place as modifiers of personal UV exposure. Int J Environ Res Public Health 2018; 15:E1112. [DOI] [PMC free article] [PubMed] [Google Scholar]
- 40. Diffey B. A behavioral model for estimating population exposure to solar ultraviolet radiation. Photochem Photobiol 2008; 84:371–5. [DOI] [PubMed] [Google Scholar]
- 41. The Canary News . Gran Canarias historic tourism record for 2017 confirmed. Available at: https://thecanarynews.com/2018/02/06/gran-canarias-historic-tourism-record-for-2017-confirmed (last accessed 5 April 2019).
- 42. Matsuoka LY, Ide L, Wortsman J et al Sunscreens suppress cutaneous vitamin D3 synthesis. J Clin Endocrinol Metab 1987; 64:1165–8. [DOI] [PubMed] [Google Scholar]
- 43. Sayre RM, Dowdy JC. Darkness at noon: sunscreens and vitamin D3. Photochem Photobiol 2007; 83:459–63. [DOI] [PubMed] [Google Scholar]
- 44. Thieden E, Agren MS, Wulf HC. The wrist is a reliable body site for personal dosimetry of ultraviolet radiation. Photodermatol Photoimmunol Photomed 2000; 16:57–61. [DOI] [PubMed] [Google Scholar]
- 45. Webb AR, Kline L, Holick MF. Influence of season and latitude on the cutaneous synthesis of vitamin D3: exposure to winter sunlight in Boston and Edmonton will not promote vitamin D3 synthesis in human skin. J Clin Endocrinol Metab 1988; 67:373–8. [DOI] [PubMed] [Google Scholar]
- 46. Bogh MK, Schmedes AV, Philipsen PA et al Interdependence between body surface area and ultraviolet B dose in vitamin D production: a randomized controlled trial. Br J Dermatol 2011; 164:163–9. [DOI] [PubMed] [Google Scholar]
- 47. Bouillon R. Comparative analysis of nutritional guidelines for vitamin D. Nat Rev Endocrinol 2017; 13:466–79. [DOI] [PubMed] [Google Scholar]
- 48. Bais AF, Lucas RM, Bornman JF et al Environmental effects of ozone depletion, UV radiation and interactions with climate change: UNEP Environmental Effects Assessment Panel, update 2017. Photochem Photobiol Sci 2018; 17:127–79. [DOI] [PMC free article] [PubMed] [Google Scholar]
- 49. Shih BB, Farrar MD, Cooke MS et al Fractional sunburn threshold UVR doses generate equivalent vitamin D and DNA damage in skin types I‐VI but with epidermal DNA damage gradient correlated to skin darkness. J Invest Dermatol 2018; 138:2244–52. [DOI] [PMC free article] [PubMed] [Google Scholar]
- 50. Tripkovic L, Wilson LR, Hart K et al Daily supplementation with 15 μg vitamin D2 compared with vitamin D3 to increase wintertime 25‐hydroxyvitamin D status in healthy South Asian and white European women: a 12‐wk randomized, placebo‐controlled food‐fortification trial. Am J Clin Nutr 2017; 106:481–90. [DOI] [PubMed] [Google Scholar]
- 51. Seite S, Christiaens F, Bredoux C et al A broad‐spectrum sunscreen prevents cumulative damage from repeated exposure to sub‐erythemal solar ultraviolet radiation representative of temperate latitudes. J Eur Acad Dermatol Venereol 2010; 24:219–22. [DOI] [PubMed] [Google Scholar]
- 52. Fourtanier A, Moyal D, Seite S. UVA filters in sun‐protection products: regulatory and biological aspects. Photochem Photobiol Sci 2012; 11:81–9. [DOI] [PubMed] [Google Scholar]
- 53. Lejeune F, Christiaens F, Bernerd F. Evaluation of sunscreen products using a reconstructed skin model exposed to simulated daily ultraviolet radiation: relevance of filtration profile and SPF value for daily photoprotection. Photodermatol Photoimmunol Photomed 2008; 24:249–55. [DOI] [PubMed] [Google Scholar]
- 54. Young AR, Boles J, Herzog B et al A sunscreen's labeled sun protection factor may overestimate protection at temperate latitudes: a human in vivo study. J Invest Dermatol 2010; 130:2457–62. [DOI] [PubMed] [Google Scholar]
- 55. Lawrence KP, Douki T, Sarkany RPE et al The UV/visible radiation boundary region (385‐405 nm) damages skin cells and induces “dark” cyclobutane pyrimidine dimers in human skin in vivo. Sci Rep 2018; 8:12722. [DOI] [PMC free article] [PubMed] [Google Scholar]
- 56. Tewari A, Sarkany RP, Young AR. UVA1 induces cyclobutane pyrimidine dimers but not 6‐4 photoproducts in human skin in vivo. J Invest Dermatol 2012; 132:394–400. [DOI] [PubMed] [Google Scholar]
- 57. McAdam E, Brem R, Karran P. Oxidative stress‐induced protein damage inhibits DNA repair and determines mutation risk and therapeutic efficacy. Mol Cancer Res 2016; 14:612–22. [DOI] [PMC free article] [PubMed] [Google Scholar]
- 58. Moan J, Baturaite Z, Porojnicu AC et al UVA, UVB and incidence of cutaneous malignant melanoma in Norway and Sweden. Photochem Photobiol Sci 2012; 11:191–8. [DOI] [PubMed] [Google Scholar]
- 59. Moan JE, Baturaite Z, Dahlback A et al Ultraviolet radiation and cutaneous malignant melanoma. Adv Exp Med Biol 2014; 810:359–74. [DOI] [PubMed] [Google Scholar]
- 60. Binkley N, Carter GD. Toward clarity in clinical vitamin D status assessment: 25(OH)D assay standardization. Endocrinol Metab Clin North Am 2017; 46:885–99. [DOI] [PubMed] [Google Scholar]
- 61. MacLaughlin J, Holick MF. Aging decreases the capacity of human skin to produce vitamin D3. J Clin Invest 1985; 76:1536–8. [DOI] [PMC free article] [PubMed] [Google Scholar]
- 62. McCambridge J, Witton J, Elbourne DR. Systematic review of the Hawthorne effect: new concepts are needed to study research participation effects. J Clin Epidemiol 2014; 67:267–77. [DOI] [PMC free article] [PubMed] [Google Scholar]
- 63. Faurschou A, Beyer DM, Schmedes A et al The relation between sunscreen layer thickness and vitamin D production after ultraviolet B exposure: a randomized clinical trial. Br J Dermatol 2012; 167:391–5. [DOI] [PubMed] [Google Scholar]
- 64. Kockott D, Herzog B, Reichrath J et al New approach to develop optimized sunscreens that enable cutaneous vitamin D formation with minimal erythema risk. PLOS ONE 2016; 11:e0145509. [DOI] [PMC free article] [PubMed] [Google Scholar]
- 65. Neale RE, Khan SR, Lucas RM et al The effect of sunscreen on vitamin D: a review. Br J Dermatol 2019. 181:907–15. [DOI] [PubMed] [Google Scholar]
- 66. Passeron T, Bouillon R, Callender V et al Sunscreen photoprotection and vitamin D status. Br J Dermatol 2019. 10.1111/bjd.17992 [DOI] [PMC free article] [PubMed] [Google Scholar]
Associated Data
This section collects any data citations, data availability statements, or supplementary materials included in this article.
Supplementary Materials
Fig S1. Mean serum 25‐hydroxyvitamin D2 [25(OH)D2] status pre‐ and postholiday for all groups.
Fig S2. Erythemally effective energy (J) received at skin surface.
Fig S3. Bland–Altman plot of serum 25‐hydroxyvitamin D3 [25(OH)D3] measured in two laboratories.