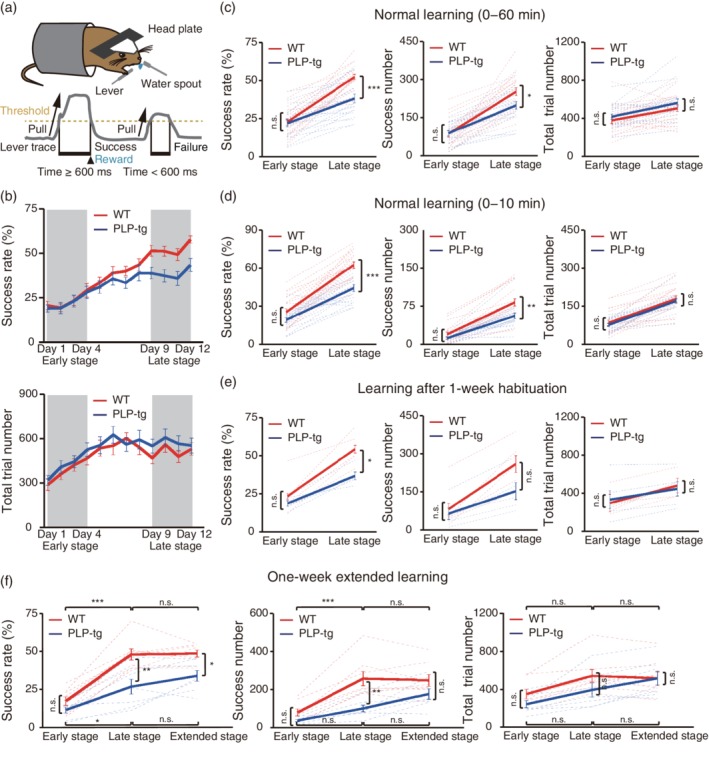
Figure 1.

Changes in task performance during learning of a lever‐pull task. (a) Schematic of the lever‐pull task. Head‐restrained mice were trained to perform self‐initiated right‐forelimb movements. A 600 ms lever pull was required to receive a drop of water. (b) Time course of the 60 min‐averaged lever‐pull success rate (upper) and the 60 min‐averaged number of total trials (lower) in WT (red) and PLP‐tg mice (blue). (c) Success rate (left), number of successful trials (center) and number of total trial lever pulls (right) in early (Days 1–4) and late (Days 9–12) training stages in the WT (red, n = 20) and PLP‐tg (blue, n = 19) mice shown in plot b. Success rate: F 1,74 = 10.79, p = .99 (early), p = 2.1 × 10⁻⁴ (late), two‐way ANOVA followed by Tukey's test. Success number: F 1,74 = 3.56, p = 1.00 (early), p = .036 (late), two‐way ANOVA followed by Tukey's test. Total trial number: F 1,74 = 1.86, p = .86 (early), p = .67 (late), two‐way ANOVA followed by Tukey's test. Data are presented as the mean ± SEM. *p < .05, ***p < .001, n.s.: nonsignificant. (d) Success rate (left), number of successful trials (center), and number of total trials (right) during the initial 10 min session in early (Days 1–4) and late (Days 9–12) training stages in the WT (red, n = 20) and PLP‐tg (blue, n = 19) mice shown in plot b. Success rate: F 1,74 = 24.15, p = .29 (early), p = 1.1 × 10⁻⁵ (late), two‐way ANOVA followed by Tukey's test. Success number: F 1,74 = 10.78, p = .75 (early), p = .0028 (late), two‐way ANOVA followed by Tukey's test. Total trial number: F 1,74 = 0.65, p = .95 (early), p = .93 (late), two‐way ANOVA followed by Tukey's test. Data are presented as the mean ± SEM. **p < .01, ***p < .001, n.s.: nonsignificant. (e) Success rate (left), number of successful trials (center) and number of total trials (right) in early (Days 1–4) and late (Days 9–12) sessions after 1 week of habituation to the experimental apparatus. Five WT mice (red) and five PLP‐tg mice (blue) were used. Success rate: F 1,16 = 6.96, p = .86 (early), p = .043 (late), two‐way ANOVA followed by Tukey's test. Success number: F 1,16 = 2.79, p = .99 (early), p = .22 (late), two‐way ANOVA followed by Tukey's test. Total trial number: F 1,16 = 0.00, p = .99 (early), p = .99 (late), two‐way ANOVA followed by Tukey's test. Data are presented as the mean ± SEM. *p < .05, n.s.: nonsignificant. (f) Success rate (left), number of successful trials (center), and number of total trials (right) in early (Days 1–4), late (Days 9–12), and extended (Days 15–18) stages. Eight WT mice (red) and seven PLP‐tg mice (blue) were used. Success rate: WT versus PLP‐tg, F 1,39 = 24.6, p = .83 (early), p = .0012 (late), p = .047 (extended); WT, F 2,39 = 35.5, p = 1.4 × 10⁻⁶ (early vs. late), p = 1.0 (late vs. extended); PLP‐tg, F 2,39 = 35.5, p = .044 (early vs. late), p = .73 (late vs. extended), two‐way ANOVA followed by Tukey's test. Success number: WT versus PLP‐tg, F 1,39 = 17.2, p = .86 (early), p = .0022 (late), p = .42 (extended); WT, F 2,39 = 18.8, p = 2.5 × 10⁻⁴ (early vs. late), p = 1.0 (late vs. extended); PLP‐tg, F 2,39 = 18.8, p = .58 (early vs. late), p = .37 (late vs. extended), two‐way ANOVA followed by Tukey's test. Total trial number: WT versus PLP‐tg, F 1,39 = 2.74, p = .84 (early), p = .56 (late), p = 1.0 (extended); WT, F 2,39 = 6.60, p = .25 (early vs. late), p = 1.0 (late vs. extended); PLP‐tg, F 2,39 = 6.60, p = .60 (early vs. late), p = .77 (late vs. extended), two‐way ANOVA followed by Tukey's test. Data are presented as the mean ± SEM. *p < .05, **p < .01, ***p < .001, n.s.: nonsignificant
