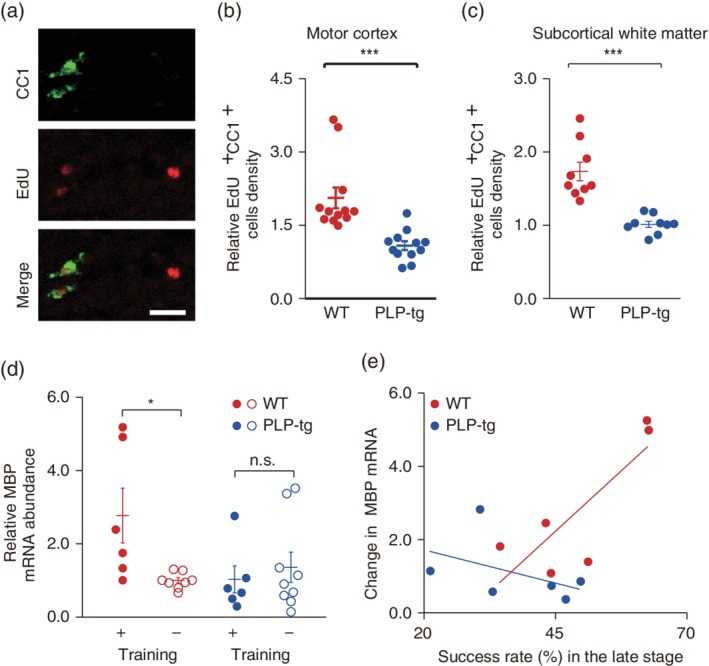
Figure 2.

Changes in myelination during learning of a lever‐pull task. (a) Typical images of EdU+ CC1+ cells in the subcortical white matter of M1 from WT mice. Scale bar, 20 μm. (b) Scatter plots of the ratio of EdU+ CC1+ cells density in the left gray matter of M1 to that in right gray matter of M1 (p = 1.2 × 10⁻⁴, n = 12 fields from four WT mice, n = 12 fields from four PLP‐tg mice, Wilcoxon rank sum test). Data are presented as the mean ± SEM. ***p < .001. (c) Scatter plots of the ratio of EdU+ CC1+ cells density in the left subcortical white matter of M1 to that in right subcortical white matter of M1 (p = 4.1 × 10⁻⁵, n = nine fields from four WT mice, n = nine fields from four PLP‐tg mice, Wilcoxon rank sum test). Data are presented as the mean ± SEM. ***p < .001. (d) The ratio of myelin basic protein (MBP) mRNA expression in left M1 to that in right M1 in trained and untrained WT and PLP‐tg mice; F 3,25 = 3.29, p = .042 (WT, training+ [n = 6] versus training− [n = 8]), p = .95 (PLP‐tg, training+ [n = 6] versus training− [n = 9]), one‐way ANOVA followed by Tukey's test. Data are presented as the mean ± SEM. *p < .05, n.s.: nonsignificant. (e) Changes in the MBP mRNA ratio against the success rate in the late training stage (WT: n = 6, p = .049, r = 0.813; PLP‐tg: n = 6, p = .37, r = −0.451, Pearson's correlation test)
