Abstract
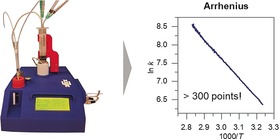
We present a new device for quantifying gases or gas mixtures based on the simple principle of bubble counting. With this device, we can follow reaction kinetics down to volume step sizes of 8–12 μL. This enables the accurate determination of both time and size of these gas quanta, giving a very detailed kinetic analysis. We demonstrate this method and device using ammonia borane hydrolysis as a model reaction, obtaining Arrhenius plots with over 300 data points from a single experiment. Our device not only saves time and avoids frustration, but also offers more insight into reaction kinetics and mechanistic studies. Moreover, its simplicity and low cost open opportunities for many lab applications.
Keywords: 3D printing, ammonia borane, Arrhenius, reaction kinetics, reaction mechanism
Bursting the bubble: Quick, easy, and accurate Arrhenius plots from a single experiment were obtained. By using a new device for quantifying gases or gas mixtures based on the simple principle of bubble counting, it is possible to follow reaction kinetics down to volume step sizes of 8–12 μL.

Measuring the kinetics of chemical reactions is common in many laboratories. Knowing the reaction kinetics can provide an insight into the system as it moves towards equilibrium. It is essential for testing hypotheses, for understanding reaction mechanisms, and for designing and optimizing chemical processes.1, 2, 3 Yet despite its importance, the task itself is often mundane, time‐consuming, and labour‐intensive. This is especially true when determining the temperature‐dependence of rate constants, which requires multiple sets of various measurements. When dealing with reactions that produce gaseous products, the quantification of gas production at the bench is a hassle. This can be solved using on‐line gas chromatography (GC) or mass spectrometry (MS). But since these instruments are expensive, and require long calibration procedures, the most commonly used method today is still the trusted upside‐down glass burette.4, 5, 6, 7, 8, 9 This requires only a beaker, a burette, and some water. However, the results are less accurate, and the measurements are still time‐consuming and laborious.
Recently, while studying H2 evolution from ammonia borane hydrolysis for MAX‐phase supported metal catalysts, we were faced with the task of measuring the temperature dependence of rate constants of a series of catalytic reactions. Rather than slog our way through numerous calibration experiments and repetitions,10 we developed a simple and efficient bench‐top device that automates this analysis. Unlike the upside‐down burette, our device measures the development and passage of gas bubbles rather than the displacement of water. As the same device also controls the reaction temperature, it enables a fast and accurate measurement of Arrhenius relations, giving hundreds of data points from a single experiment.
Herein, we present the theoretical and physico‐chemical foundation for this new device and method. We then show how one can build such device, and then compare its performance to the classic analysis methods. Finally, we show its application in the derivation of Arrhenius relations for the hydrolysis of ammonia borane in the presence of Ru/C catalysts as a model reaction. The detailed design and construction parameters are included in the Supporting Information.
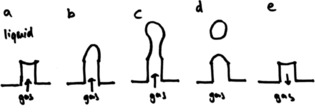
When a chemical reaction gives a gaseous product, the number of gas molecules released is directly proportional to the reaction progress. If these molecules are released into a liquid, they will form bubbles. The size and the shape of these bubbles depend on several factors, including the viscosity of the medium, its surface tension, temperature, and pressure.11, 12, 13 If the gas is released from a nozzle (Figure 1 a), we can identify two distinct stages: the formation of the bubble (static stage) and the rising of the bubble (dynamic stage). When a bubble is forming at a gas–liquid interface, the pressure that is needed to extend the bubble is related to the radius of that interface. This is the so‐called Laplace pressure [Eq. (1)].14 Herein, r is the radius of the bubble, γ is the surface tension and Δp is the pressure difference inside/outside the bubble.
| (1) |
Figure 1.

The five stages of bubble formation at a gas/liquid interface: a) starting situation, b) expanding of the gas/liquid interface, c) neck formation, d) separation of the free bubble and e) reflow of gas to minimize surface tension.
As the bubble extends, the interface area will increase, and the bubble will fill with gas until its buoyancy force exceeds the surface tension at the nozzle end. When this happens, the bubble will start stretching (Figure 1 b/c). A “neck” then forms, and eventually a division occurs, minimizing the surface tension and resulting in a free bubble and a new gas–liquid interface at the nozzle (Figure 1 d). The excess energy of the interface causes some of the gas to flow back, in equilibrium with pressure of the gas in the reactor (Figure 1 e). This completes the cycle, which can then repeat with a new bubble.
When a bubble forms, it quickly accelerates and approaches a terminal velocity, given by the Stokes equation [Eq. (2)].15 Herein, g is the acceleration due to gravity, de is the equivalent bubble diameter (that is, the diameter of a sphere with same volume as the bubble), μl is the dynamic viscosity of the liquid, ρf is the density of the liquid and ρg the density of the gas.
| (2) |
Our bubble counter detects the bubbles using a laser beam. Each bubble passes through the beam, scattering/reflecting the photons, and thereby changing the response at the detector. Ideally, we want to measure the bubbles at their terminal velocity, because then we can use the passing velocity as a measure of bubble size. For this, the bubbles must travel straight across the beam. However, this rarely happens. Bubbles deviate from the center of the cylinder and oscillate or spiral upward.16 We can control this trajectory by decreasing the cylinder radius. This will force the bubble to the center as long as there is enough space for liquid to counterflow. If the cylinder radius is too small, however, a slow Taylor flow forms, which is unfavorable, because then the bubble can stick to the vessel walls. After experimenting with different cylinder diameters, we chose a cylinder diameter of 28 mm which gives enough room for a convectional flow pattern as well as for detecting the bubbles.
To detect the bubbles and quantify their volume, we designed and built a device comprised of a temperature‐controlled reactor and a detection cell (Figure 2, see the supporting information for a detailed description). The reactor is equipped with additional needle ports for injecting reactants. The detection cell is a glass cylinder filled with liquid and fitted with a gas entry nozzle. This device can run both isothermal experiments as well as slowly ramping up temperature to a fixed set point (0–10 °C min−1 ramp rates). A purge gas equalizes the pressure before injection of the reactant. This avoids lag periods before the first bubble appears. For every bubble the device logs three values: the time the bubble crosses the beam, the sample temperature and the beam interruption time.
Figure 2.

The bubble counting device (from left: schematic representation of the reaction chamber and the detection cell, orthographic projection of the detection cell and its housing, and photo of the system in action).
Bubble formation in liquids depends on the density and the viscosity of both the gas‐ and liquid phases as well as on the interfacial tension.17 Ideally, we want the gas bubbles to be as small as possible. Decreasing the nozzle size gives smaller bubbles, but also increases the Laplace pressure [Eq. (1)]. This pressure builds up until a “train” of small bubbles escapes the nozzle. The trade‐off between pressure and bubble size forced us to find an optimum size where the bubbles are basically just large enough to escape from the nozzle one by one. Choosing the right solvent is important. With the radius of the nozzle fixed, we can only influence the bubble volume by changing the surface tension of the liquid. This also changes the viscosity, and with it the upward speed of the bubbles. We chose n‐hexadecane as our detection liquid, based on its low surface tension (27.6 mN m−1), high boiling point (287 °C), low viscosity (3.45 MPa s), and availability. In general, the liquid should be chosen based on the application. The detection cell can only process a certain number of bubbles per second. This determines the maximum flowrate through the cell. If you need a higher flow rate, you can choose a solvent with high surface tension and correspondingly a larger volume per bubble.
We observed that the bubbles become larger at higher flow rates. To ensure accurate quantification throughout a range of flow rates we used a calibration curve correlating the average bubble volume with flow velocity (see the calibration details and Figures S5/S6 in the Supporting Information). With this calibration, our measurements are accurate up to flow rates of 12 mL min−1. One important advantage over other techniques such as gas chromatography and mass spectrometry is that our method has practically no lower limit of detection. The bubble formation can take as much time as needed, allowing us to monitor very slow reactions over the course of several hours/days. Bubble formation is only limited by gas molecules dissolving into the detection liquid and subsequently diffusing through the solution. Our device can detect flow rates as low as 5 μL min−1 without any problems. Moreover, changing gases does not influence the bubble volume (Supporting Information, Figure S(3)
| (3) |
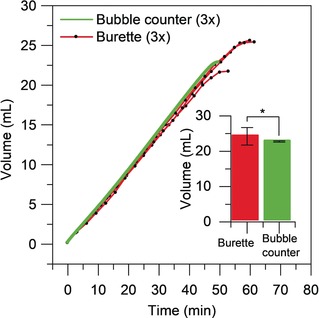
To test the experimental accuracy of our device, we used the ruthenium‐catalyzed hydrolysis of ammonia borane to ammonium borate and hydrogen [Eq. (3)] as a benchmark reaction. This simple reaction proceeds to completion within 30 min at ambient temperature in the presence of catalytic Ru/C, giving no side products.18, 19, 20 Figure 3 compares the cumulative bubble volumes for our device and a control experiment under identical conditions using an upside‐down burette. Each reaction was repeated in triplicate. In the control reaction, we measured 100 points, which is highly labour‐intensive. The automated device measured at the same time no less than 3000 points with high reproducibility.
Figure 3.

Total volume versus time for burette method and bubble counter method. Reaction conditions: ammonia borane (0.40 mmol) in water (6.4 mL), 5 % Ru/C (2.0 mg) under stirring (1000 rpm) at 23 °C. The inset shows the final volume measured using burette and bubble counter with 95 % confidence intervals.
In addition to measuring many data points, our new device can heat the sample under a tightly controlled ramp, enabling the monitoring of the reaction kinetics at different temperatures. This means that we can obtain Arrhenius plots with hundreds of data points, allowing accurate determination of activation energies within a few kJ mol−1. Reaction enthalpies or entropies can then be estimated using the Eyring–Polanyi equation.21, 22, 23
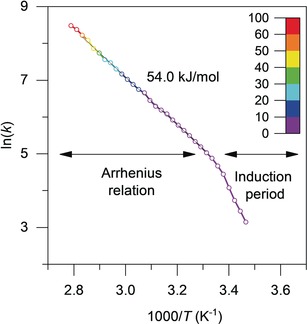
Figure 4 demonstrates the power of this new device on the catalytic hydrolysis of ammonia borane [Eq. (3)]. Note that the detailed Arrhenius plot has been produced from a single experiment of 30 min. We obtained an activation energy of 79 kJ mol−1 which is in accordance with the published value of 76 kJ mol−1.24 Repeated experiments gave a confidence interval for activation energy of ±1.6 kJ mol−1. The large number of data points also allowed us to study transport phenomena, as well as changes in the rate‐determining step. Figure 5 shows an example of a 5 % Ru/SiO2 catalyst that shows nonstandard Arrhenius behavior: At low temperatures, we see a clear induction period where the catalyst is activating (this type of experiment shows the effectiveness of our device, as it is unlikely to yield accurate results using a burette). After this activation period, the reaction displays a linear Arrhenius relationship.
Figure 4.

Processing of volume data from the hydrolysis of ammonia borane into an Arrhenius plot. Cumulative volume versus time (left), reaction rate versus temperature (middle), and the resulting Arrhenius plot of In k versus 1/T (right).
Figure 5.

Arrhenius plot of the hydrolysis of ammonia borane catalyzed by 5 % Ru/SiO2, corrected with a pre‐measured reaction order of 0.35. Conversion is represented by a color scale. For clarity, the graph shows only 30 data points. The actual number of data points in this experiment is 300, each of which is an average of 20 measured bubbles (6000 raw data measurements in total).
In conclusion, the new device described in this communication enables the monitoring of chemical reactions giving gaseous products. It is simple, accurate, safe, robust, and allows the quantification of reaction kinetics with high accuracy. Moreover, it can be used for determining temperature/rate relationships and calculating Arrhenius and Eyring parameters quickly and efficiently. The large number of data points per reaction (typically thousands of measurements) enables a thorough statistical analysis and opens opportunities for observing and deriving subtle physicochemical changes which were not accessible so far. We hope that the simplicity of this device (it costs < € 250) and its general availability (the CAD files for 3D printing of the parts and all the technical specifications are included in the Supporting Information) will encourage scientists to use it in their labs.
Conflict of interest
The authors declare no conflict of interest.
Supporting information
As a service to our authors and readers, this journal provides supporting information supplied by the authors. Such materials are peer reviewed and may be re‐organized for online delivery, but are not copy‐edited or typeset. Technical support issues arising from supporting information (other than missing files) should be addressed to the authors.
Supplementary
Acknowledgements
We thank ing. P.F. Collignon and ing. N.J. Geels for discussions on the device configuration and A.K. Sadhoe and Y. Hordijk for assistance with the screening experiments.
T. K. Slot, N. R. Shiju, G. Rothenberg, Angew. Chem. Int. Ed. 2019, 58, 17273.
References
- 1. Shan J., Lucci F. R., Liu J., El-Soda M., Marcinkowski M. D., Allard L. F., Sykes E. C. H., Flytzani-Stephanopoulos M., Surf. Sci. 2016, 650, 121–129. [Google Scholar]
- 2. Tang J., Zhu L., Fu X., Dai J., Guo X., Hu C., ACS Catal. 2017, 7, 256–266. [Google Scholar]
- 3. Boelens H. F. M., Iron D., Westerhuis J. A., Rothenberg G., Chem. Eur. J. 2003, 9, 3876–3881. [DOI] [PubMed] [Google Scholar]
- 4. Wang Q., Fu F., Escobar A., Moya S., Ruiz J., Astruc D., ChemCatChem 2018, 10, 2673–2680. [Google Scholar]
- 5. Wang L., Li H., Zhang W., Zhao X., Qiu J., Li A., Zheng X., Hu Z., Si R., Zeng J., Angew. Chem. Int. Ed. 2017, 56, 4712–4718; [DOI] [PubMed] [Google Scholar]; Angew. Chem. 2017, 129, 4790–4796. [Google Scholar]
- 6. Peng C.-Y., Kang L., Cao S., Chen Y., Lin Z.-S., Fu W.-F., Angew. Chem. Int. Ed. 2015, 54, 15725–15729; [DOI] [PubMed] [Google Scholar]; Angew. Chem. 2015, 127, 15951–15955. [Google Scholar]
- 7. Li J., Zhu Q.-L., Xu Q., Catal. Sci. Technol. 2015, 5, 525–530. [Google Scholar]
- 8. Hu M., Wang H., Wang Y., Zhang Y., Wu J., Xu B., Gao D., Bi J., Fan G., Int. J. Hydrogen Energy 2017, 42, 24142–24149. [Google Scholar]
- 9. Bulut A., Yurderi M., Ertas İ. E., Celebi M., Kaya M., Zahmakiran M., Appl. Catal. B 2016, 180, 121–129. [Google Scholar]
- 10. Cruz S. C., Rothenberg G., Westerhuis J. A., Smilde A. K., Anal. Chem. 2005, 77, 2227–2234. [DOI] [PubMed] [Google Scholar]
- 11. Kulkarni A. A., Joshi J. B., Ind. Eng. Chem. Res. 2005, 44, 5873–5931. [Google Scholar]
- 12. Yang G. Q., Du B., Fan L. S., Chem. Eng. Sci. 2007, 62, 2–27. [Google Scholar]
- 13. Hua J., Lou J., J. Comput. Phys. 2007, 222, 769–795. [Google Scholar]
- 14.P. S. Laplace, Traité de mécanique céleste, Gauthier-Villars: Paris, 1806, vol. 4, suppl. to book 10, p. 419.
- 15. Stokes G. G., Larmor J., Rayleigh J. W. S., Mathematical and Physical Papers, Cambridge University Press, 1880. [Google Scholar]
- 16. Weber A., Bart H.-J., Klar A., Open J. Fluid Dynamics 2017, 07, 288–309. [Google Scholar]
- 17. Huber M., Dobesch D., Kunz P., Hirschler M., Nieken U., Chem. Eng. Sci. 2016, 152, 151–162. [Google Scholar]
- 18. Chen W., Wang Z., Duan X., Qian G., Chen D., Zhou X., Chem. Eng. Sci. 2018, 192, 1242–1251. [Google Scholar]
- 19. Fu F., Wang C., Wang Q., Martinez-Villacorta A. M., Escobar A., Chong H., Wang X., Moya S., Salmon L., Fouquet E., et al., J. Am. Chem. Soc. 2018, 140, 10034–10042. [DOI] [PubMed] [Google Scholar]
- 20. Feng X., Zhao Y., Liu D., Mo Y., Liu Y., Chen X., Yan W., Jin X., Chen B., Duan X., et al., Int. J. Hydrogen Energy 2018, 43, 17112–17120. [Google Scholar]
- 21. Eyring H., J. Chem. Phys. 1935, 3, 107–115. [Google Scholar]
- 22. Evans M. G., Polanyi M., Trans. Faraday Soc. 1935, 31, 875–894. [Google Scholar]
- 23. Laidler K. J., King M. C., J. Phys. Chem. 1983, 87, 2657–2664. [Google Scholar]
- 24. Basu S., Brockman A., Gagare P., Zheng Y., Ramachandran P. V., Delgass W. N., Gore J. P., J. Power Sources 2009, 188, 238–243. [Google Scholar]
Associated Data
This section collects any data citations, data availability statements, or supplementary materials included in this article.
Supplementary Materials
As a service to our authors and readers, this journal provides supporting information supplied by the authors. Such materials are peer reviewed and may be re‐organized for online delivery, but are not copy‐edited or typeset. Technical support issues arising from supporting information (other than missing files) should be addressed to the authors.
Supplementary


