

Summary
Nicotinamide adenine dinucleotide (NAD +) is an essential coenzyme required for all living organisms. In eukaryotic cells, the final step of NAD + biosynthesis is exclusively cytosolic. Hence, NAD + must be imported into organelles to support their metabolic functions. Three NAD + transporters belonging to the mitochondrial carrier family (MCF) have been biochemically characterized in plants. AtNDT1 (At2g47490), focus of the current study, At NDT2 (At1g25380), targeted to the inner mitochondrial membrane, and At PXN (At2g39970), located in the peroxisomal membrane. Although At NDT1 was presumed to reside in the chloroplast membrane, subcellular localization experiments with green fluorescent protein (GFP) fusions revealed that At NDT1 locates exclusively in the mitochondrial membrane in stably transformed Arabidopsis plants. To understand the biological function of At NDT1 in Arabidopsis, three transgenic lines containing an antisense construct of AtNDT1 under the control of the 35S promoter alongside a T‐DNA insertional line were evaluated. Plants with reduced AtNDT1 expression displayed lower pollen viability, silique length, and higher rate of seed abortion. Furthermore, these plants also exhibited an increased leaf number and leaf area concomitant with higher photosynthetic rates and higher levels of sucrose and starch. Therefore, lower expression of AtNDT1 was associated with enhanced vegetative growth but severe impairment of the reproductive stage. These results are discussed in the context of the mitochondrial localization of At NDT1 and its important role in the cellular NAD + homeostasis for both metabolic and developmental processes in plants.
Keywords: Arabidopsis thaliana, nicotinamide adenine dinucleotide, transporter, pollen viability, starch metabolism
Significance Statement
The mitochondrial NAD+ carrier (NDT1) plays an important role in cellular NAD+ homeostasis in leaves. Impaired NDT1 function results in reduced pollen grain viability, tube growth and seed filling, seed germination and seedling establishment.
Introduction
Nicotinamide adenine dinucleotide (NAD+) and its phosphorylated derivative (NADP+) are central coenzymes implicated in cellular homeostasis. Alteration in the balance of the anabolism and catabolism of these nucleotides does not only affect metabolism but also the redox poise of the entire cell, thereby strongly impacting plant growth and development (Noctor et al., 2006; Hashida et al., 2009, 2010; Gakière et al., 2018). Along with its derivative forms, NAD+ participates in several biological reactions in glycolysis, the tricarboxylic acid (TCA) cycle, glycine decarboxylation, the Calvin−Benson cycle, and the β‐oxidation in peroxisomes (Bernhardt et al., 2012; Geigenberger and Fernie, 2014).
NAD+ is widely used as coenzyme for reductive/oxidative processes, playing important roles in the operation of a range of dehydrogenase activities (Selinski et al., 2014). In addition, an important role for NAD+ metabolism has been demonstrated in pollen maturation and germination (Hashida et al., 2013) and for the energy generation during pollen germination and tube growth (Cárdenas et al., 2006; Selinski and Scheibe, 2014). The NADPH generated in heterotrophic plastids by the oxidative pentose phosphate pathway (OPPP) provides the reducing power required for several pathways, such as fatty acid biosynthesis (Neuhaus and Emes, 2000), as well as nitrogen assimilation (Bowsher et al., 2007) and amino acid biosynthesis. Moreover, both NAD+ and NADP+ play an essential role in signalling pathways through their interaction with reactive oxygen species (ROS) (Hashida et al., 2010). Consequently, it is assumed that these two coenzymes are involved in the acclimation to environmental stresses such as UV radiation, salinity, temperature, and drought (De Block et al., 2005). Over and above this, it has been proposed that pyridine nucleotide metabolism is important for seed germination (Hunt et al., 2007), stomatal movement (Hashida et al., 2010), bolting (Liu et al., 2009), development (Hashida et al., 2009), senescence (Schippers et al., 2008), and nitrogen assimilation (Takahashi et al., 2009).
NAD+ biosynthesis in plants occurs via either the de novo or the salvage pathway (Noctor et al., 2006; Hashida et al., 2009). The de novo pathway starts in plastids using aspartate or tryptophan as precursors, while the salvage pathway starts with nicotinamide (NAM) or nicotinic acid (NA). Both metabolic fluxes converge in the formation of nicotinic acid mononucleotide (NAMN), which in turn gives rise to NAD+. Furthermore NAD+ kinases can synthetize NADP+ from NAD+ and ATP in the cytosol (NADK1; Berrin et al., 2005; Waller et al., 2010) and in the chloroplasts (NADK2; Chai et al., 2005, 2006). In addition, peroxisomal NADH kinase, which uses NADH rather than NAD+ as substrate to produce NADPH, has been found in Arabidopsis thaliana (NADK3; Turner et al., 2005; Waller et al., 2010). Since the last step of NAD+ synthesis takes place in the cytosol, NAD+ must be imported into the cell organelles to allow proper metabolism (Noctor et al., 2006).
In yeast, two carrier proteins called ScNDT1 and ScNDT2 (NDT: NAD+ transporter), which are capable of transporting NAD+, have been identified (Todisco et al., 2006). The characterization of ScNDT1 protein revealed its location in the inner mitochondrial membrane and its high NAD+ transport activity in exchange with ADP and AMP in vitro (Todisco et al., 2006). The lack of both ScNDT proteins in yeast assigns a function for supplying NAD+ to the mitochondrial matrix (Todisco et al., 2006). Three genes encoding proteins capable of NAD+ transport have been identified in Arabidopsis. AtNDT2 is located in the inner mitochondrial membrane (Palmieri et al., 2009) and AtPXN resides in the peroxisomal membrane (Agrimi et al., 2012; Bernhardt et al., 2012). Moreover, re‐evaluation of the subcellular localization of AtNDT1, previously reported to encode a protein targeted to the inner membrane of the chloroplast (Palmieri et al., 2009), revealed the exclusive mitochondrial localization of this carrier (the present work). Interestingly, the two mitochondrial NAD+ carrier proteins found in Arabidopsis, AtNDT1 and AtNDT2, have similar substrate specificity, importing NAD+, but not NADH, nicotinamide, nicotinic acid, NADP+ or NADPH, against ADP or AMP (Palmieri et al., 2009). In contrast, the AtPXN transporter has a versatile transport function in vitro, also using NADH and CoA as substrates (Agrimi et al., 2012; Bernhardt et al., 2012). Yeast complementation studies revealed that AtPXN favours the import of NAD+ in exchange for AMP in intact yeast cells (van Roermund et al., 2016). Furthermore, expression of either AtNDT1 or AtNDT2 is able to complement the phenotype of S. cerevisiae cells lacking their NAD+ mitochondrial transporters and increase the mitochondrial NAD+ content of the double mutant strain devoid of their two NAD+ mitochondrial transporters (Palmieri et al., 2009). In addition, the expression of either AtNDT2 or ScNDT1 in human cells increases the NAD+ content within the mitochondria (VanLinden et al., 2015). Together, these studies provide evidence that AtNDT1, like AtNDT2, catalyzes the import of NAD+ into the mitochondria under in vivo conditions.
Analysis of Atndt1‐ and Atndt2‐promoter‐GUS plants showed that both genes are strongly expressed in developing tissues, mainly in highly metabolically active cells, which is in line with their mitochondrial localization. However, these transporters have only been characterised at the biochemical and molecular level, while their physiological function remains unclear. For this reason, we aimed to investigate the impact of decreased AtNDT1 expression on plant development and performance. Given the importance of NAD+ in plant metabolism, we would expect that the deficiency of AtNDT1 transport would impact the redox balance of the cells in different plant tissues. This impact on the redox balance could influence plant growth and development under both optimal and stress situations. In addition, evaluation of the AtNDT1 protein function is critical for a better understanding of mitochondrial processes and their regulation. To test this hypothesis, we analysed the corresponding Arabidopsis mutants showing reduced expression of AtNDT1 to understand how and at what level changes in the mitochondrial NAD+ transport can affect cell metabolism and plant development. We focused our attention on the impact of reduced AtNDT1 expression in reproductive tissues and on the importance of this carrier in illuminated leaves.
Results
AtNDT1 is highly expressed in the pollen grain
The need for NAD+ for multiple essential functions in cellular organelles is met by specialized NAD+ transport proteins. We therefore expect the presence of these carrier proteins in various tissues and at several developmental stages in Arabidopsis. To investigate the AtNDT1 gene expression, we determined their transcript levels in different organs of young and mature Arabidopsis plants by quantitative real‐time PCR (qRT‐PCR) analysis (Supporting Information Figure S1). In agreement with information in publicly available gene expression databases (http://bar.utoronto.ca), but slightly in contrast to that observed in our previous promotor GUS study (Palmieri et al., 2009), AtNDT1 was strongly expressed in the pollen grain. It also displayed considerable expression in seeds, seedlings, mature leaves and flowers. This suggest that AtNDT1 transcript is ubiquitously expressed in Arabidopsis, but mainly found in pollen grain. This implies a role in sink and source tissues at any phase of the plant life cycle.
Generation of Arabidopsis plants with reduced expression of AtNDT1
To investigate the physiological role of the AtNDT1 transporter in Arabidopsis, a T‐DNA insertion line (GK‐241G12) was isolated and three independent antisense lines were selected in the Col‐0 ecotype (Figure 1a). The T‐DNA was inserted in the ninth exon of the AtNDT1 gene. Due to the presence of the T‐DNA insertion, the homozygous T‐DNA insertion plant ndt1 − :ndt1 − contained only 13% of the wild type (WT) AtNDT1 transcript level in leaves (Figure 1b). The AtNDT1 antisense lines were generated by ectopic repression of the AtNDT1 transcription. The AtNDT1 mRNA levels of the three antisense lines as‐1‐ndt1, as‐2‐ndt1 and as‐3‐ndt1 were reduced to 28, 34, and 49%, respectively, compared with those in WT leaves (Figure 1b). These independent mutant lines were used for further analyses to investigate the in planta function of AtNDT1.
Figure 1.
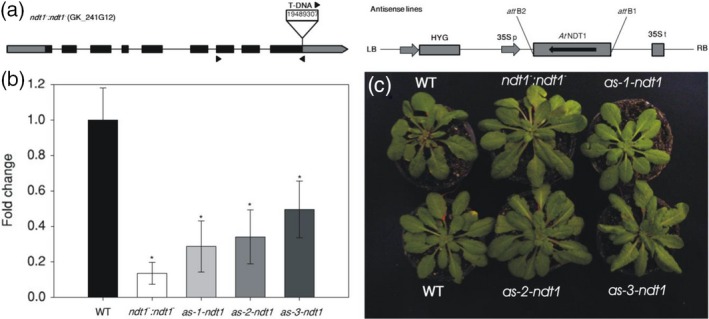
Isolation and characterization of Arabidopsis thaliana genotypes deficient in the expression of the mitochondrial NAD+ transporter (NDT1). (a) Schematic representation of the gene AtNDT1 (At2g47490) showing the T‐DNA insertion site. The T‐DNA insert, approximately 4.5 kb, is not to scale. Boxes represent gene exons, and arrows on T‐DNA denote primer positions used for population screening. The antisense construct includes the hygromycin resistance gene (HYG), the 35S promoter, the gene NDT1 in antisense position and the 35S terminator. (b) Expression by quantitative real‐time PCR analysis of NDT1 in mature leaves of the A. thaliana mutants and wild‐type plants (WT). The values were calculated relative to the WT in rosette leaves of 28‐day‐old plants. Values are presented as mean ± SE of six individual plants per line; an asterisk indicates values that were determined by Student's t‐test to be significantly different (P < 0.05) from the WT. (c) Phenotypic characterization of 4‐week‐old short‐day grown Arabidopsis genotypes deficient in the expression of the plastidic NAD+ transporter (NDT1) and WT plants.
Plants with reduced expression of AtNDT1 display alterations in the expression of genes involved in NAD+ metabolism
To provide further insight into the physiological role of AtNDT1, we analysed the expression levels of AtNDT1, AtNDT2, and AtPXN in WT and ndt1 − :ndt1 − plants by qRT‐PCR using RNA isolated from dry seeds, leaves, flowers and pollen grains. The analysis revealed a significant reduction in the AtNDT2 transcripts in flowers and pollen grains coupled with increases in the seeds of the ndt1 − :ndt1 − mutant compared with their WT counterparts (Figure S2). Moreover, a strong reduction in the expression of AtPXN was observed in the ndt1 − :ndt1 − pollen grains (Figure S2), while AtPXN expression levels were not significantly altered in seeds, leaves and flowers. These data therefore indicated that a reduced AtNDT1 expression in the ndt1 − :ndt1 − is associated with changes in the expression levels of AtNDT2 and AtPXN.
To further characterize the plants with reduced AtNDT1 expression, the expression of genes encoding NAD+ biosynthetic enzymes and NAD kinases was evaluated by qRT‐PCR using RNA isolated from seeds after 48 h of imbibition and leaves from 28‐day‐old rosette (Figure S3). The expression of genes encoding the NAD+ biosynthetic enzymes QPRT (quinolinate phosphoribosyltransferase) and NMNAT (nicotinate/nicotinamide mononucleotide adenyltransferase), as well as the genes encoding cytosolic (NADK1) and plastidic (NADK2) isoforms of NAD kinases in Arabidopsis was significantly higher in ndt1 − :ndt1 − seeds. These results suggested that, especially in imbibed seeds, the expression of genes related to the biosynthetic pathway of NAD+ is upregulated presumably in an attempt to compensate for the lower AtNDT1 expression. Conversely, expression of the genes encoding enzymes from NAD+ metabolism was only slightly lower in ndt1 − :ndt1 − mutant leaves (significantly only for the plastidic quinolinate synthase, QS) (Figure S3), which might have occurred as a consequence of different energetic requirements exhibited by seeds and leaves.
Effects of reduction in AtNDT1 expression on seed development and seed filling
As AtNDT1 is expressed in seeds and seedlings, we investigated whether AtNDT1 plays a role in seed development or seed filling. We observed that the silique size (Figures 2a,b and S4a) and the number of seeds per silique were lower for ndt1 − :ndt1 −, as‐1‐ndt1 and as‐2‐ndt1 lines (Figure 2c). Similarly, the total number of seeds per plant was also decreased in the mutant ndt1 − :ndt1 − line (Figure 2h), while seed size increased in these lines compared with WT (Figures 2d–f, and S4b). Moreover, the weight of one thousand seeds from these plants was also higher (Figure 2g), although the total seed weight per plant did not differ among the lines (Figure S4c).
Figure 2.
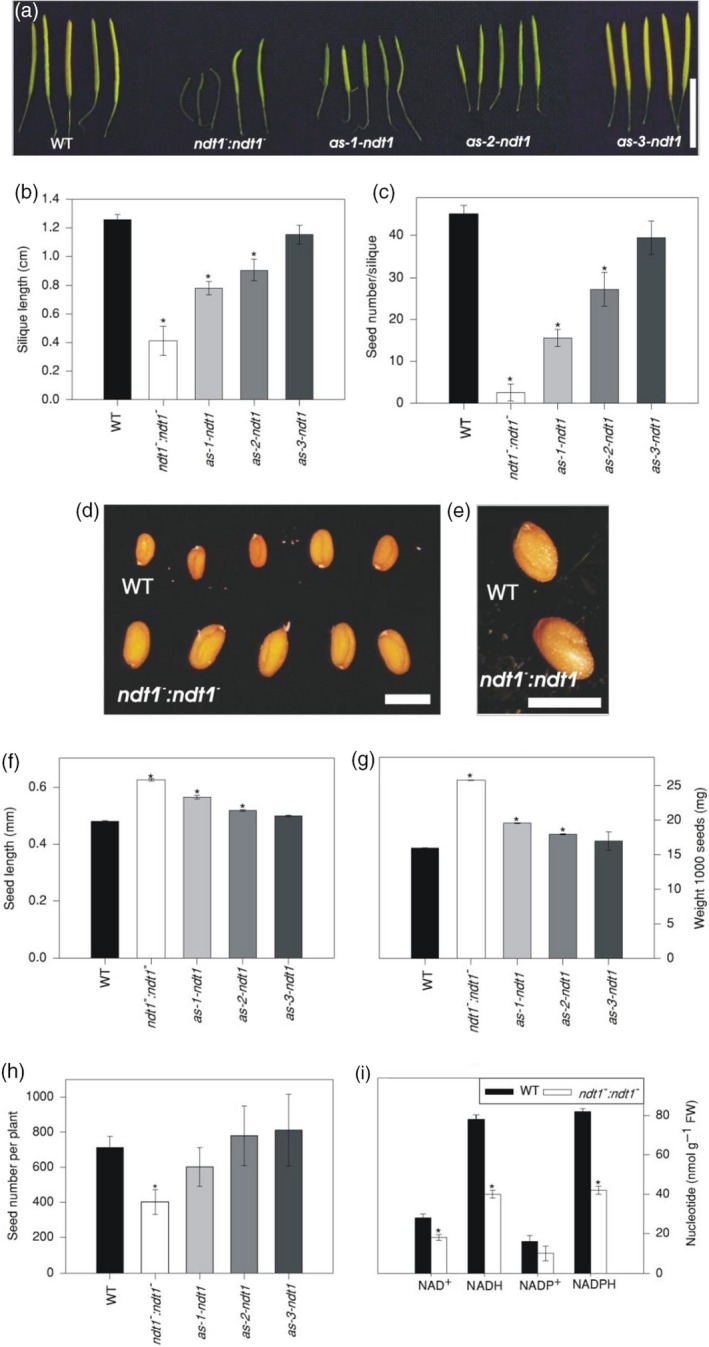
Phenotypic analysis of Arabidopsis thaliana genotypes deficient in the expression of the mitochondrial NAD+ transporter (NDT1) and wild type (WT) plants. (a) Siliques of all lines. (b) Silique length. (c) Seed number per silique. (d) Seeds of WT and ndt1−:ndt1− showing length differences. (e) Detail of WT and ndt1−:ndt1− seeds. (f) Seed length. (g) Weight 1000 seeds. (h) Seed number per plant. (i) Nucleotide levels in mature siliques. Values are presented as mean ± SE of six individual plants per line; an asterisk indicates values that were determined by t‐test to be significantly different (P < 0.05) from the WT. FW: fresh weight. Bar in (a) represents 1 cm; and in (d, e), and represent 1 mm.
To analyse the accumulation of storage compounds, we also determined lipid, carbohydrate, and protein contents in seeds. ndt1 − :ndt1 − mutant line displayed higher amounts of lipids in mature seeds (Figure S5a) and, after imbibition, significantly at 4 days post‐imbibition (Figure S5b). The starch content was also higher in ndt1 − :ndt1 − mature seeds (Figure S5c), while similar amounts of proteins (Figure S5d) was observed when compared with WT seeds.
Given the importance of NAD(P)H as a reducing power source for fatty acid biosynthesis, we further analysed how the reduction in the AtNDT1 expression impacts fatty acid profile in mature seeds (Figure S6). We detected a 2.7‐fold increase of the 14:0 fatty acid in the mutant line compared with WT (Figure S6a), suggesting that NAD+ import by AtNDT1 is required for the metabolism of fatty acids in seeds.
Effects of reduction in AtNDT1 expression on seed germination and seedling establishment
To investigate if the increased levels on the storage reserves in the ndt1 − :ndt1 − mature seeds have an effect on seed germination and seedling establishment, we evaluated the percentage of seed germination and number of abnormal seedlings. These analyses revealed that germination as well as the percentage of normal developing seedlings were reduced in the ndt1 − :ndt1 − line in comparison with WT (Figure S5g,h). In addition, the germination speed index (GSI) and emergence speed index (ESI) were significantly reduced in the ndt1 − :ndt1 − line (Figure S5e,f), indicating that AtNDT1 is an important component affecting seed germination and seedling development.
As NAD+ is necessary for the conversion of fatty acids into carbohydrates during storage lipid mobilization to drive seedling establishment (Bernhardt et al., 2012), we further evaluated the fatty acids profile in seedlings at 2, 4, and 6 days after imbibition. The TAG marker fatty acid in Arabidopsis is eicosenoic acid C20:1. Interestingly, we observed elevated C20:1 levels in 2‐day‐old, 4‐day‐old and 6‐day‐old mutant seedlings compared with WT, indicating that the repression of AtNDT1 led to an impaired storage oil mobilization during seedling establishment. Our data also demonstrated that the mutant is able to degrade C20:1, but the degradation rate is slowed down. The amounts of 20:2, 24:0, and 24:1 fatty acids were increased in 2‐day‐old ndt1 − :ndt1 − seedlings (Figure S6b). At 4 days after stratification, the fatty acids 14:0 and 20:1a were higher in the mutant seedlings (Figure S6c). In 6‐day‐old seedlings, higher levels of 14:0, 16:2, 16:3, 18:2, 18:3, 20:2, and 20:1a were observed for ndt1 − :ndt1 − line compared with WT (Figure S6d). These results suggested that the mobilization of the storage reserves for seed germination rate and seedling establishment is impaired in the mutant plants.
Effects of reduction in AtNDT1 expression in pollen
Considering the observed reduction in seed number per silique and the higher expression of AtNDT1 in the pollen, we evaluated if this phenotype could be a consequence of lower pollen viability, pollen tube growth, effects of lower expression of AtNDT1 on maternal tissues or impaired embryo development. Comparing WT, ndt1 − :ndt1 −, as‐1‐ndt1, and as‐2‐ndt1 pollen grains by stereomicroscopy revealed lower pollen grain viability in plants with reduced AtNDT1 expression reaching only 50, 64, and 89% of the WT values for the ndt1 − : ndt1 −, as‐1‐ndt1, and as‐2‐ndt1 lines, respectively (Figures 3a and S7). Further analysis revealed that pollen germination and tube growth were also affected in the ndt1 − : ndt1 − line (Figure S8). In agreement with these results, in silico analysis of the AtNDT1 gene expression pattern by using the Arabidopsis eFP Brower (Winter et al., 2007; http://bar.utoronto.ca/efp/cgi-bin/efpWeb.cgi), indicated that AtNDT1 is highly expressed in the later stages of pollen development and following germination (Figure S9a,b).
Figure 3.
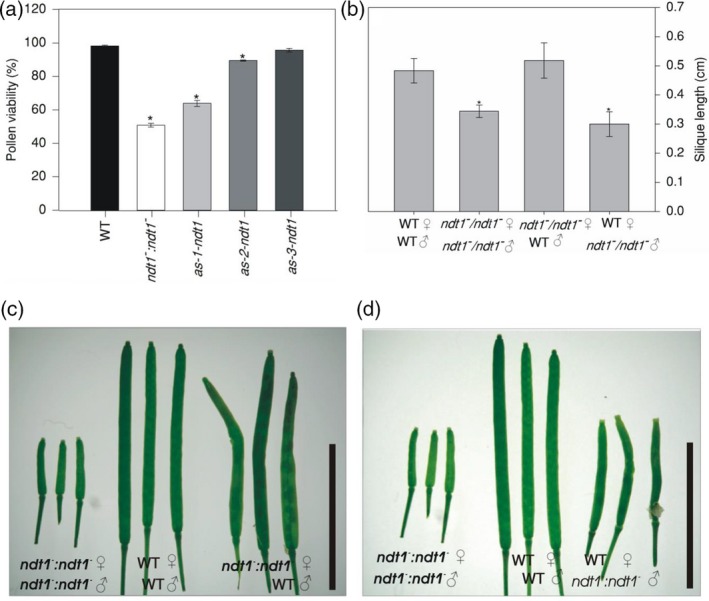
Pollen viability and crossing mutants analyses for phenotypic reestablishment of Arabidopsis thaliana genotypes deficient in the expression of the mitochondrial NAD+ transporter (NDT1) and wild type (WT) plants. (a) Pollen viability. (b) Silique length in different crossings. (c) Crossing with ndt1−:ndt1− female donor and WT pollen grain donor and controls. (d) Crossing with WT female donor and ndt1−:ndt1− pollen grain donor and controls. Eight crossings were done for each combination and asterisk indicates values that were determined by Student's t‐test to be significantly different (P < 0.05) comparing WT female donor and WT pollen grain donor with the others crossing. Bars represents 1 cm.
To better understand the reasons underlying the ndt1 − :ndt1 − seed phenotype, we pollinated ndt1 − :ndt1 − mutants using WT pollen (Figure 3b). Manual pollination of WT (female donor) with ndt1 − :ndt1 − pollen (male donor) gave rise to shorter siliques (Figure 3d), while siliques developing on plants in which WT pollen served as male donor used to pollinate ndt1 − :ndt1 − (female donor) had no discernible difference in length compared with WT plants (Figure 3c). Therefore, the complementation of ndt1 − :ndt1 − stigmas with WT pollen suggested that male gametophyte and pollen development are sensitive to the reduced AtNDT1 transport activity. Collectively, our results supported the important contribution of AtNDT1 to pollen viability.
AtNDT1 repression enhanced growth and photosynthesis in Arabidopsis plants
The general impact of the reduced expression of AtNDT1 on vegetative plant growth was studied in detail regarding leaf morphology and photosynthesis. AtNDT1 T‐DNA insertion and antisense lines were grown under short‐day conditions side by side with WT plants. No differences in the visible phenotype could be identified in 4‐week‐old plants with reduced AtNDT1 expression (Figure 1c). However, a detailed analysis of the growth parameters revealed significant differences between the transgenic lines when compared with WT (Table 1). The ndt1 − :ndt1 − and as‐1‐ndt1, the antisense lines with the strongest reduction in AtNDT1 expression, displayed a higher leaf number (LN) along with increases in the total leaf area (TLA), specific leaf area (SLA), rosette leaf area (RLA), and root system dry weight (RDW). For ndt1 − :ndt1 −, the specific rosette area (SRA) was also significantly increased compared with WT. For the two other genotypes, representing a lesser reduction in AtNDT1 transcript, only LN (as‐2‐ndt1, as‐3‐ndt1) and SLA (as‐2‐ndt1) were increased compared with WT.
Table 1.
Growth parameters of 4‐week‐old Arabidopsis genotypes deficient in the expression of the mitochondrial NAD+ transporter (NDT1) and wild type (WT) plants
| Parameter | WT | ndt1 − :ndt1 − | as‐1‐ndt1 | as‐2‐ndt1 | as‐3‐ndt1 |
|---|---|---|---|---|---|
| RDW | 50.0 ± 3.0 | 90.0 ± 3.0 | 80.0 ± 3.0 | 60.0 ± 8.0 | 60.0 ± 4.0 |
| RSDW | 10.0 ± 3.0 | 20.0 ± 3.0 | 20.0 ± 4.0 | 10.0 ± 4.0 | 10.0 ± 3.0 |
| RRS | 0.17 ± 0.02 | 0.18 ± 0.02 | 0.20 ± 0.01 | 0.17 ± 0.01 | 0.19 ± 0.01 |
| LN | 13.7 ± 1.4 | 19.2 ± 1.5 | 23.0 ± 0.3 | 21.0 ± 1.5 | 19.8 ± 1.3 |
| TLA | 14.64 ± 1.4 | 27.27 ± 1.5 | 20.42 ± 0.8 | 19.95 ± 2.2 | 18.65 ± 1.3 |
| SLA | 241 ± 24 | 320 ± 14 | 306 ± 9 | 331 ± 17 | 269 ± 15 |
| RLA | 12.8 ± 1.6 | 25.7 ± 1.2 | 19.5 ± 0.6 | 16.7 ± 1.9 | 16.8 ± 0.6 |
| SRA | 225 ± 51 | 303 ± 11 | 266 ± 5 | 279 ± 25 | 252 ± 12 |
| Stomatal density | 138.4 ± 4.8 | 117.9 ± 3.3 | 117.9 ± 2.4 | 121.9 ± 5.2 | 136.6 ± 10.1 |
RDW, rosette dry weight (mg); RSDW, root system dry weight (mg); RRS, root/shoot ratio; LN, leaf number; TLA, total leaf area (cm2); SLA, specific leaf area (cm2 g−1); RLA, rosette leaf area (cm2); SRA, specific rosette area (cm2 g−1) and stomata density (stomatal number mm−2).
Values are presented as means ± SE of determinations on six individual plants per line; bold type values were determined using Student's t‐test to be significantly different (P < 0.05) from the WT.
To investigate if the repression of AtNDT1 affects photosynthesis, several photosynthetic parameters were measured in the mutant plants. A reduced AtNDT1 expression did not alter CO2 assimilation rates at 400 μmol photons m−2 sec−1 (Figure 4a), or at 100 μmol photons m−2 sec−1 (Figure S10a,b). The parameters obtained from the light response curves (Figure S10a) were similar to WT when calculated as per unit of leaf area (Table S1). We further normalised the photosynthetic rates to be expressed per unit of mass, taking the leaf mass and thickness into account, sas increased SLA was observed in the mutant lines (Table 1). Interestingly, photosynthetic rates increased significantly in the ndt1 − :ndt1 − and as‐1‐ndt1 plants (Figure 4b), whereas stomatal conductance (g s), internal CO2 concentration (C i), transpiration (E), photorespiration (R i), and stomatal density decreased in the NDT1 deficient plants (Figure 4c–f). Furthermore, non‐photochemical quenching (NPQ) increased in ndt1 − :ndt1 −, as‐1‐ndt1, as‐2‐ndt1 and as‐3‐ndt1 plants relative to WT plants under 400 μmol photons m−2 sec−1 and higher light intensities (Figure 4g; Figure S11). In contrast, the electron transport rate (ETR), maximum quantum efficiency of photosystem II (F v/F m), the instantaneous water use efficiency (A/E), and intrinsic water use efficiency (A/g s) did not change significantly compared with WT (Figure S10c–f). These results indicated that the enhanced growth of the ndt1 mutant plants is linked with an increased photosynthetic activity.
Figure 4.
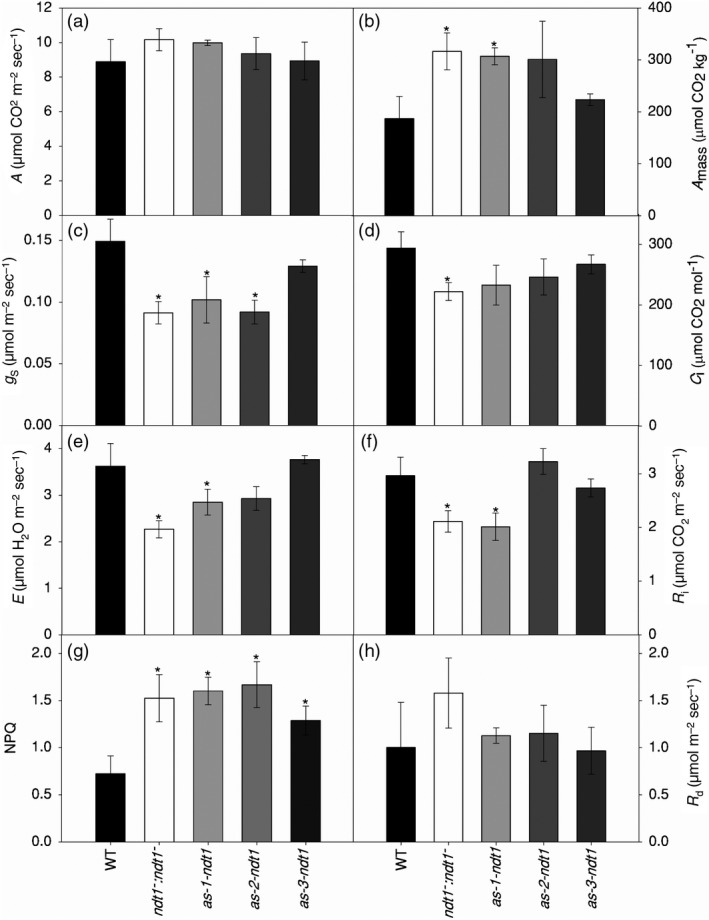
Gas exchange and chlorophyll a fluorescence parameters in 4‐week‐old Arabidopsis thaliana genotypes deficient in the expression of the mitochondrial NAD+ transporter (NDT1) and wild type (WT) plants. (a) Assimilation rate (A) per area unit at 400 μmol photons m2 s−1. (b) Assimilation rate (A mass) per mass unit at 400 μmol photons m−2 sec−1. (c) Stomatal conductance (g s). (d) Internal CO2 concentration (C i). (e) Transpiration (E). (f) Photorespiration (R i). (g) Nonphotochemical quenching (NPQ). (h) Dark respiration (R d). Values are presented as mean ± SE of six individual plants per line; an asterisk indicates values that were determined by t‐test to be significantly different (P < 0.05) from the WT.
Reduction of AtNDT1 expression affected starch and sugar accumulation and altered cellular redox poise in leaves
To evaluate the putative metabolic changes caused by AtNDT1 silencing in fully expanded leaves, compounds related to carbon and nitrogen metabolism were measured throughout the diurnal cycle. Plants with reduced AtNDT1 transcript levels accumulated more starch at the end of the light period (Figure 5a). Accordingly, increased starch synthesis and starch degradation rates were observed for the mutant plants (Figure 5b,d). Glucose and sucrose levels were higher in the ndt1 − :ndt1 − mutant plants in the middle and in the end of the light period (Figure 5c,f), while fructose levels remained unaltered (Figure 5e). Interestingly, malate and fumarate contents also increased throughout the day in the ndt1 − :ndt1 −, as‐1‐ndt1, and as‐2‐ndt1 plants (Figure 5g,h). Protein content was increased in the ndt1 − :ndt1 − line at the end of the light period (Figure S12), whereas plants with low AtNDT1 expression levels did not display altered chlorophyll levels (Figure S13).
Figure 5.
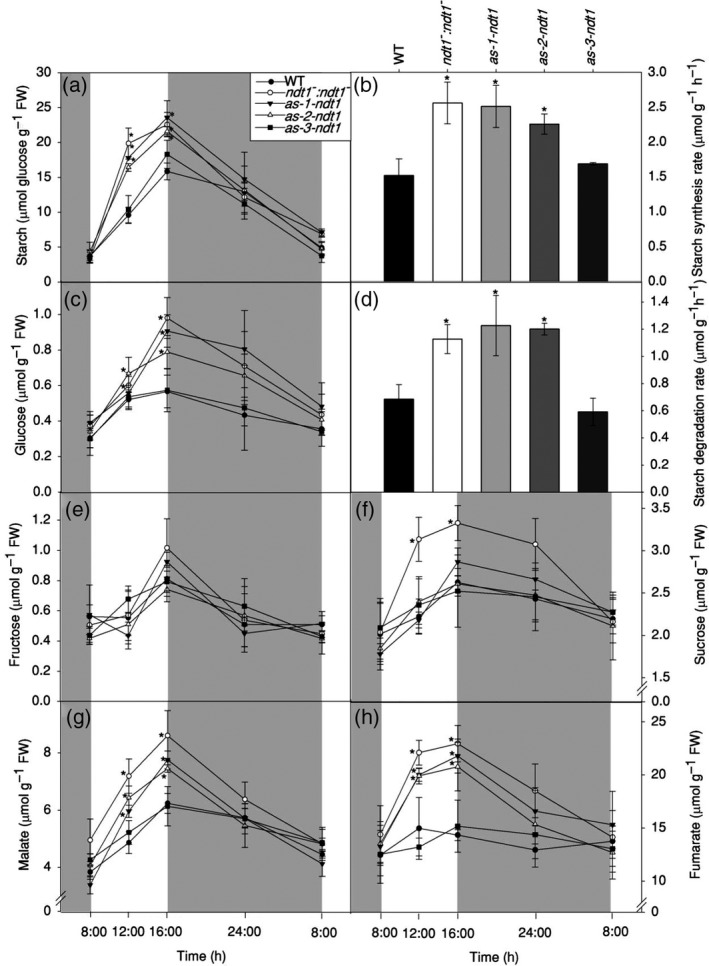
Leaf metabolite levels of 4‐week‐old Arabidopsis thaliana genotypes deficient in the expression of the mitochondrial NAD+ transporter (NDT1) and wild type (WT) plants. (a) Starch. (b) Starch synthesis rate. (c) Glucose. (d) Starch degradation rate. (e) Fructose. (f) Sucrose. (g) Malate. (h) Fumarate. Values are presented as mean ± SE of six individual plants per line; an asterisk indicates values that were determined by t‐test to be significantly different (P < 0.05) from the WT. Grey areas represent the dark period. FW: fresh weight.
A non‐targeted metabolic profile analysis identified additional effects in leaf samples harvested in the middle of the light period (Table S2). Among the successfully annotated metabolites, sugars and related compounds differed markedly in the lines with low AtNDT1 expression. AtNDT1 silencing led to elevated levels of glucose (significantly in all lines), fructose (significantly in ndt1 − :ndt1 − and as‐3‐ndt1 lines), and galactinol (significantly in ndt1 − :ndt1 −, as‐2‐ndt1 and as‐3‐ndt1 lines). Additionally, glutamate (significantly in ndt1 − :ndt1 − and as‐1‐ndt1 lines), leucine (significantly in ndt1 − :ndt1 − line), sorbose (significantly in ndt1 − :ndt1 − line), erythritrol (significantly in ndt1 − :ndt1 − line), and myo‐inositol (significantly in ndt1 − :ndt1 − and as‐3‐ndt1 lines) levels were elevated in the AtNDT1 silencing lines. Furthermore, the levels of ascorbate were also increased in leaves of ndt1 − :ndt1 − and as‐1‐ndt1 lines.
An analysis of the pyrimidine nucleotide pools in leaves (Figure 6) revealed a significant decrease in the contents of NAD+ in ndt1 − :ndt1 −, as‐1‐ndt1, and as‐2‐ndt1 lines (Figure 6a), while the levels of NADP+, NADH and NADPH increased in the same lines compared with WT (Figure 6b–d). Furthermore, the sum of NAD+ and NADH decreased, while the NADP+ plus NADPH increased significantly in ndt1 − :ndt1 −, as‐1‐ndt1, and as‐2‐ndt1 (Figure 6e–f). Interestingly, a higher NADH/NAD+ ratio was observed in these lines compared with WT (Figure 6g), while the NADPH/NADP+ ratio was not significantly altered (Figure 6h). To confirm changes in the cellular redox state in the mutant plants, we evaluated the activation state of NADP‐dependent malate dehydrogenase (NADP‐MDH) (Table 2), a key redox‐regulated enzyme controlling the malate valve, which exports reducing equivalents indirectly from chloroplasts. We observed an increase in the NADP‐MDH activation state in mutant leaves, which was significantly different for ndt1 − :ndt1 − and as‐1‐ndt1. The significant increase in the maximal NADP‐MDH activity corroborated well with the increased NADPH (Figure 6d) and malate levels (Figure 5g) found in plants with reduced expression of AtNDT1. Altogether, these results suggested that the cellular redox state is changed as a consequence of the reduced expression of AtNDT1.
Figure 6.
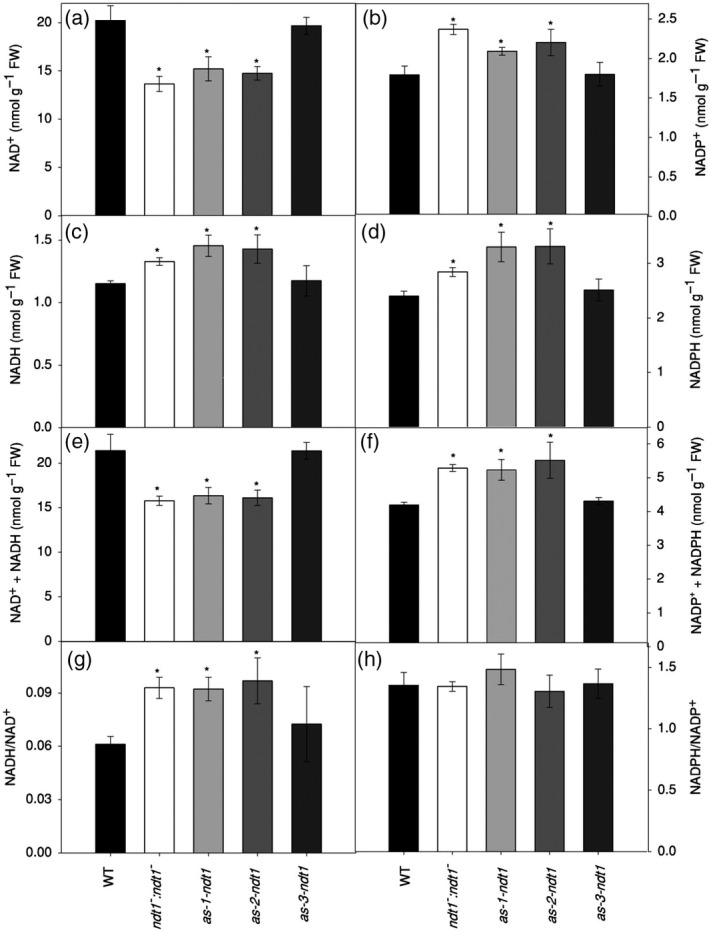
Changes in nucleotide levels in fully expanded leaves of 4‐week‐old Arabidopsis thaliana genotypes deficient in the expression of the mitochondrial NAD+ transporter (NDT1) and wild type (WT) plants, collected at midday. (a) NAD+. (b) NADP+. (c) NADPH. (d) NADPH. (e) NADH/NAD+ ratio. (f) NADPH/NADP+ ratio. Values are presented as mean ± SE of six individual plants per line; an asterisk indicates values that were determined by t‐test to be significantly different (P < 0.05) from the WT. FW: fresh weight.
Table 2.
NADP‐dependent malate dehydrogenase (NADP‐MDH) of 4‐week‐old Arabidopsis mutants deficient in the expression of the mitochondrial NAD+ transporter (NDT1) and wild type (WT) plants
| Enzymes | WT | ndt1 − :ndt1 − | as‐1‐ndt1 | as‐2‐ndt1 | as‐3‐ndt1 |
|---|---|---|---|---|---|
| NADP‐MDH initiala | 12.7 ± 0.2 | 13.5 ± 0.2 | 12.8 ± 0.7 | 13.2 ± 0.5 | 12.8 ± 0.4 |
| NADP‐MDH totala | 16.0 ± 0.5 | 14.8 ± 0.3 | 14.3 ± 0.7 | 15.6 ± 1.0 | 14.7 ± 0.9 |
| NADP‐MDH activation stateb | 79.7 ± 2.0 | 91.2 ± 1.4 | 89.6 ± 3.6 | 85.2 ± 3.2 | 87.6 ± 2.9 |
Activities were determined in whole rosettes harvested at the middle of the photoperiod. Values are presented as mean ± SE (n = 6); values in bold type in mutant plants were determined by using Student's t‐test to be significantly different (P < 0.05) from the WT.
FW, fresh weight.
μmol min−1 g−1 FW.
Percentage of NADP‐MDH total.
Subcellular localization of AtNDT1‐GFP revealed its mitochondrial localization
AtNDT1 was presumed to exclusively reside in the chloroplast membrane (Palmieri et al., 2009). However, this protein was recently found in mitochondrial membranes in proteome studies (Senkler et al., 2017) and a previous GFP‐tagging and immunolocalization study was not able to find AtNDT1 targeted to chloroplast membranes (Bedhomme et al., 2005). In addition, many phenotypic changes (described above) caused by AtNDT1 downregulation did not directly support that AtNDT1 functions in the chloroplast but rather suggested an increase in chloroplast import of NAD+ at the expense of deficient mitochondria import. Considering these facts, we decided to re‐evaluate the subcellular localization of AtNDT1. To provide experimental evidence on the subcellular localization of AtNDT1 and AtNDT2, we generated corresponding GFP fusions under the control of the ubiquitin 10 promotor (Grefen et al., 2010) and expressed the recombinant proteins in Arabidopsis seedlings. Both AtNDT1‐ and AtNDT2−GFP fusion proteins were exclusively localized in the mitochondria (Figure 7), indicating their mitochondrial localization.
Figure 7.
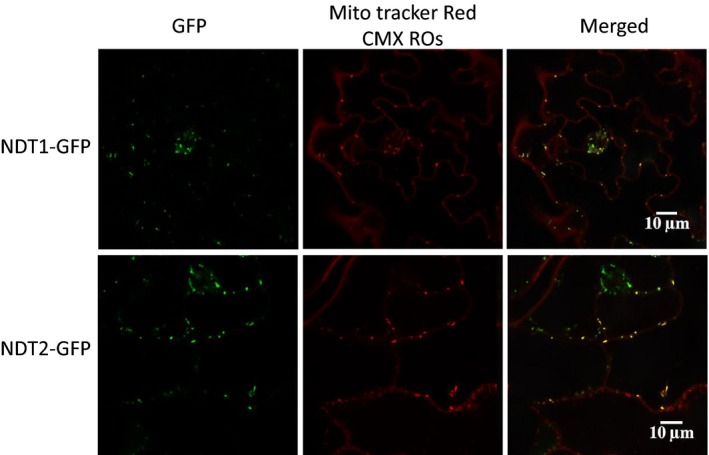
Localization of AtNDT1 and AtNDT2 by confocal laser scanning microscopy (CLSM). Arabidopsis plants were stable transformed with C‐terminal GFP fusions of NDT1 (upper panel) and NDT2 (lower panel), respectively. Whole seedlings were analyzed by CLSM. The left panel shows the GFP‐specific fluorescence signal (green) while the middle panel shows the localization of the mitochondrial Mito tracker Red CMX ROs (red). The right panel represents the merged image of both channels revealing an overlay of the fluorescent signals (yellow) indicating a mitochondrial localization of NDT1 and NDT2.
Discussion
AtNDT1 has a mitochondrial localization in Arabidopsis
It has been previously described that AtNDT1 protein resides in the chloroplast membrane (Palmieri et al., 2009). Intriguingly, however, both AtNDT1 and AtNDT2 have been found in mitochondria by a recent proteome study (Senkler et al., 2017) and could not be localized to plastids by earlier GFP‐tagging and/or immunolocalization studies (Bedhomme et al., 2005). Moreover, our results revealed unexpected physiological features exhibited by AtNDT1 downregulated lines that are not consistent with the proposed chloroplastic localization of AtNDT1. For instance, the higher photosynthetic rates (Figure 4), the increased NADP+ and NADPH contents in leaves (Figure 6), and the higher accumulation of sugar and starch at the end of the light period in the mutants (Figure 5) in comparison with their WT counterparts implicated an increase in the chloroplast import of NAD+. The observed increase in the activation state of the plastidic NADP‐MDH (Table 2) also contradicted the proposed chloroplastidic localization of AtNDT1.
Given that the information on correct subcellular localization is essential to deduce the effect of a protein on metabolism (Kirchberger et al., 2008), we re‐investigated the question in which membrane AtNDT1 resides. Considering the similarities in the biochemical properties of AtNDT1 and AtNDT2, Arabidopsis plants were stably transformed with C‐terminal GFP fusions of either AtNDT1 or AtNDT2. Both AtNDT1‐ and AtNDT2‐GFP fusion proteins were found to exclusively localize in the mitochondria (Figure 7). Considering the discrepancy with some of the earlier work on this protein, we can only speculate the possible reasons why previous studies (Palmieri et al., 2009) failed to detect NDT1 proteins in the mitochondrial compartment. The fact that the previously published chloroplast membrane location of AtNDT1 was deduced from interpretation of the location of an AtNDT1‐GFP fusion protein transiently expressed in tobacco leaf protoplasts (Palmieri et al., 2009) and not in Arabidopsis plants may possibly explain why previous investigations failed to detect the mitochondrial localization of AtNDT1–GFP proteins. Based on these findings, we proposed to re‐evaluate the physiological roles of AtNDT1 within plant cells and its connection to metabolic and redox‐mediated control of cellular processes in light of its newly found mitochondrial localization.
AtNDT1 is involved in the cellular NAD+ homeostasis
The fact that the pyridine pools are to some extent interdependent (Agledal et al., 2010) raises the question of the very large range of possible consequences of the decreased NAD+ import into mitochondria. Therefore, to investigate the role of the mitochondrial NAD+ carrier AtNDT1, we analyzed the phenotypes of corresponding Arabidopsis mutant and antisense plants. Here, we show that plants with lower expression of the AtNDT1 displayed reductions in the NAD+ levels in leaves (Figure 6a) and in siliques (Figure 2i), whereas the levels of NADH, NADP+ and NADPH were increased (Figure 6b–d, respectively). Furthermore, the ratio NADH/NAD+ was shown to be augmented in plants that carried reductions in AtNDT1 expression, leading these plants to a more reduced state (Figure 6g). That said, the observed reduction in the levels of NAD+ may also be associated with changes in the rate of NAD+ biosynthesis in the plants with reduced AtNDT1 expression. In bacteria, regulation of NAD+ levels occurs at the level of transcription (Penfound and Foster, 1999). These organisms contain genes belonging to NAD+ biosynthesis organized in operons and the content of NAD+ regulates their expression (Penfound and Foster, 1999). However, little information is known about the regulation of NAD+ content at the level of gene expression in plants. Therefore, to test whether altered NAD+ content in plants with decreased expression of AtNDT1 would influence gene expression, we quantified the expression levels of genes that encoded enzymes belonging to NAD+ salvage and de novo pathways (Figure S3). This analysis revealed that ndt1 − :ndt1 − plants displayed differential expression of genes encoding the NAD+ biosynthetic pathway; QPRT and NMNAT showed higher expression in imbibed seeds, while QS expression was reduced in ndt1 − :ndt1 − leaves. Furthermore, higher expression of AtNDT2 in imbibed seeds and a minor increase in leaves (Figure S2) of ndt1 − :ndt1 − line, was observed. Higher AtNDT2 expression may be acting as a compensatory mechanism for NAD+ import into mitochondria in plants carrying reduced AtNDT1 expression; which implied that AtNDT1 and AtNDT2 may have overlapping functions in the NAD+ transport in seeds and leaves. Moreover, these results suggested that NAD+ metabolism and transport in the mitochondrion and peroxisome were modified in those plants. Interestingly, NADP+ and NADPH levels were increased with decrease in the sum of NAD+ and NADH (Figure 4), indicating that NAD+ phosphorylation is likely to be promoted by AtNDT1 downregulation. Given that we found no changes in the expression of the NAD kinases (NADK1‐3) in leaves (Figure S3b), and considering the mild increase of AtNDT2 expression (which was strongly expressed in NDT1 mutant seeds), it can be presumed that the compensatory increased expression of the mitochondrial NAD+ carrier AtNDT2 is mainly responsible for the observed rise in the NADH/NAD+ ratio in the leaves of AtNDT1 mutants. Taken together, these results suggested that AtNDT1 is likely to play an important role in the cellular NAD+ homeostasis in plants by linking pyridine nucleotide pools in different subcellular compartments. Therefore, as a consequence of AtNDT1 downregulation, whole NAD+ metabolism and transport could be re‐balanced.
Reduced AtNDT1 expression impacts carbon metabolism turnover in the light and photosynthesis
Here, we show that the reduction in AtNDT1 expression influenced processes that take place in chloroplasts, suggesting that there is a precise communication between organelles regarding NAD+ levels in subcompartments. We demonstrated that the downregulation of AtNDT1 increased the photosynthetic rate per unit of mass (Figure 4b), impacted leaf carbon metabolism (Figure 5), and enhanced plant growth (Table 1). Moreover, NPQ was increased in ndt1 − :ndt1 −, as‐1‐ndt1, as‐2‐ndt1 and as‐3‐ndt1 plants under high light (400–1200 μmol photons m−2 sec−1) (Figure S10), which would imply a decrease in chloroplastic NADP+ levels under these conditions (Takahashi et al., 2006). This finding is in line with the observed increase in the activation state of the plastidic NADP‐MDH (Table 2), as this enzyme uses excess NADPH to regenerate the electron acceptor NADP+ and is inhibited by the product NADP+ (Scheibe, 2004). In support of this hypothesis, plants with reduced AtNDT1 expression exhibited a higher NADH/NAD+ ratio (Figure 6a) and increase in NADPH in leaves (Figure 6d).
Redox regulation is the preferred strategy for plastidic enzymes to regulate a range of metabolic processes such as carbon fixation, starch metabolism, lipid synthesis and amino acid synthesis (Geigenberger et al., 2005). The time course analysis provided here clearly demonstrated a pronounced accumulation of glucose, starch, fumarate, and malate during the day, but not at night, in leaves of the mutants with reduced AtNDT1 expression (Figure 5). Taking into account that NADP‐MDH is a redox‐controlled enzyme only active in the light, these results reinforced the hypothesis that the malate valve is being used by the mutants to balance cellular energy supply (Scheibe, 2004). Furthermore, the increase in the activation of NADP‐MDH and in NPQ values indicated that low AtNDT1 expression led to a energetic reduced state of the chloroplast that could be associated with the increase in starch biosynthesis (Figure 5b) and photosynthesis per mass unit (Figure 4b).
Photosynthetic capacity may be limited either by biochemical or diffusive processes. The first refers to CO2 fixation by RuBisCO and the second to stomatal and mesophyll resistances that CO2 can encounter during its diffusion from the atmosphere to the carboxylation sites in the chloroplasts (Flexas et al., 2008). The reverse of stomatal resistance is g s and changes in this parameter may occur in parallel with changes in stomatal density (Tanaka et al., 2013). Despite decreases in stomatal density (Table 1) and g s (Figure 4c) in the mutant lines, the increases in photosynthesis demonstrated that the mutant plants maintained the synthesis of NADP+ required for photochemical reactions that might be explained by the indirect transfer of redox equivalents by redox shuttles from the cytosol across the chloroplast membrane. Curiously, reduced AtNDT2 expression negatively affected photosynthetic efficiency as a result of a lowered stomatal density and conductance (unpublished work). This apparent contradiction can be explained by the fact that AtNDT1 expression is much higher than AtNDT2 in leaves (Figure S2). Therefore, the entire NAD+ metabolism and transport seems to be reorganized in AtNDT1 downregulated lines in a more extended way than that in AtNDT2 mutant lines, in a manner that enables greater transfer of redox power for photochemical reactions, therefore compensating lower stomatal conductance and density in leaves of AtNDT1 downregulated lines.
AtNDT1 was highly expressed in guard cells (Figure S9c); this finding is in line with the lower stomatal conductance observed in ndt1 − :ndt1 − plants in our study (Figure 4c). It has been shown that NAD+ levels are reduced in response to the generation of ROS induced by abscisic acid (ABA), which acts as a signal for stomatal closure (Hashida et al., 2010). Therefore, considering the association of NAD+ metabolism to stomatal function, the results presented here suggested that NAD+ is important not only for stomatal movements, but that NAD+ transport also acts in regulating guard cell biogenesis.
Repression of AtNDT1 affects pollen viability
It has been demonstrated that pollen maturation and tube growth are dependent on energy produced by mitochondrial respiration and plastid glycolysis (Selinski and Scheibe, 2014). Recently, it has been shown that NADPH provision via the OPPP in peroxisomes is also needed for gametophytic interaction during pollen tube guidance to ovules (Hölscher et al., 2016). Therefore, it is clear that energy metabolism during pollen maturation and tube growth is highly complex and involves different pathways and cell compartments and, as NAD+ supply is essential for reduction related reactions, NAD+ transport is necessary. For example, deficiency in the plastidic glycolytic glyceraldehyde‐3‐phosphate dehydrogenase, an enzyme that reversibly converts the glyceraldehyde‐3‐phosphate to 1,3‐bisphosphoglycerate, with the reduction of NAD+ to NADH, displays male sterility in Arabidopsis, due to a disorganized tapetum cell layer (Muñoz‐Bertomeu et al., 2010). Furthermore, NAD(P)H accumulation during the growth of the pollen tube is directly coupled to ATP generation, which is used to enable a variety of energy‐dependent processes localized in the pollen tube tip (Cárdenas et al., 2006).
Recent studies using mutants deficient in NAD+ biosynthesis demonstrated a functional importance of NAD+ in reproductive tissues such as pollen, floral meristem, siliques and seeds (Hashida et al., 2007, 2013; Hunt et al., 2007; Liu et al., 2009). Here, we demonstrated that AtNDT1 silencing promoted a decrease in pollen viability and pollen tube growth (Figures 3a, S7 and S8). Cumulative evidence supports the importance of NAD+ metabolism in pollen grain formation and pollen tube growth (Berrin et al., 2005; Chai et al., 2005, 2006; Cárdenas et al., 2006; Hashida et al., 2009). In freshly harvested dry pollen, NAD+ is accumulated, whereas it dramatically decreased immediately after water contact (Hashida et al., 2013). Furthermore, several metabolic pathways, which operate during maturation of pollen grains and pollen tube growth such as the biosynthesis of lipids, components of cell walls, and amino acids, are highly dependent on NAD+ levels (Hashida et al., 2009). At the same time, the occurrence of high NAD+ levels can maintain dormant pollen grains by competitive inhibition of NADH‐dependent redox reactions that are essential for the formation of the pollen tube (Hashida et al., 2013). Accordingly, the formation of non‐viable pollen as found in our study and the strong expression of AtNDT1 in pollen during the later stages of development and following germination (Figure S9) confirmed that AtNDT1 is of fundamental importance for pollen formation and germination.
In this study, we have shown that decreased AtNDT1 expression also resulted in reduced expression of AtPXN and AtNDT2 in pollen grains (Figure S2). This result indicated that reduction in NAD+ import by AtNDT1 may also impact the NAD+ import by AtNDT2 and AtPXN and this may possibly disturb the whole cell NAD+ balance in pollen. It deserves special mention that AtNDT2 expression is dramatically lower than AtNDT1 in the pollen of WT Arabidopsis (Figure S2), meaning that emerging phenotypes in pollen could directly result from AtNDT1 downregulation.
Seed germination and seedling establishment are impaired due to AtNDT1 repression
The decreased viability of pollen grains observed in plants with low AtNDT1 expression probably contributed to the significant reduction in the number of seeds and the resulting reduction in siliques filling and lower length and diameter of the siliques (Figures 2 and S4). The production of shorter siliques can be ascribed to misfunctional male gametophytes (Hashida et al., 2013). It was recently found that mutant plants deficient in the expression of nicotinamide mononucleotide adenylyltransferase (NMNAT), an important enzyme in NAD+ biosynthesis, produced non‐viable pollen grains, shortened siliques, and smaller numbers of seeds per plant (Hashida et al., 2013). These authors did not comment on the mechanism that led to the shortening of siliques, although, consistent with our observations, they showed that it may be a result of pollen germination and malformation of the pollen tube, due to the lower concentration of NAD+ found in the mutants.
The lower number of seeds in ndt1 − :ndt1 − plants suggested that, in addition to NAD+ metabolism, mitochondrial NAD+ transport is also important during embryonic development. As the concentration of nucleotides decreased in mature siliques (Figure 2i), we may assume that resources allocated to the zygote were impaired. As a result, fewer seeds were generated, however the seeds produced received a greater amount of carbohydrates, explaining the larger seed size in ndt1 − :ndt1 −, as‐1‐ndt1 and as‐2‐ndt1 plants (Figures 2 and S4b).
Interestingly, the repression of AtNDT1 expression was associated with a higher amount of lipids per seed (Figure S5a). It is well known that Arabidopsis seeds have high fatty acid content (~35% by weight; Baud et al., 2002), which serve as a carbon and energy reserve. Accordingly, the increase in lipid content per seed was followed by a mild but non‐significant increase in starch contents in ndt1 − :ndt1 − seeds, without changes in the protein level (Figure S5c,d). Taken together, these results suggested that the remaining seeds apparently exerted a higher sink strength and therefore accumulated a higher amount of storage compounds when the AtNDT1 expression was reduced. Additionally, the relative concentration of fatty acids alongside seedling development was generally higher in the ndt1 − :ndt1 − line (Figure S6). As NAD+ is required for β‐oxidation during lipid mobilization and seedling development (Bernhardt et al., 2012), it is suggested that NDT1 mutant seeds fail to mobilize lipids possibly as a consequence of an impaired fatty acid β‐oxidation. Therefore, the delay in seed germination and impaired fatty acid degradation (β‐oxidation) may also indicate changes in the peroxisomal NAD+ status in the ndt1 − :ndt1 − line. Additionally, given that seed dormancy may be regulated by the relative levels of pyridine nucleotides (Hunt and Gray, 2009), it is possible that the reduced germination rates observed (Figure S5) are related to alterations in the levels of NAD(P)(H) in the mutant siliques (Figure 2i).
AtNDT1 and AtNDT2 show varying degrees of redundancy and specialization
The demonstration that both NDT1 and NDT2 are localized in the mitochondria of Arabidopsis raises questions about their exact roles in vivo. Therefore, to ascertain the individual contributions of AtNDT1 and AtNDT2 to metabolism, it is important to reconsider previously reported biochemical features of the two carriers (Palmieri et al., 2009). First, AtNDT1 and AtNDT2 genes exhibited high structural similarities and their encoded proteins shared a number of similar transport properties, with both accepting AMP and ADP as highly efficient counter‐exchange substrates for NAD+. Second, it is assumed that they derive from a common evolutionary ancestor; this assumption could explain similarities in their biochemical properties (Palmieri et al., 2009). Third, in spite of these functional similarities, AtNDT1 and AtNDT2 have different kinetic constants, with different levels of activity and affinities for NAD+ (Palmieri et al., 2009). In addition, it should be recalled that AtNDT1 and AtNDT2 display distinct tissue‐specific expression patterns. For instance, gene expression analysis of AtNDT1 and AtNDT2 by qRT‐PCR (Figure S2) demonstrated much higher expression of AtNDT1 than AtNDT2 in seeds, leaves, flowers and pollen, therefore suggesting that AtNDT1 is the dominant NDT isoform in A. thaliana in these tissues. In addition, gene expression analysis of AtNDT1 and AtNDT2 (Figure S2), and depicted by the publicly available data in Arabidopsis eFP Browser, demonstrated that the highest expression of AtNDT1 occurs in pollen grains in comparison with its expression in seeds, leaves and flowers. Another aspect to be pointed out is that the T‐DNA insertion lines for AtNDT1 and AtNDT2 showed reductions in pollen grain viability of approximately 50% and 13%, respectively, in relation to the corresponding WT. Altogether, these data suggested that the formation of non‐viable pollen in AtNDT1 downregulated lines is mainly a result of AtNDT1 downregulation. Moreover, given that decreased AtNDT1 expression also resulted in lower expression of AtNDT2 in pollen grains (Figure S2), it seems that, at least in pollen, AtNDT2 does not compensate for AtNDT1 deficiency. Notwithstanding, the mutant plants for either AtNDT1 or AtNDT2 exhibited reductions in pollen viability, seed germination, stomatal density and conductance, indicating that the activities of both AtNDT1 and AtNDT2 are important for NAD+ metabolism in these tissues (unpublished work and the current study). In spite of these similarities, mutant plants for AtNDT1 and AtNDT2 displayed opposite phenotypes regarding their photosynthetic performance, having higher and lower photosynthetic rates, respectively, than the corresponding WT plants. In conjunction, this information demonstrated that, even though AtNDT1 and AtNDT2 cooperatively participate in NAD+ import into mitochondria, both proteins have varying degrees of specialization which probably took place alongside their independent cellular evolution and that have allowed the development of their individual properties such as the different transport properties and gene expression patterns.
In summary, the present study revealed that AtNDT1 is targeted to the inner mitochondrial membrane and that this transport protein appears to play an important role in cellular NAD+ homeostasis in leaves. As a consequence of AtNDT1 downregulation, NAD+ metabolism and transport seems to be reorganized, leading to metabolic shifts, which results in increases in photosynthesis, starch accumulation and in the activation state of the stromal NADP‐MDH. In addition, impaired AtNDT1 transport results in reduced pollen grain viability, tube growth, and seed filling, demonstrating the important role of AtNDT1 in reproductive tissues. Furthermore, we demonstrated a possible function for NAD+ transport during seed germination and seedling establishment that appears to be linked to the need of NAD+ during lipid metabolism and related processes. In the future, we are interested in identifying to what extent, AtNDT1 and AtNDT2 have overlapping functions in NAD+ transport in different tissues and conditions. It will also be interesting to determine whether specific stress situations characterized by differential expression patterns of AtNDT1 and AtNDT2 correlated with the establishment or alteration of the mitochondrial pyridine nucleotide pool. It seems reasonable to assume that the generation of multiple mutants for NAD+ transport proteins will be needed to gain precise mechanistic insight into these phenotypes. Moreover, the determination of NAD+ and NADP+ levels at tissue‐specific and subcellular levels in these mutants is likely to enhance our knowledge of the specificities and redundancies of these different albeit partially complementary transport proteins allowing us to truly understand the physiological hierarchy under which they operate.
Experimental procedures
Plant material
The ndt1 − :ndt1 − line, previously named GK‐241G12, was obtained from the GABI‐KAT collection. This mutant line harbours a T‐DNA insertion in the ninth exon of AtNDT1 (At2g47490) (Figure 1a). The mutant line was selected on medium containing sulfadiazine (https://www.sigmaaldrich.com) and the insertion of T‐DNA and homozygous plants were confirmed by PCR using specific primers for the gene that confers resistance to sulfadiazine (forward 5′‐GCACGAGGTACAAACCTCTACTCT‐3′, reverse 5′‐GTCTCTCAAGTTTCAACCCATTCT‐3′ and T‐DNA 5′‐ATATTGACCATCATACTCATTGC‐3′).
In addition, transgenic plants were generated by insertion of an antisense construct, under the control of the 35S promoter, produced using the Gateway system (Landy, 1989). For this purpose, primers were designed (forward 5′‐CCACCATGTCCGCTAATTCTCATCCTC‐3′ and reverse 5′‐CTTAAAGTATAGAGCTTTGCTCAGAAGG‐3′) from a cDNA library, for amplification of the 939‐bp AtNDT1 cDNA fragment. The PCR product was recombined with the vector donor pDONR207 generating an entry clone in Escherichia coli (DH5α strain). A second recombination was performed in pK2WG7 and transformed into E. coli. Subsequently, the selected colonies were used to transform A. tumefaciens (strain GV3101), which was then used for insertion in Arabidopsis plants, ecotype Columbia‐0, in which the transgene expression was driven by the constitutive 35S promoter (Bechtold et al., 1993). The cassette contained a marker gene, conferring resistance to hygromycin (https://www.thermofisher.com) driven by the nos promoter and nos terminator.
Growth conditions
Seeds were surface sterilized and germinated on half‐strength Murashige and Skoog (½MS) medium (Murashige and Skoog, 1962), supplemented with 1% sucrose (w/v) and the selective agent corresponding to the genotype used. Seeds were stratified for 4 days at 4°C in the darkness and then kept in a growth chamber at 22 ± 2°C, 60% relative humidity, irradiance of 150 μmol photons m−2 sec−1 and a photoperiod of 8 h light and 16 h dark for 10 days. After, seedlings were transferred to pots containing 0.08 dm3 of commercial substrate, Tropstrato HT®, and maintained under the same conditions. During the 4th week after transplanting, physiological assessments and harvesting of samples in liquid nitrogen for biochemical analyses were performed.
For the analyses involving heterotrophic tissues, plates were kept in an air‐conditioned growth room at 22 ± 2°C, relative humidity 60%, and an irradiance of 150 μmol photons m−2 sec−1, with a photoperiod of 8 h light and 16 h dark for 10 days. Then, the seedlings were also transferred to commercial substrate and evaluated for seed production.
Subcellular localization of NDT1 and NDT2 by confocal laser scanning microscopy (CLSM)
Arabidopsis plants were stable transformed by Agrobacterium‐mediated transformation with NDT1 or NDT2 fused to a C‐terminal GFP tag under the control of the ubiquitin 10 promotor (Grefen et al., 2010). Five‐day‐old transformed seedlings were incubated in 200 nm Mito tracker Red CMX ROs in ½MS medium for 1 h in the dark. Afterwards, seedlings were washed with ½MS medium to remove the Mito tracker solution and analyzed by a CLSM (Zeiss LSM 780) and Zeiss Zen software. Excitation and emission ranges of GFP (488 nm/490–550 nm) and Mito tracker Red CMX ROs (561 nm/580–625 nm) were measured in two tracks. Image processing was performed using Fiji as previously described (Schindelin et al., 2012).
Gene expression analysis
Gene expression analysis was performed in leaves, flowers, pollen, and imbibed seeds using quantitative real‐time PCR (qRT‐PCR). Total RNA was extracted from leaves and flowers using TRIzol® reagent (https://www.thermofisher.com) according to the manufacturer's instructions. Then total RNA was treated with DNase/RNase‐free (https://www.thermofisher.com) and quantified spectrophotometrically at 260 nm. Approximately 2 μg of isolated RNA were used to synthesize the complementary strand of DNA (cDNA) using an Improm‐II™ Reverse Transcription System (Promega, Madison, WI, USA, https://www.promega.com) and oligo(dT)15, following the manufacturer's recommendations.
The pollen isolation was made using a liquid pollen collection method as described previously (Hicks et al., 2004), with some modifications. Briefly, 50 inflorescences were collected into cold pollen growth medium (PGM) 17% sucrose, 2 mm CaCl2, 1.625 mm boric acid pH adjusted to 7.5 with KOH. The pollen was released by agitating with gloved hands. After removing all green plant material the PGM was filtered in a nylon membrane (80 μm mesh size). Finally, after centrifugation at 5000 g for 10 min the pellet containing the pollen was immediately frozen until RNA extraction.
Total RNA from pollen and 48 h imbided seeds were both isolated using the SV Total RNA Isolation System (Promega, https://www.promega.com) following the manufacturer's manual. The integrity of the RNA was checked on 1% (w/v) agarose gels, and the concentration was measured using the QIAxpert system (QIAGEN, https://www.qiagen.com). Subsequently, total RNA was reverse transcribed into cDNA using the Universal RiboClone® cDNA Synthesis System (Promega) according the manufacturer's protocol.
Quantitative RT‐PCRs were performed using a 7300 Real‐Time System (Applied Biosystems, Foster City, CA, USA, https://www.thermofisher.com) and Power SYBR® Green PCR Master Mix (https://www.thermofisher.com), following the manufacturer's recommendations. The relative expression levels were normalized using housekeeping genes (Table S3) and calculated using the ΔΔCt method. All primers used for qRT‐PCR were designed using the QuantPrime software (Messinger et al., 2006) and are listed in Table S3. qRT‐PCR cycles were set up as follows: 94°C for 10 min, 40 cycles of 94°C for 15 sec, 58°C for 15 sec and 72°C for 15 sec.
Gas‐exchange and chlorophyll a fluorescence parameters
Gas‐exchange and chlorophyll a fluorescence parameters were evaluated 1 h after the onset of the light period by an infrared gas analyzer (IRGA) LI 6400XT (LI‐COR, Lincoln, NE, USA, https://www.licor.com/) with coupled fluorometer (6400‐40 LI‐LI‐COR Inc.). Light response curves of net CO2 assimilation were obtained using a 2 cm2 foliar chamber, 25°C temperature, CO2 concentration (C a) of 400 μmol CO2 mol−1 and irradiances (PPFD) of 0, 10, 25, 50, 100, 200, 400, 800, 1000 and 1200 μmol photons m−2 sec−1. The variables derived from the curves A/PPFD, such as compensation irradiance (I c), saturation irradiance (I s), light use efficiency (1/ɸ), and CO2 assimilation rate saturated by light (A RFA) were estimated from response curve settings to light by the non‐rectangular hyperbolic model (von Caemmerer, 2000).
Gas‐exchange parameters were evaluated at saturation, i.e. 400 μmol photons m−2 sec−1 (Figure S10). Photosynthesis per mass unit was estimated based on SLA and LN.
The photorespiration rate (R i) was estimated as: R i = ((1/12) × (J flu − (4 × (A + R d)))) where J flu equivalent to ETR estimated by fluorescence parameters (Valentini et al., 1995). The instantaneous water use efficiency (A/E) and intrinsic water use efficiency (A/g s), where E stands for transpiration and g s for stomatal conductance, were also calculated.
Dark respiration (R d) was determined after 1 h dark acclimation using the same IRGA system described above. The maximum quantum efficiency of photosystem II (F v/F m) was evaluated. After 1 h of dark acclimation, an irradiance of 0.03 μmol photons m−2 sec−1 was applied to determine the initial fluorescence (F 0). To obtain maximal fluorescence (F m), a saturating pulse of 6000 μmol photons m−2 sec−1 was applied for 0.8 sec. The F v/F m was then calculated as (F m − F 0)/F m. Furthermore, NPQ and ETR were estimated as described by DaMatta et al. (2002) and Lima et al. (2002).
Biometric analysis
Following measurement of gas exchange and fluorescence, the whole plant was harvested and the following growth parameters were evaluated: rosette dry weight (RDW), RSDW, root/shoot ratio (RRS), RLA, SRA, LN, TLA, and SLA. RLA and TLA were determined using a digital image, in which the leaves were scanned (Hewlett Packard Scanjet G2410, Palo Alto, CA, USA) and the obtained images were processed with the aid of Rosette Tracker software (De Vylder et al., 2012). SRA and SLA were estimated using the formula: SRA (or SLA) = RLA (or TLA)/RDW.
Stomatal density
The stomatal density was determined using epidermal prints, from the abaxial surface of fully expanded leaves according to von Groll et al. (2002). Six plants per genotype were printed and, for each epidermal print, 10 different regions were evaluated.
Biochemical analyses
Six whole rosettes of each line were collected from 5‐week‐old plants and snap frozen in liquid nitrogen at 8, 12 or 16 h corresponding to the beginning, middle and end of the light period and 24 h and 8 h representing the middle and end of the dark period, respectively. Subsequently, samples were homogenized, and subjected to ethanol extraction as described by Gibon et al. (2004). Chlorophyll, nitrate, glucose, fructose and sucrose contents were quantified according to Sulpice et al. (2009) and Fernie et al. (2001), soluble amino acids as described by Gibon et al. (2004) and malate and fumarate as detailed by Nunes‐Nesi et al. (2007). In the insoluble fraction, the levels of starch and protein were determined according to Cross et al. (2006). The rates of starch biosynthesis ((starch concentration at the end of the light period – starch concentration at the beginning of the light period)/the number of hours of light) and starch degradation ((starch concentration at the end of the light period – concentration starch at the end of the dark period)/number of dark hours) were calculated. In addition, aliquots of approximately 25 mg of leaf samples were collected in the middle of the light period for the quantification of nucleotide NAD+, NADH, NADP+ and NADPH according to the protocol described by Schippers et al. (2008).
The metabolic profile was determined by gas chromatography time‐of‐flight mass spectrometry (GC‐TOF MS) according to the protocol described by Lisec et al. (2006). Metabolites were manually identified using the reference library mass spectra and retention indices from the Golm Metabolome Database (http://gmd.mpimp-golm.mpg.de; Kopka et al., 2005). Metabolite profiling data are reported following recommendations (Fernie et al., 2011).
Fatty acids of mature dried seeds and seedlings at 2, 4 or 6 days old were extracted and derivatized as described by Browse et al. (1986), and analyzed as methyl esters (FAMEs). The fatty acid profile was analyzed by GC‐TOF MS. Before derivatisation, fatty acid 17:0 was added as an internal standard to enable quantification. The identification of compounds was based on retention time and comparison of the mass spectra with reference spectra available on the NIST 08 and NIST 08s library database (National Institute of Standards and Technology, Babushok et al., 2007). The quantification was performed automatically by integrating the chromatographic peaks obtained (Bernhardt et al., 2012). The amounts of the 17:0 standard was used for the correction of inter‐sample variation and absolute quantification of fatty acids according to Hielscher et al. (2017). The percentage of each fatty acid was calculated relative to the total of all fatty acids for each line per time point.
Morphological analysis
The viability of pollen grain was evaluated as described by Lorenzon and Almeida (1996). For this, dehisced anthers of different genotypes were gently dipped onto the surface of the microscope slide and the pollen grains released were transferred to the dye and evaluated under a light microscope. Six flowers from six plants from each line were analyzed, with unstained or deformed pollen grains being considered non‐viable. We additionally determined the length and diameter of siliques using a stereomicroscope. Six siliques from six plants of each line were photographed and measured and the length, diameter and number of seeds in each silique were determined. In addition, the 1000‐seed weight was also determined.
Seed germination and seedling development
Seeds of ndt1 − :ndt1 − and WT plants were surface sterilized and germinated as described above. After 48 h in the light, the percentage of germination, GSI, percentage of normal and abnormal seedlings (including albino seedlings) and the ESI was determined. GSI and ESI were calculated by the sum of the number of germinated seeds (or normal seedlings) each day, divided by the number of days between sowing and germination, according to Maguire (1962). Six replicates of 50 seeds each were used for this evaluation.
Statistical analysis
All the data are expressed as the mean ± standard error. Data were tested for significant differences (P ≤ 0.05) using Student′s t test. All the statistical analyses were performed using the algorithm embedded into Microsoft Excel® (Microsoft, Seattle).
Accession numbers
AtNDT1 (At2g47490); AtNDT2 (At1g25380); AtPXN (At2g39970); COBL11 (At4g27110); F‐box family protein (At5g15710); AtNADK1 (At3g21070); AtNADK2 (At1G21640); AtNADK3 (At1G78590); AtACTIN (At2g37620); AtPARP1 (At2g31320); AtPARP2 (At4g02390); AtNUDIX7 (At4g12720); AtNIC1 (At2G22570); AtNIC4 (At3g16190); AtNAPRT1 (At4g36940); AtNAPRT2 (At2g23420); AtNADS (At1g55090); AtNMNAT (At5g55810); AtQPT (At2g01350); AtQS (At5g50210); AtAO (At5g14760).
Data statement
All data used for the analyses are available upon request or as Supporting Information and may be found in the online version of this article.
Conflict of interest
The authors declare no conflict of interest.
Author contributions
AF and ANN screened and genotyped the mutant line. MVP performed the cloning and plant transformation under supervision of TO; ISC screened the transgenic lines and performed most of the experiments under supervision of ANN; DBM, PFP, LC, EH and JACA performed complementary experiments and analyses; NL and TM‐A supervised ISC in the lipid analysis and LC in protein localization analysis; ANN and ISC designed the experiments and analyzed the data; ARF and ANN conceived the project and wrote the article with contributions of all the authors; PFP, HEN, FP, WLA, NL and APMW complemented the writing.
Supporting information
Figure S1. Gene expression analysis of the NDT1 gene in different organs of Arabidopsis thaliana wild type plants.
Figure S2. Gene expression analysis of genes encoding NAD+ carriers (NDT1, NDT2 and PXN) in different organs of Arabidopsis thaliana wild type and ndt1−:ndt1− plants.
Figure S3. Gene expression analysis of genes encoding enzymes related to NAD+ metabolism in imbibed seeds and leaves of Arabidopsis thaliana mutants deficient in the expression of the mitochondrial NAD+ transporter (NDT1) and wild type (WT) plants.
Figure S4. Phenotypic analysis of Arabidopsis thaliana lines deficient in the expression of the mitochondrial NAD+ transporter (NDT1) and wild type (WT) plants.
Figure S5. Seed, seedling, germination and seedling establishment characterization of Arabidopsis thaliana mutant line deficient in the expression of the mitochondrial NAD+ transporter (NDT1) and wild type (WT) plants.
Figure S6. Fatty acid composition in seeds and seedling of Arabidopsis thaliana mutants deficient in the expression of the mitochondrial NAD+ transporter (NDT1) and wild type (WT) plants.
Figure S7. Phenotypic analysis of pollen grains stained with acetic carmine from Arabidopsis thaliana genotypes deficient in the expression of the mitochondrial NAD+ transporter (NDT1) and wild type plants.
Figure S8. Germination rate and tube growth of pollen grains from Arabidopsis thaliana genotype deficient in the expression of the mitochondrial NAD+ transporter (NDT1) and wild type (WT) plants.
Figure S9. eFP display of transcript accumulation patterns across a variety of Arabidopsis organs and treatments.
Figure S10. Gas‐exchange and chlorophyll a fluorescence parameters in leaves of 4‐week‐old Arabidopsis thaliana genotypes deficient in the expression of the mitochondrial NAD+ transporter (NDT1) and wild type (WT) plants.
Figure S11. Non‐photochemical quenching (NPQ) of 4‐week‐old Arabidopsis thaliana genotypes deficient in the expression of the mitochondrial NAD+ transporter (NDT1) and wild type (WT) plants under various light intensities.
Figure S12. Changes in the main nitrogen metabolites in leaves of 4‐week‐old Arabidopsis thaliana genotypes deficient in the expression of the mitochondrial NAD+ transporter (NDT1) and wild type (WT) plants.
Figure S13. Changes in chlorophyll content in leaves of 4‐week‐old Arabidopsis thaliana genotypes deficient in the expression of the mitochondrial NAD+ transporter (NDT1) and wild type (WT) plants.
Table S1. Parameters derived from photosynthetic light curve response (Figure S4a) of 4‐week‐old, short‐day grown Arabidopsis thaliana genotypes deficient in the expression of the mitochondrial NAD+ transporter (NDT1).
Table S2. Relative metabolite levels in leaves of 4‐week‐old, short‐day grown, Arabidopsis thaliana genotypes deficient in the expression of the mitochondrial NAD+ transporter (NDT1) and wild type (WT) plants.
Table S3. List of primers used in this work to perform qPCR analysis.
Acknowledgements
Financial support was provided by Conselho Nacional de Desenvolvimento Científico e Tecnológico (CNPq) (Grant 402511/2016‐6 to WLA), Fundação de Amparo à Pesquisa do Estado de Minas Gerais (FAPEMIG) [Grant CRA – APQ‐01713‐13, CBB – APQ‐02548‐13, CEX – APQ‐02985‐14 and CRA – RED‐00053‐16] and Max Planck Society to ANN and WLA. HEN and ARF acknowledge the support of the Deutsche Forschungsgemeinschaft in the framework of the trans‐regional collaborative research centre TRR175. APMW acknowledges funding by the Deutsche Forschungsgemeinschaft (DFG, German Research Foundation) under Germany′s Excellence Strategy – EXC‐2048/1 – Project ID: 390686111. Research fellowships granted by CNPq to ANN and WLA, Coordenação de Aperfeiçoamento de Pessoal de Nível Superior (CAPES) and FAPEMIG to ISC and DBM are also gratefully acknowledged. The authors wish to thank the NUBIOMOL‐UFV for providing the facilities for the analysis of this work.
Contributor Information
Alisdair R. Fernie, Email: fernie@mpimp-golm.mpg.de.
Adriano Nunes‐Nesi, Email: nunesnesi@ufv.br.
References
- Agledal, L. , Niere, M. and Ziegler, M. (2010) The phosphate makes a difference: cellular functions of NADP. Redox Rep. 15, 2–10. 10.1179/174329210x12650506623122 [DOI] [PMC free article] [PubMed] [Google Scholar]
- Agrimi, G. , Russo, A. , Pierri, C.L. and Palmieri, F. (2012) The peroxisomal NAD+ carrier of Arabidopsis thaliana transports coenzyme A and its derivatives. J. Bioenerg. Biomembr. 44, 333–340. 10.1007/s10863-012-9445-0 [DOI] [PubMed] [Google Scholar]
- Babushok, V.I. , Linstrom, P.J. , Reed, J.J. , Zenkevich, I.G. , Brown, R.L. , Mallard, W.G. and Stein, S.E. (2007) Development of a database of gas chromatographic retention properties of organic compounds. J. Chromatogr. A, 1157, 414–421. 10.1016/j.chroma.2007.05.044 [DOI] [PubMed] [Google Scholar]
- Baud, S. , Boutin, J.P. , Miquel, M. , Lepiniec, L. and Rochat, C. (2002) An integrated overview of seed development in Arabidopsis thaliana ecotype WS. Plant Physiol. Biochem. 40, 151–160. 10.1016/s0981-9428(01)01350-x [DOI] [Google Scholar]
- Bechtold, N. , Ellis, J. and Pelletier, G. (1993) In planta Agrobacterium mediated gene transfer by infiltration of adult Arabidopsis thaliana plants. C. R. Acad. III, 316, 1194–1199. 10.1007/978-3-642-79247-2_3 [DOI] [PubMed] [Google Scholar]
- Bedhomme, M. , Hoffmann, M. , McCarthy, E.A. , Gambonnet, B. , Moran, R.G. , Rébeillé, F. and Ravanel, S. (2005) Folate metabolism in plants: an Arabidopsis homolog of the mammalian mitochondrial folate transporter mediates folate import into chloroplasts. J. Biol. Chem. 280, 34823–34831. [DOI] [PubMed] [Google Scholar]
- Bernhardt, K. , Wilkinson, S. , Weber, A.P.M. and Linka, N. (2012) A peroxisomal carrier delivers NAD+ and contributes to optimal fatty acid degradation during storage oil mobilization. Plant J. 69, 1–13. 10.1111/j.1365-313x.2011.04775.x [DOI] [PubMed] [Google Scholar]
- Berrin, J.‐G. , Pierrugues, O. , Brutesco, C. , Alonso, B. , Montillet, J.‐L. , Roby, D. and Kazmaier, M. (2005) Stress induces the expression of AtNADK‐1, a gene encoding a NAD(H) kinase in Arabidopsis thaliana . Mol. Genet. Genomics, 273, 10–19. 10.1007/s00438-005-1113-1 [DOI] [PubMed] [Google Scholar]
- Bowsher, C.G. , Lacey, A.E. , Hanke, G.T. , Clarkson, D.T. , Saker, L.R. , Stulen, I. and Emes, M.J. (2007) The effect of Glc6P uptake and its subsequent oxidation within pea root plastids on nitrite reduction and glutamate synthesis. J. Exp. Bot. 58, 1109–1118. 10.1093/jxb/erl269 [DOI] [PubMed] [Google Scholar]
- Browse, J. , McCourt, P.J. and Somerville, C.R. (1986) Fatty acid composition of leaf lipids determined after combined digestion and fatty acid methyl ester formation from fresh tissue. Anal. Biochem. 152, 141–145. 10.1016/0003-2697(86)90132-6 [DOI] [PubMed] [Google Scholar]
- Cárdenas, L. , McKenna, S.T. , Kunkel, J.G. and Hepler, P.K. (2006) NAD(P)H oscillates in pollen tubes and is correlated with tip growth. Plant Physiol. 142, 1460–1468. 10.1104/pp.109.150458 [DOI] [PMC free article] [PubMed] [Google Scholar]
- Chai, M.F. , Chen, Q.J. , An, R. , Chen, Y.M. , Chen, J. and Wang, X.C. (2005) NADK2, an Arabidopsis chloroplastic NAD kinase, plays a vital role in both chlorophyll synthesis and chloroplast protection. Plant Mol. Biol. 59, 553–564. 10.1007/s11103-005-6802-y [DOI] [PubMed] [Google Scholar]
- Chai, M.F. , Wei, P.C. , Chen, Q.J. , An, R. , Chen, J. , Yang, S. and Wang, X.C. (2006) NADK3, a novel cytoplasmic source of NADPH, is required under conditions of oxidative stress and modulates abscisic acid responses in Arabidopsis. Plant J. 47, 665–674. 10.1111/j.1365-313x.2006.02816.x [DOI] [PubMed] [Google Scholar]
- Cross, J.M. , von Korff, M. , Altmann, T. , Bartzetko, L. , Sulpice, R. , Gibon, Y. , Palacios, N. and Stitt, M. (2006) Variation of enzyme activities and metabolite levels in 24 Arabidopsis accessions growing in carbon‐limited conditions. Plant Physiol. 142, 1574–1588. 10.1104/pp.106.086629 [DOI] [PMC free article] [PubMed] [Google Scholar]
- DaMatta, F.M. , Loos, R.A. , Silva, E.A. and Loureiro, M.E. (2002) Limitations to photosynthesis in Coffea canephora as a result of nitrogen and water availability. J. Plant Physiol. 159, 975–981. 10.1078/0176-1617-00807 [DOI] [Google Scholar]
- De Block, M. , Verduyn, C. , De Brouwer, D. and Cornelissen, M. (2005) Poly(ADP‐ribose) polymerase in plants affects energy homeostasis, cell death and stress tolerance. Plant J. 41, 95–106. 10.1111/j.1365-313x.2004.02277.x [DOI] [PubMed] [Google Scholar]
- De Vylder, J. , Vandenbussche, F. , Hu, Y. , Philips, W. and Van Der Straeten, D. (2012) Rosette Tracker: an open source image analysis tool for automatic quantification of genotype effects. Plant Physiol. 160, 1149–1159. 10.1104/pp.112.202762 [DOI] [PMC free article] [PubMed] [Google Scholar]
- Fernie, A.R. , Roscher, A. , Ratcliffe, R.G. and Kruger, N.J. (2001) Fructose 2,6‐bisphosphate activates pyrophosphate: fructose 6 phosphate 1‐phosphotransferase and increases triose phosphate to hexose phosphate cycling in heterotrophic cells. Planta, 212, 250–263. 10.1007/s004250000386 [DOI] [PubMed] [Google Scholar]
- Fernie, A.R. , Aharoni, A. , Willmitzer, L. , Stitt, M. , Tohge, T. , Kopka, J. , Carroll, A.J. , Saito, K. , Fraser, P.D. and de Luca, V. (2011) Recommendations for reporting metabolite data. Plant Cell, 23, 2477–2482. 10.1105/tpc.111.086272 [DOI] [PMC free article] [PubMed] [Google Scholar]
- Flexas, J. , Ribas‐Carbó, M. , Diaz‐Espejo, A. , Galmés, J. and Medrano, H. (2008) Mesophyll conductance to CO2: current knowledge and future prospects. Plant Cell Environ. 31, 602–621. 10.1111/j.1365-3040.2007.01757.x [DOI] [PubMed] [Google Scholar]
- Gakière, B. , Fernie, A.R. and Pétriacq, P. (2018) More to NAD+ than meets the eye: A regulator of metabolic pools and gene expression in Arabidopsis. Free Radical Biology and Medicine, 122, 86–95. 10.1016/j.freeradbiomed.2018.01.003 [DOI] [PubMed] [Google Scholar]
- Geigenberger, P. and Fernie, A.R. (2014) Metabolic control of redox and redox control of metabolism in plants. Antioxid. Redox Signal. 21, 1389–1421. 10.1089/ars.2014.6018 [DOI] [PMC free article] [PubMed] [Google Scholar]
- Geigenberger, P. , Kolbe, A. and Tiessen, A. (2005) Redox regulation of carbon storage and partitioning in response to light and sugars. J. Exp. Bot. 56, 1469–1479. 10.1093/jxb/eri178 [DOI] [PubMed] [Google Scholar]
- Gibon, Y. , Blaesing, O.E. , Hannemann, J. , Carillo, P. , Hohne, M. , Hendriks, J.H.M. , Palacios, N. , Cross, J. , Selbig, J. and Stitt, M. (2004) A robot‐based platform to measure multiple enzyme activities in Arabidopsis using a set of cycling assays: comparison of changes of enzyme activities and transcript levels during diurnal cycles and prolonged darkness. Plant Cell, 16, 3304–3325. 10.1105/tpc.104.025973 [DOI] [PMC free article] [PubMed] [Google Scholar]
- Grefen, C. , Donald, N. , Hashimoto, K. , Kudla, J. , Schumacher, K. and Blatt, M.R. (2010) A ubiquitin-10 promoter-based vector set for fluorescent protein tagging facilitates temporal stability and native protein distribution in transient and stable expression studies. The Plant Journal, 64(2), 355–365. 10.1111/j.1365-313X.2010.04322.x [DOI] [PubMed] [Google Scholar]
- Hashida, S.N. , Takahashi, H. , Kawai‐Yamada, M. and Uchimiya, H. (2007) Arabidopsis thaliana nicotinate/nicotinamide mononucleotide adenyltransferase (AtNMNAT) is required for pollen tube growth. Plant J. 49, 694–703. 10.1111/j.1365-313x.2006.02989.x [DOI] [PubMed] [Google Scholar]
- Hashida, S.N. , Takahashi, H. and Uchimiya, H. (2009) The role of NAD biosynthesis in plant development and stress responses. Ann. Bot. 103, 819–824. 10.1093/aob/mcp019 [DOI] [PMC free article] [PubMed] [Google Scholar]
- Hashida, S.N. , Itami, T. , Takahashi, H. , Takahara, K. , Nagano, M. , Kawai‐Yamada, M. , Shoji, K. , Goto, F. , Yoshihara, T. and Uchimiya, H. (2010) Nicotinate/nicotinamide mononucleotide adenyltransferase‐mediated regulation of NAD biosynthesis protects guard cells from reactive oxygen species in ABA‐mediated stomatal movement in Arabidopsis. J. Exp. Bot. 61, 3813–3825. 10.1093/jxb/erq190 [DOI] [PubMed] [Google Scholar]
- Hashida, S.N. , Takahashi, H. , Takahara, K. , Kawai‐Yamada, M. , Kitazaki, K. , Shoji, K. , Goto, F. , Yoshihara, T. and Uchimiya, H. (2013) NAD+ accumulation during pollen maturation in Arabidopsis regulating onset of germination. Mol. Plant, 6, 216–225. 10.1093/mp/sss071 [DOI] [PubMed] [Google Scholar]
- Hicks, G.R. , Rojo, E. , Hong, S. , Carter, D.G. and Raikhel, N.V. (2004) Geminating pollen has tubular vacuoles, displays highly dynamic vacuole biogenesis, and requires VACUOLESS1 for proper function. Plant Physiol. 134, 1227–1239. 10.1104/pp.103.037382 [DOI] [PMC free article] [PubMed] [Google Scholar]
- Hielscher, B. , Charton, L. , Mettler‐Altmann, T. and Linka, N. (2017) Analysis of Peroxisomal beta‐oxidation during storage oil mobilization in Arabidopsis thaliana seedlings. Methods Mol. Biol. 1595, 291–304. 10.1007/978-1-4939-6937-1_27 [DOI] [PubMed] [Google Scholar]
- Hölscher, C. , Lutterbey, M.C. , Lansing, H. , Meyer, T. , Fischer, K. and von Schaewen, A. (2016) Defects in peroxisomal 6‐phosphogluconate dehydrogenase isoform PGD2 prevent gametophytic interaction in Arabidopsis thaliana . Plant Physiol. 171, 192–205. 10.1104/pp.15.01301 [DOI] [PMC free article] [PubMed] [Google Scholar]
- Hunt, L. and Gray, J.E. (2009) The relationship between pyridine nucleotides and seed dormancy. New Phytol. 181, 62–70. 10.1111/j.1469-8137.2008.02641.x [DOI] [PubMed] [Google Scholar]
- Hunt, L. , Holdsworth, M.J. and Gray, J.E. (2007) Nicotinamidase activity is important for germination. Plant J. 51, 341–351. 10.1111/j.1365-313x.2007.03151.x [DOI] [PubMed] [Google Scholar]
- Kirchberger, S. , Tjaden, J. and Neuhaus, H.E. (2008) Characterization of the Arabidopsis Brittle1 transport protein and impact of reduced activity on plant metabolism. Plant J. 56, 51–63. 10.1111/j.1365-313x.2008.03583.x [DOI] [PubMed] [Google Scholar]
- Kopka, J. , Schauer, N. , Krueger, S. et al. (2005) GMD@CSB.DB: the Golm Metabolome Database. Bioinformatics, 21, 1635–1638. 10.1093/bioinformatics/bti236 [DOI] [PubMed] [Google Scholar]
- Landy, A. (1989) Dynamic, structural, and regulatory aspects of Lambda site specific recombination. Ann. Rev. Biochem. 58, 913–949. 10.1146/annurev.bi.58.070189.004405 [DOI] [PubMed] [Google Scholar]
- Lima, A.L.S. , DaMatta, F.M. , Pinheiro, H.A. , Totola, M.R. and Loureiro, M.E. (2002) Photochemical responses and oxidative stress in two clones of Coffea canephora under water deficit conditions. Environ. Exp. Bot. 47, 239–247. 10.1016/s0098-8472(01)00130-7 [DOI] [Google Scholar]
- Lisec, J. , Schauer, N. , Kopka, J. , Willmitzer, L. and Fernie, A.R. (2006) Gas chromatography mass spectrometry‐based metabolite profiling in plants. Nat. Protoc. 1, 387–396. 10.1038/nprot.2006.59 [DOI] [PubMed] [Google Scholar]
- Liu, Y.‐J. , Nunes‐Nesi, A. , Wallström, S.V. , Lager, I. , Michalecka, A.M. , Norberg, F.E.B. , Widell, S. , Fredlund, K.M. , Fernie, A.R. and Rasmusson, A.G. (2009) A redox‐mediated modulation of stem bolting in transgenic nicotiana sylvestris differentially expressing the external mitochondrial NADPH dehydrogenase. Plant Physiol. 150, 1248–1259. 10.1104/pp.109.136242 [DOI] [PMC free article] [PubMed] [Google Scholar]
- Lorenzon, M.C.A. and Almeida, E.C. (1996) Viabilidade e germinação do pólen de linhagens parentais de cebola híbrida. Pesqui. Agropec. Bras. 32, 345–349 [Google Scholar]
- Maguire, J.D. (1962) Speed of germination aid in selection and evaluation for seedling emergence and vigor. Crop Sci. 2, 176–177. 10.2135/cropsci1962.0011183x000200020033x [DOI] [Google Scholar]
- Messinger, S.M. , Buckley, T.N. and Mott, K.A. (2006) Evidence for involvement of photosynthetic processes in the stomatal response to CO2 . Plant Physiol. 140, 771–778. 10.1104/pp.105.073676 [DOI] [PMC free article] [PubMed] [Google Scholar]
- Muñoz‐Bertomeu, J. , Cascales‐Minana, B. , Irles‐Segura, A. , Mateu, I. , Nunes‐Nesi, A. , Fernie, A.R. , Segura, J. and Ros, R. (2010) The plastidial glyceraldehyde‐3‐phosphate dehydrogenase is critical for viable pollen development in Arabidopsis. Plant Physiol. 152, 1830–1841 [DOI] [PMC free article] [PubMed] [Google Scholar]
- Murashige, T. and Skoog, F. (1962) A revised medium for rapid growth and bioassay with tobacco tissue cultures. Physiol. Plant. 15, 473–497. 10.1111/j.1399-3054.1962.tb08052.x [DOI] [Google Scholar]
- Neuhaus, H.E. and Emes, M.J. (2000) Nonphotosynthetic metabolism in plastids. Annu. Rev. Plant Physiol. Plant Mol. Biol. 51, 111–140. 10.1146/annurev.arplant.51.1.111 [DOI] [PubMed] [Google Scholar]
- Noctor, G. , Queval, G. and Gakière, B. (2006) NAD(P) synthesis and pyridine nucleotide cycling in plants and their potential importance in stress conditions. J. Exp. Bot. 57, 1603–1620. 10.1093/jxb/erj202 [DOI] [PubMed] [Google Scholar]
- Nunes‐Nesi, A. , Carrari, F. , Gibon, Y. , Sulpice, R. , Lytovchenko, A. , Fisahn, J. , Graham, J. , Ratcliffe, R.G. , Sweetlove, L.J. and Fernie, A.R. (2007) Deficiency of mitochondrial fumarase activity in tomato plants impairs photosynthesis via an effect on stomatal function. Plant J. 50, 1093–1106. 10.1111/j.1365-313x.2007.03115.x [DOI] [PubMed] [Google Scholar]
- Palmieri, F. , Rieder, B. , Ventrella, A. et al. (2009) Molecular identification and functional characterization of Arabidopsis thaliana mitochondrial and chloroplastic NAD+ carrier proteins. J. Biol. Chem. 284, 31249–31259. 10.1074/jbc.m109.041830 [DOI] [PMC free article] [PubMed] [Google Scholar]
- Penfound, T. and Foster, J.W. (1999) NAD‐dependent DNA‐binding activity of the bifunctional NadR regulator of Salmonella typhimurium . J. Bacteriol. 181, 648–655. [DOI] [PMC free article] [PubMed] [Google Scholar]
- Scheibe, R. (2004) Malate valves to balance cellular energy supply. Physiol. Plant. 120, 21–26. 10.1111/j.0031-9317.2004.0222.x [DOI] [PubMed] [Google Scholar]
- Schippers, J.H.M. , Nunes‐Nesi, A. , Apetrei, R. , Hille, J. , Fernie, A.R. and Dijkwel, P.P. (2008) The Arabidopsis onset of leaf death5 mutation of quinolinate synthase nicotinamide adenine dinucleotide biosynthesis and causes early ageing. Plant Cell, 20, 2909–2925. 10.1105/tpc.107.056341 [DOI] [PMC free article] [PubMed] [Google Scholar]
- Selinski, J. and Scheibe, R. (2014) Pollen tube growth: where does the energy come from? Plant Signal. Behav. 9, e977200–e977209. 10.4161/15592324.2014.977200 [DOI] [PMC free article] [PubMed] [Google Scholar]
- Selinski, J. , König, N. , Wellmeyer, B. , Hanke, G.T. , Linke, V. , Neuhaus, H.E. and Scheibe, R. (2014) The plastid‐localized NAD‐dependent malate dehydrogenase is crucial for energy homeostasis in developing Arabidopsis thaliana seeds. Mol. Plant, 7, 170–186 [DOI] [PubMed] [Google Scholar]
- Senkler, J. , Senkler, M. , Eubel, H. , Hildebrandt, T. , Lengwenus, C. , Schertl, P. , Schwarzländer, M. , Wagner, S. , Wittig, I. and Braun, H.P. (2017) The mitochondrial complexome of Arabidopsis thaliana . Plant J. 89, 1079–1092. [Epub 2017 Feb 20]. 10.1111/tpj.13448 [DOI] [PubMed] [Google Scholar]
- Schindelin, J. , Arganda‐Carreras, I. , Frise, E. et al. (2012) Fiji: an open‐source platform for biological‐image analysis. Nat. Methods, 9, 676–682 [DOI] [PMC free article] [PubMed] [Google Scholar]
- Sulpice, R. , Pyl, E.T. , Ishihara, H. et al. (2009) Starch as a major integrator in the regulation of plant growth. Proc. Natl Acad. Sci. USA, 106, 10348–10353. 10.1073/pnas.0903478106 [DOI] [PMC free article] [PubMed] [Google Scholar]
- Takahashi, H. , Takahara, K. , Hashida, S. , Hirabayashi, T. , Fujimori, T. , Kawai‐Yamada, M. , Yamaya, T. , Yanagisawa, S. and Uchimiya, H. (2009) Pleiotropic modulation of carbon and nitrogen metabolism in Arabidopsis plants overexpressing the NAD kinase2 Gene. Plant Physiol. 151, 100–113. 10.1104/pp.109.140665 [DOI] [PMC free article] [PubMed] [Google Scholar]
- Takahashi, H. , Watanabe, A. , Tanaka, A. , Hashida, S. , Kawai‐yamada, M. , Sonoike, K. and Uchimiya, H. (2006) Chloroplast NAD Kinase is essential for energy transduction through the xanthophyll cycle in photosynthesis. Plant Cell Physiol. 47, 1678–1682 [DOI] [PubMed] [Google Scholar]
- Tanaka, Y. , Sugano, S.S. , Shimada, T. and Hara‐Nishimura, I. (2013) Enhancement of leaf photosynthetic capacity through increased stomatal density in Arabidopsis. New Phytol. 198, 757–764. 10.1111/nph.12186 [DOI] [PubMed] [Google Scholar]
- Todisco, S. , Agrimi, G. , Castegna, A. and Palmieri, F. (2006) Identification of the mitochondrial NAD1 transporter in Saccharomyces cerevisiae . J. Biol. Chem. 281, 1524–1531. 10.1074/jbc.m510425200 [DOI] [PubMed] [Google Scholar]
- Turner, W.L. , Waller, J.C. and Snedden, W.A. (2005) Identification, molecular cloning and functional characterization of a novel NADH kinase from Arabidopsis thaliana (thale cress). Biochem. J. 385, 217–223. 10.1042/bj20040292 [DOI] [PMC free article] [PubMed] [Google Scholar]
- Valentini, R. , Epron, D. , De Angelis, P. , Matteucci, G. and Dreyer, E. (1995) In situ estimation of net CO2 assimilation, photosynthetic electron flow and photorespiration in Turkey oak (Q. cerris L.) leaves: diurnal cycles under different levels of water supply. Plant Cell Environ. 18, 631–640. 10.1111/j.1365-3040.1995.tb00564.x [DOI] [Google Scholar]
- VanLinden, M.R. , Dölle, C. , Pettersen, I.K. et al. (2015) Subcellular distribution of NAD+ between cytosol and mitochondria determines the metabolic profile of human cells. J. Biol. Chem. 290, 27644–27659. 10.1074/jbc.m115.654129 [DOI] [PMC free article] [PubMed] [Google Scholar]
- van Roermund, C.W. , Schroers, M.G. , Wiese, J. et al. (2016) The peroxisomal NAD carrier from Arabidopsis imports NAD in exchange with AMP. Plant Physiol. 171, 2127–2139 [DOI] [PMC free article] [PubMed] [Google Scholar]
- , von Caemmerer, S. (2000). Biochemical Models of Leaf Photosynthesis. Victoria: CSIRO Publishing. [Google Scholar]
- von Groll, U. , Berger, D. and Altmann, T. (2002) The subtilisin‐like serine protease SDD1 mediates cell‐to‐cell signaling during Arabidopsis stomatal development. Plant Cell, 14, 1527–1539. 10.1105/tpc.001016 [DOI] [PMC free article] [PubMed] [Google Scholar]
- Waller, J.C. , Dhanoa, P.K. , Schumann, U. , Mullen, R.T. and Snedden, W.A. (2010) Subcellular and tissue localization of NAD kinases from Arabidopsis: compartmentalization of de novo NADP biosynthesis. Planta, 231, 305–317. 10.1007/s00425-009-1047-7 [DOI] [PubMed] [Google Scholar]
- Winter, D. , Vinegar, B. , Nahal, H. , Ammar, R. , Wilson, G.V. and Provart, N.J. (2007) An “Electronic Fluorescent Pictograph” browser for exploring and analyzing large‐scale biological data sets. PLoS ONE, 2, e718 [DOI] [PMC free article] [PubMed] [Google Scholar]
Associated Data
This section collects any data citations, data availability statements, or supplementary materials included in this article.
Supplementary Materials
Figure S1. Gene expression analysis of the NDT1 gene in different organs of Arabidopsis thaliana wild type plants.
Figure S2. Gene expression analysis of genes encoding NAD+ carriers (NDT1, NDT2 and PXN) in different organs of Arabidopsis thaliana wild type and ndt1−:ndt1− plants.
Figure S3. Gene expression analysis of genes encoding enzymes related to NAD+ metabolism in imbibed seeds and leaves of Arabidopsis thaliana mutants deficient in the expression of the mitochondrial NAD+ transporter (NDT1) and wild type (WT) plants.
Figure S4. Phenotypic analysis of Arabidopsis thaliana lines deficient in the expression of the mitochondrial NAD+ transporter (NDT1) and wild type (WT) plants.
Figure S5. Seed, seedling, germination and seedling establishment characterization of Arabidopsis thaliana mutant line deficient in the expression of the mitochondrial NAD+ transporter (NDT1) and wild type (WT) plants.
Figure S6. Fatty acid composition in seeds and seedling of Arabidopsis thaliana mutants deficient in the expression of the mitochondrial NAD+ transporter (NDT1) and wild type (WT) plants.
Figure S7. Phenotypic analysis of pollen grains stained with acetic carmine from Arabidopsis thaliana genotypes deficient in the expression of the mitochondrial NAD+ transporter (NDT1) and wild type plants.
Figure S8. Germination rate and tube growth of pollen grains from Arabidopsis thaliana genotype deficient in the expression of the mitochondrial NAD+ transporter (NDT1) and wild type (WT) plants.
Figure S9. eFP display of transcript accumulation patterns across a variety of Arabidopsis organs and treatments.
Figure S10. Gas‐exchange and chlorophyll a fluorescence parameters in leaves of 4‐week‐old Arabidopsis thaliana genotypes deficient in the expression of the mitochondrial NAD+ transporter (NDT1) and wild type (WT) plants.
Figure S11. Non‐photochemical quenching (NPQ) of 4‐week‐old Arabidopsis thaliana genotypes deficient in the expression of the mitochondrial NAD+ transporter (NDT1) and wild type (WT) plants under various light intensities.
Figure S12. Changes in the main nitrogen metabolites in leaves of 4‐week‐old Arabidopsis thaliana genotypes deficient in the expression of the mitochondrial NAD+ transporter (NDT1) and wild type (WT) plants.
Figure S13. Changes in chlorophyll content in leaves of 4‐week‐old Arabidopsis thaliana genotypes deficient in the expression of the mitochondrial NAD+ transporter (NDT1) and wild type (WT) plants.
Table S1. Parameters derived from photosynthetic light curve response (Figure S4a) of 4‐week‐old, short‐day grown Arabidopsis thaliana genotypes deficient in the expression of the mitochondrial NAD+ transporter (NDT1).
Table S2. Relative metabolite levels in leaves of 4‐week‐old, short‐day grown, Arabidopsis thaliana genotypes deficient in the expression of the mitochondrial NAD+ transporter (NDT1) and wild type (WT) plants.
Table S3. List of primers used in this work to perform qPCR analysis.