

Abstract
Purpose
There is urgent need for non‐invasive diagnostic biomarkers in the preclinical phase of Alzheimer's Disease (AD). Several studies suggest that retinal thickness is reduced in AD. Here, we aim to test the diagnostic value of retinal thickness in preclinical AD, as defined by cognitively normal individuals with amyloid pathology on PET.
Methods
One hundred and sixty five cognitively healthy monozygotic twins aged ≥ 60 were included from the Netherlands Twin Register taking part in the European Medical Information Framework for Alzheimer's Disease PreclinAD study. Participants underwent [18F] flutemetamol PET that was visually rated for presence or absence of cortical amyloid beta (Aβ). Binding potential (BPND) was calculated as continuous measure for Aβ. Spectral Domain OCT was used to asses total and individual inner retinal layer thickness in the macular region (ETDRS circles) as well as peripapillary retinal nerve fibre layer (pRNFL) thickness. Differences between Aβ+ and Aβ− individuals and associations between BPND and retinal thickness were analyzed.
Results
No differences were found in retinal layer thickness in the macula or pRNFL between Aβ+ and Aβ− individuals. A positive associations between BPND and macular total retinal thickness was observed in the inner ring (p = 0.018), but this was not statistically significant after correction for multiple testing (p = 0.144). Brain/eye parameters had moderate to high intra‐twin correlations (p < 0.001) except visual rating score of Aβ, which did not correlate (r = 0.21, p = 0.068).
Conclusion
Variation in retinal thickness likely reflects genetic differences between individuals, but cannot discriminate between healthy and preclinical AD cases, making its use as biomarker in these early stages limited.
Keywords: OCT, ocular biomarkers, preclinical Alzheimer's disease, retina, twins
Introduction
Alzheimer's disease (AD) comprises about 65% of all cases of dementia (Eratne et al. 2018; Montgomery et al. 2018). In 2010, about 35.6 million people worldwide suffered from AD, and this number is expected to be about 115.4 million in 2050 (Prince et al. 2013). As yet, there is no effective treatment, despite many efforts across many trials (Kumar et al. 2015; Sun et al. 2018; Vina & Sanz‐Ros 2018). One of the most important reasons for these unsuccessful trials may have been the timing: most trials were focused on people already suffering from clinically evident dementia, where brain damage is in more advanced stages (Sun et al. 2018; Vina & Sanz‐Ros 2018). As reversing neuronal damage may be impossible, it may be more effective to start treatment before the onset of dementia (Kumar et al. 2015; Sun et al. 2018). To enable this, early diagnostic markers are needed.
AD is neuropathologically characterized by deposits of amyloid‐beta (Aβ) and hyperphosphorylated Tau in the cortex (Aβ‐plaques and neurofibrillary tangles). Aβ build‐up is believed to precede onset of symptoms by up to 20 years (Jansen et al. 2015; Eratne et al. 2018). The interval between amyloid positivity and cognitive decline yields a broad window of opportunity for AD treatment or ultimately prevention of symptom onset. With recent developments in PET imaging, Aβ deposits can be visualized in vivo (Jack et al. 2013; Zhang et al. 2014). With this technique, it is now possible to recognize those individuals at risk for development of AD, by increased Aβ build up in the neocortex (Vlassenko et al. 2012; Jack et al. 2013; Khan 2018). As the risk for developing AD is increased in people with positive Aβ PET scans, this condition is often termed ‘preclinical AD’ (Vlassenko et al. 2012; Khan 2018).
PET imaging is, however, not without its disadvantages. It is an expensive technique, and available only to large hospitals with advanced diagnostic means (Mitka 2013; Leuzy et al. 2014; Hornberger et al. 2017). Furthermore, the injection of a radioactive label and the scanning itself is unpleasant and subjects patients to radioactivity (Scheinin et al. 2007; Nishii et al. 2018).
The eye is receiving more and more attention as a potential biomarker for dementia, and in particular AD. The retina, being an extension of the brain, may reflect pathological processes occurring in the brain (London et al. 2013). Several groups have shown differences in retinal layer thickness using optical coherence tomography (OCT), measuring a decrease in retinal layer thickness, or retinal blood vessels characteristics using fundus images, between AD patients and healthy controls (Frost et al. 2010; Lim et al. 2016; den Haan et al. 2017; McGrory et al. 2017). Only a few groups, however, assessed preclinical AD cases (Snyder et al. 2016; Santos et al. 2018). The development of a new non‐invasive, patient friendly and easily repeatable measurement of a biomarker for pre‐clinical AD patients is especially interesting, because it would allow for early interventions targeting the causes at a stage that neuronal damage could still be prevented (Sun et al. 2018; Vina & Sanz‐Ros 2018).
By performing such a study in monozygotic twins, at the same time more insight can be gained in the contribution of genes or environment to (1) biological measures such as retinal layer thickness and amyloid pathology, and (2) the aetiology of postulated relations between the eye and brain. In this study, we assessed retinal layer thickness measured with spectral domain OCT in cognitively healthy monozygotic twin pairs, stratified for amyloid status based on amyloid‐PET imaging. In addition, we assessed the relationship between retinal layer thickness and quantitative amyloid load in the neocortex, using Aβ‐PET binding potential.
Materials and Methods
Participants
This study is an extension of the Amsterdam sub‐study of the European Medical Information Framework for Alzheimer's Disease (EMIF‐AD) PreclinAD cohort. For this cohort, 217 participants aged ≥ 60 were recruited from the Netherlands Twin Register (Boomsma et al. 2006; Konijnenberg et al. 2018; van de Kreeke et al. 2018; Ten Kate et al. 2018). The study followed the Tenets of the Declaration of Helsinki and written informed consent was obtained from all participants. The study was approved by the Medical Ethics Committee of the VU University Medical Center in Amsterdam.
Inclusion criteria for the EMIF‐AD cohort study were: age ≥ 60 years, monozygosity, cognitively healthy as defined by: Telephone Interview for Cognitive Status modified (TICS‐m) score > 22 (de Jager et al. 2003), Geriatric Depression Scale (GDS) score < 11 (Yesavage et al. 1982), Consortium to Establish a Registry for Alzheimer's Disease (CERAD) 10 word list immediate and delayed recall > ‐1.5 SD of age adjusted normative data (Morris et al. 1989) and Clinical Dementia Rating (CDR) scale of 0 with a score on the memory sub domain of 0 (Morris 1993).
Exclusion criteria for the EMIF cohort study were the following: stroke resulting in physical impairment, neurodegenerative disorders, cancer with terminal life expectancy, uncontrolled diabetes mellitus, alcohol consumption > 35 units (1 unit = 10 ml or 8 g of pure alcohol) per week.
In addition to these in‐ and exclusion criteria already defined within the EMIF‐AD cohort study, several additional exclusion criteria for this particular study were defined (see below).
Ophthalmological examination
All participants underwent the following ophthalmological examinations: best corrected visual acuity, intra‐ocular pressure, refraction data, slit lamp examination, indirect fundoscopy, fundus photography and OCT. Tropicamide 0.5% was used for pupil dilation to enable these examinations. All photographs/OCT images were assessed by an experienced ophthalmologist (HTN) for unexpected pathology. Participants suffering from ophthalmological conditions interfering with the (neuro)retina or image quality were excluded from analysis. These conditions were: (severe) cataract, macular degeneration, glaucoma, diabetic retinopathy, vascular occlusions, spherical equivalent >+5D or < ‐8 diopters and/or a history of ophthalmological surgery other than cataract extraction.
Optical coherence tomography
Dense macular scans (49 B‐scans) and axonal ring scans around the optic nerve head (ONH) were acquired using spectral domain OCT (Spectralis, Heidelberg). Total retinal thickness and individual layer thickness was obtained in the macular region using the build‐in heidelberg segmentation software (Heidelberg, Germany, version 1.9.14.0). Total retinal thickness as well as the following individual retinal layers was analysed: retinal nerve fibre layer (RNFL), ganglion cell layer (GCL) and inner plexiform layer (IPL). A distinction was made between the inner and outer macular ring according to the standard ETDRS macular grid (1–3 mm around the fovea for inner ring and 3–6 mm around the fovea for outer ring). The values of the four quadrants within a macular ring were averaged to obtain a single value for that whole ring. Peripapillary RNFL (pRNFL) thickness was obtained in six sectors (nasal superior, nasal, nasal inferior, temporal inferior, temporal, temporal superior) and as an average over all sectors. All OCT scans were checked for gross errors in segmentation, by looking at the en face heat map in the macula (for both total retinal thickness, and each of the layers analyzed), and the pRNFL segmentation on the B‐scan. Additionally, all data was plotted using scatters and box plots, and big outliers were double checked to ensure this was not due to a missed segmentation error. Scans were averaged over right and left eyes, if only one suitable scan was available only the values of that eye were used.
Amyloid PET scanning
All PET scans were performed using a Ingenuity TF PET‐MRI scanner (Philips Medical Systems, Best, the Netherlands). All participants were scanned using a dynamic scan protocol from 0 to 30 min and then again from 90 to 110 min after intravenous injection of 185 MBq (± 10%) [18F]flutemetamol (Heeman et al. 2018). Prior to each part of the PET scan, a T1‐weighted gradient echo pulse MRI scan was obtained and used for attenuation correction. The first dynamic emission scan was reconstructed into 18 frames with progressive increase in frame length (6 × 5, 3 × 10, 4 × 60, 2 × 150, 2 × 300, 1 × 600 s). The second part of the scan consists of 4 × 5‐min frames. vinci viewing software 2.56 (Max Planck Institute for neurological research, Cologne, Germany) and in‐house build tools were used to co‐register and combine the two PET scans into a single multi‐frame image. Additionally, each individual's T1 was co‐registered to the dynamic PET image using the generic multimodality setting of Vinci with a linear rigid‐body scheme and normalized mutual information as the similarity measure. Parametric non‐displaceable binding potential (BP ND) images were generated from the entire image set using the receptor parametric mapping (RPM) (Gunn et al. 1997; Wu & Carson 2002) implementation in PPET (Boellaard et al. 2006). Standard uptake value ratio (SUVr) images were constructed based on the 90–110 min acquired data. Cerebellar grey matter as defined by the Hammers atlas was used as the reference region for both analyses (Hammers et al. 2003). Finally, global values were computed based on the volume weighted average of frontal (superior, middle, and inferior frontal gyrus), parietal (posterior cingulate, superior parietal gyrus, postcentral gyrus, and inferolateral remainder of parietal lobe), and temporal (parahippocampal gyrus, hippocampus, medial temporal lobe, superior, middle, and inferior temporal gyrus) regions (Tolboom et al. 2009).
All SUVr images were visually read by an experienced nuclear physician (BvB) and a positive or negative rating was awarded according to criteria defined by the manufacturer (GE Healthcare) (Collij et al. 2018).
Statistical analysis
To normalize the distribution for parametric binding potential (BP ND), a log transformation was applied. Analyses with these as dependent variables are thus reported in ratios instead of regression coefficients. A ratio can take any value from 0 onwards, where 1 means there is no relationship, <1 means there is a negative relationship (i.e. with an increase in the independent variable, the dependent variable will decrease) and > 1 means there is a positive relationship (i.e. with an increase in the independent variable, the dependent variable will also increase). Relationships between amyloid positivity/global BP ND and retinal thickness were analyzed with Generalized Estimating Equations (GEE) using SPSS (IBM, version 22), to correct for clustering in the data from twin pairs as well as confounders such as age, gender and a diagnosis of diabetes (as previous studies have shown that diabetes can have a significant impact on retinal thinning, even in the absence of diabetic retinopathy) (De Clerck et al. 2015). Data from monozygotic siblings can be correlated and thus observations are not independent. Generalized Estimating Equations (GEE) takes such dependencies into account. As multiple yet related variables (retinal layer thicknesses, segments of pRNFL) were tested, a correction for multiple testing is warranted. We applied the Holm‐Bonferroni method to obtain adjusted p‐values alongside the raw p‐values (Holm 1979). Intra‐twin pair correlations were calculated using Pearson/Spearman correlation coefficients in SPSS (IBM, version 22). These correlations signify the similarity between the twins from a pair for certain traits. This correlation is high when a trait is mainly determined by genetic factor, as monozygotic twins share their genomic DNA (Ouwens et al. 2018).
Results
Of the 217 approached subjects, 23 were excluded due to: failed PET scanning (N = 8), epileptic seizures (N = 1), heart problems (N = 1), not meeting neuropsychological inclusion criteria (N = 3), neurodegenerative disease (N = 2), no hospital study visit (N = 7) or transient ischemic attack (N = 1), leaving 194 participants. Of these 194 participants, 29 participants were excluded due to ophthalmological pathology (mostly age‐related macular degeneration, glaucoma or bilateral epiretinal membrane) or low quality scans, leaving a total of 165 participants for analyses (75 monozygotic twin pairs and 15 twins from incomplete pairs). Table 1 shows the demographic information of this group.
Table 1.
Demographics of the study population, data are means unless otherwise specified
| Number of participants (N) | 165 |
| Age (years) | 69.5 (±6.9) |
| Sex, female N (%) | 95 (57.6%) |
| BCVA (LogMAR) | 0.02 (±0.10) |
| IOP (mmHg) | 14.3 (±2.7) |
| Spherical Equivalent | 0.45 (±1.82) |
| MMSE (median, IQR) | 29.0 (28.5–30.0) |
| Brain amyloid status, positive N (%) | 18 (10.9%) |
| Global BP ND of Aβ (median, IQR) | 0.120 (0.087–0.177) |
| Macular retinal layer thickness: | |
| Total RT inner ring (μm) | 342.0 (±15.6) |
| Total RT outer ring (μm) | 295.9 (±12.8) |
| RNFL inner ring (μm) | 21.9 (±1.9) |
| RNFL outer ring (μm) | 36.5 (±4.5) |
| GCL inner ring (μm) | 50.3 (±4.7) |
| GCL outer ring (μm) | 34.4 (±3.2) |
| IPL inner ring (μm) | 41.2 (±3.2) |
| IPL outer ring (μm) | 28.7 (±2.4) |
| pRNFL | |
| Average (μm) | 97.9 (±8.6) |
| Nasal superior (μm) | 104.2 (±16.7) |
| Nasal (μm) | 73.8 (±12.8) |
| Nasal inferior (μm) | 109.3 (±21.4) |
| Temporal inferior (μm) | 140.6 (±19.4) |
| Temporal (μm) | 72.4 (±11.2) |
| Temporal superior (μm) | 133.2 (±18.0) |
BCVA = best corrected visual acuity (both eyes averaged); BP ND = non‐displaceable binding potential; GCL = ganglion cell layer; IOP = intra‐ocular pressure (both eyes averaged); IPL = inner plexiform layer; IQR = inter‐quartile range; MMSE = mini mental stat exam; pRNFL = peripapillary retinal nerve fiber layer; RNFL = retinal nerve fiber layer; RT = retinal thickness.
Retinal layer thickness was not significantly different between amyloid positive (Aβ+) participants versus amyloid negative (Aβ−) participants. Figure 1 shows box plots and differences in means of the retinal layer thickness in the macular region of both groups, Fig. 2 shows box plots and differences in means of the pRNFL sectors of both groups.
Figure 1.
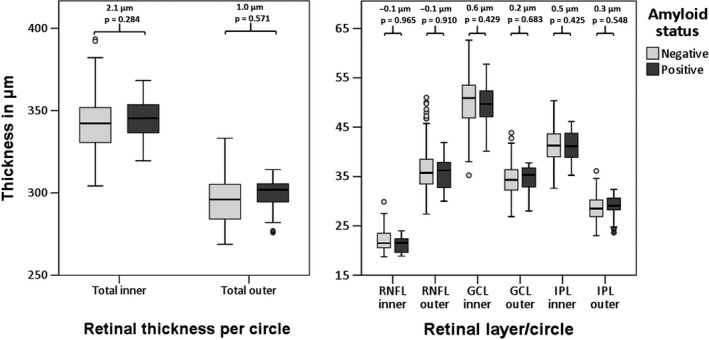
Boxplots of retinal (layer) thicknesses in the macula for amyloid positive versus amyloid negative participants. Reported are differences in means between amyloid positive and amyloid negative participants as obtained with GEE, corrected for age, gender and diagnosis of diabetes. RNFL = retinal nerve fiber layer, GCL = ganglion cell layer, IPL = inner plexiform layer.
Figure 2.
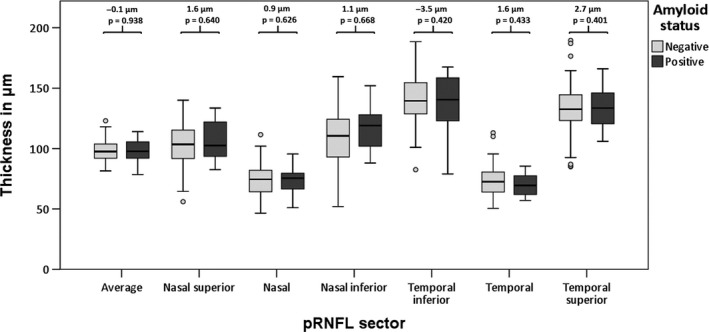
Boxplots of peripapillary retinal nerve fiber layer thicknesses in 6 sectors for amyloid positive versus amyloid negative participants. Reported are differences in means between amyloid positive and amyloid negative participants as obtained with GEE, corrected for age, gender and diagnosis of diabetes.
The parametric BP ND of [18F] Flutemetamol was used as a continuous measure for brain amyloid load. Global BP ND was positively associated with total retinal thickness in the inner ring. When correcting for multiple testing using the Holm‐Bonferroni method, this associations lost its statistical significance. Table 2 shows all associations between global BP ND and retinal layer thickness.
Table 2.
Associations between global cortical non‐displaceable binding potential of amyloid‐beta and retinal (layer) thickness given in ratios due to a log transformation applied to the dependent variable
| Global cortical non‐displaceable binding potential of Aβ | ||||
|---|---|---|---|---|
| Ratio | Raw p‐value | 95% CI | Adjusted p‐value | |
| Macula | ||||
| Total RT inner ringa | 2.00 | 0.018 | 1.12–3.55 | 0.144 |
| Total RT outer ringa | 2.19 | 0.055 | 0.98–4.90 | 0.385 |
| RNFL inner ringb | 0.78 | 0.321 | 0.47–1.28 | 0.999 |
| RNFL outer ringb | 1.01 | 0.965 | 0.80–1.26 | 0.965 |
| GCL inner ringb | 1.08 | 0.450 | 0.89–1.32 | 0.999 |
| GCL outer ringb | 1.04 | 0.816 | 0.74–1.46 | 0.999 |
| IPL inner ringb | 1.28 | 0.143 | 0.92–1.77 | 0.858 |
| IPL outer ringb | 1.26 | 0.353 | 0.77–2.05 | 0.999 |
| pRNFL | ||||
| Averagea | 0.74 | 0.657 | 0.20–2.75 | 0.999 |
| Nasal superiora | 0.92 | 0.800 | 0.49–1.75 | 0.999 |
| Nasala | 0.90 | 0.810 | 0.39–2.08 | 0.999 |
| Nasal inferiora | 1.15 | 0.590 | 0.69–1.93 | 0.999 |
| Temporal inferiora | 0.99 | 0.960 | 0.62–1.57 | 0.960 |
| Temporala | 0.71 | 0.450 | 0.29–1.74 | 0.999 |
| Temporal superiora | 1.26 | 0.481 | 0.66–2.41 | 0.999 |
Aβ = amyloid beta; CI = confidence interval; GCL = ganglion cell layer; IPL = inner plexiform layer; pRNFL = peripapillary retinal nerve fiber layer; RNFL = retinal nerve fiber layer; RT = retinal thickness.
Bold p‐values are significant at p < 0.05. GEE, corrected for age, gender and diagnosis of diabetes.
Reported in steps of 100.
Reported in steps of 10. Adjusted p‐values were calculated using the Holm‐Bonferroni method.
All retinal layer thicknesses and brain PET parameters correlated moderately to highly within twin pairs, except for the visual rating of amyloid positivity, which did not correlate (Table 3). Because there were no relations between retinal layer thicknesses and global BP ND, it was not possible to perform twin specific analyses on relations between these variables.
Table 3.
Intra‐twin pair correlation coefficients
| Correlation coefficient | p‐value | |
|---|---|---|
| Macula | ||
| Total RT inner ring | 0.92 | <0.001 |
| Total RT outer ring | 0.88 | <0.001 |
| RNFL inner ring | 0.77 | <0.001 |
| RNFL outer ring | 0.88 | <0.001 |
| GCL inner ring | 0.83 | <0.001 |
| GCL outer ring | 0.91 | <0.001 |
| IPL inner ring | 0.80 | <0.001 |
| IPL outer ring | 0.90 | <0.001 |
| pRNFL | ||
| Average | 0.80 | <0.001 |
| Nasal superior | 0.67 | <0.001 |
| Nasal | 0.76 | <0.001 |
| Nasal inferior | 0.83 | <0.001 |
| Temporal inferior | 0.59 | <0.001 |
| Temporal | 0.75 | <0.001 |
| Temporal superior | 0.57 | <0.001 |
| Brain PET measures | ||
| Amyloid positivity (visual rating) | 0.21 | 0.068 |
| Global BP ND of Aβ | 0.60 | <0.001 |
Aβ = amyloid beta; BP ND = non‐displaceable binding potential; GCL = ganglion cell layer; IPL = inner plexiform layer; RNFL = retinal nerve fiber layer; RT = retinal thickness.
Discussion
In this study, no differences were found between participants with amyloid beta (Aβ) on PET and those without Aβ with regards to total retinal thickness or any of the inner retinal layers in the macular region, nor in the peripapillary retinal nerve fibre layer (pRNFL) thickness. There was an unexpected positive association between total retinal thickness in the inner circle with BP ND of [18F] Flutemetamol. This association did not retain statistical significance when the p‐value was corrected for multiple testing.
The finding that there were no differences in retinal layer thickness in both the macular and the peripapillary region between amyloid positive and amyloid negative individuals were in contrast to studies performed in individuals with AD dementia, which reported a reduction in retinal layer thickness in both the macular and the peripapillary region, especially in the inner retinal layers (RNFL, GCL, IPL) (den Haan et al. 2017; Chan et al. 2018). A possible explanation could be that retinal thinning due to neurodegeneration is only noticeable relatively late in AD, for example resulting from retrograde trans‐synaptic neurodegeneration, and cannot yet be found in the preclinical phase of AD (Davis et al. 2016). Moreover, previous studies had several limitations that might have overestimated disease effects on retinal thinning. The majority of studies did not define their study population clearly, neither neurologically (i.e. how was the diagnosis of AD made, in what stages are the participants at the time of the study) nor ophthalmologically (i.e. controlling for confounding ophthalmological diseases, such as glaucoma and diabetes). Furthermore, many of the changes found were modest in effect size. Most importantly, almost none of the studies corrected for multiple testing, despite looking at several equivalent parameters.In support of the absence of differences in retinal layer thickness in AD patients, there are several other studies which do not report such changes (Gharbiya et al. 2014; Pillai et al. 2016; den Haan et al. 2018).
One other study group also looked at structural retinal changes in preclinical AD, in both a cross‐sectional study and a longitudinal study (Snyder et al. 2016; Santos et al. 2018). The present findings are in contrast with the cross‐sectional study, which reported a larger volume of the inner plexiform layer in individuals positive for Aβ on PET (Snyder et al. 2016). A possible explanation for this discrepancy with our results may be that we looked at retinal layer thickness, rather than volume. Nevertheless, as these parameters are closely related, an increase in volume should have reflected as an increase in thickness as well. Furthermore, the increase in IPL volume reported was modest, and after correction for multiple testing it lost its statistical significance.
In line with our study, no differences in retinal layer thickness or volume was found in the baseline data of the longitudinal study (Santos et al. 2018). However, Aβ positivity was associated with an increased reduction in the macular RNFL, ONL and IPL volume and higher standardized uptake value ratio (SUVr) of Aβ was associated with increased reduction of macular RNFL during a follow‐up of 27 months. This could suggest increased retinal neurodegeneration in individuals with preclinical AD. Therefore, longitudinal measurements of retinal layer thickness might be more sensitive in separating preclinical AD cases from controls.
When retinal layer thickness was correlated with cortical Aβ load as a continuous measure (BP ND), an unexpected weak positive association of total retinal thickness in the macula in the inner ring with increased Aβ binding was found (Table 2). This association was modest, as it did not survive a correction for multiple testing. We therefore doubt whether this association is of a truly biological origin, further research is needed to establish this.
Intra‐twin pair correlations were moderate to high for all retinal layer thicknesses, suggesting a high contribution of either genes or shared environment to these traits (Table 3). As no dizygotic twin pairs were included, the relative contribution of genetics and shared environmental factors on these traits could not be determined. Previous twin studies, however, indicated that these traits are mainly driven by genetic factors (Hougaard et al. 2003; Chamberlain et al. 2006; Hinrichs et al. 2010; Kwun et al. 2011).
No twin analyses on the contribution of genetic and environmental factors on the relation between amyloid aggregation and retinal parameters were performed, as there was no association in the total population (De Moor et al. 2008; Vitaro et al. 2009).
One of the strengths of this study is the detailed characterization of participants, both from a neurological as well as an ophthalmological perspective. Participants were extensively screened for cognitive health, ensuring only cases of preclinical AD (i.e. cognitively completely healthy) were included. All confounders affecting retinal thickness were either controlled for (diabetes), or excluded from the study (glaucoma, vascular occlusions, AMD).
This study also has some limitations. The group of amyloid positive individuals consists of only 18 participants, limiting statistical power. As only around 20% of individuals around ages 70 are positive for Aβ, this is a common problem in studies assessing pre‐clinical AD (Jansen et al. 2015). However, if the lack of any associations found within this study were only due to a shortage in statistical power, one would still expect reasonable effect sizes in a consistent direction (i.e. thinning) and stronger associations when using a continuous outcome measure. This was not the case in our study. Additionally, post‐hoc power calculation revealed that our sample of 147 amyloid negative and 18 amyloid positive participants had sufficient power to detect a difference in total macular thickness of 10% with an α = 0.05 (two‐sided), 1−β = 0.8 and a sampling ratio of 0.1, although this was too small to find a 10% difference in mean pRNFL thickness (data not shown).
In conclusion, retinal layer thickness was not able to discriminate between preclinical AD and controls, suggesting that it cannot serve as a biomarker in preclinical stages of AD. Whether amyloid pathology is associated with a decline in retinal thickness over time, in parallel with brain degeneration, will be tested in future studies in this cohort.
This work has received support from the EU/EFPIA Innovative Medicines Initiative Joint Undertaking (EMIF grant number 115372). This work has received funding from GE Healthcare in kind (PET tracer).
References
- Boellaard RY, Yaqub M, Lubberink M & Lammertsma A (2006): PPET: a software tool for kinetic and parametric analyses of dynamic PET studies. NeuroImage 31: T62. [Google Scholar]
- Boomsma DI, de Geus EJ, Vink JM et al. (2006): Netherlands Twin Register: from twins to twin families. Twin Res Hum Genet 9: 849–857. [DOI] [PubMed] [Google Scholar]
- Chamberlain MD, Guymer RH, Dirani M, Hopper JL & Baird PN (2006): Heritability of macular thickness determined by optical coherence tomography. Invest Ophthalmol Vis Sci 47: 336–340. [DOI] [PubMed] [Google Scholar]
- Chan VTT, Sun Z, Tang S et al. (2018): Spectral domain‐optical coherence tomography measurements in Alzheimer's disease: a systematic review and meta‐analysis. Ophthalmology 126: 497–510. [DOI] [PMC free article] [PubMed] [Google Scholar]
- Collij L, Konijnenberg E, Reimand J et al. (2018): Assessing amyloid pathology in cognitively normal subjects using [(18)F]Flutemetamol PET: comparing visual reads and quantitative methods. J Nucl Med 60: 541–547. [DOI] [PMC free article] [PubMed] [Google Scholar]
- Davis BM, Crawley L, Pahlitzsch M, Javaid F & Cordeiro MF (2016): Glaucoma: the retina and beyond. Acta Neuropathol 132: 807–826. [DOI] [PMC free article] [PubMed] [Google Scholar]
- De Clerck EE, Schouten JS, Berendschot TT et al. (2015): New ophthalmologic imaging techniques for detection and monitoring of neurodegenerative changes in diabetes: a systematic review. Lancet Diabetes Endocrinol 3: 653–663. [DOI] [PubMed] [Google Scholar]
- De Moor MH, Boomsma DI, Stubbe JH, Willemsen G & de Geus EJ (2008): Testing causality in the association between regular exercise and symptoms of anxiety and depression. Arch Gen Psychiatry 65: 897–905. [DOI] [PubMed] [Google Scholar]
- Eratne D, Loi SM, Farrand S, Kelso W, Velakoulis D & Looi JC (2018): Alzheimer's disease paper 1: clinical update on epidemiology, pathophysiology and diagnosis. Australas Psychiat 1039856218762308. [DOI] [PubMed] [Google Scholar]
- Frost S, Martins RN & Kanagasingam Y (2010): Ocular biomarkers for early detection of Alzheimer's disease. J Alzheimers Dis 22: 1–16. [DOI] [PubMed] [Google Scholar]
- Gharbiya M, Trebbastoni A, Parisi F et al. (2014): Choroidal thinning as a new finding in Alzheimer's disease: evidence from enhanced depth imaging spectral domain optical coherence tomography. J Alzheimers Dis 40: 907–917. [DOI] [PubMed] [Google Scholar]
- Gunn RN, Lammertsma AA, Hume SP & Cunningham VJ (1997): Parametric imaging of ligand‐receptor binding in PET using a simplified reference region model. NeuroImage 6: 279–287. [DOI] [PubMed] [Google Scholar]
- den Haan J, Verbraak FD, Visser PJ & Bouwman FH (2017): Retinal thickness in Alzheimer's disease: A systematic review and meta‐analysis. Alzheimers Dement (Amst) 6: 162–170. [DOI] [PMC free article] [PubMed] [Google Scholar]
- den Haan J, Janssen SF, van de Kreeke JA, Scheltens P, Verbraak FD & Bouwman FH (2018): Retinal thickness correlates with parietal cortical atrophy in early‐onset Alzheimer's disease and controls. Alzheimers Dement (Amst) 10: 49–55. [DOI] [PMC free article] [PubMed] [Google Scholar]
- Hammers A, Allom R, Koepp MJ et al. (2003): Three‐dimensional maximum probability atlas of the human brain, with particular reference to the temporal lobe. Hum Brain Mapp 19: 224–247. [DOI] [PMC free article] [PubMed] [Google Scholar]
- Heeman FY, Yaqub M, Heurling K, Lopes Alves I, Gispert JD, Foley C & Lammertsma AA (2018): P20: Optimized coffee‐break protocol for quantitative [18F]flutemetamol studies. Human Amyloid Imaging Conference. Miami, Florida.
- Hinrichs AL, Mintun MA, Head D, Fagan AM, Holtzman DM, Morris JC & Goate AM (2010): Cortical binding of pittsburgh compound B, an endophenotype for genetic studies of Alzheimer's disease. Biol Psychiatry 67: 581–583. [DOI] [PMC free article] [PubMed] [Google Scholar]
- Holm S (1979): A simple sequentially rejective multiple test procedure. Scand J Stat 6: 65–70. [Google Scholar]
- Hornberger J, Bae J, Watson I, Johnston J & Happich M (2017): Clinical and cost implications of amyloid beta detection with amyloid beta positron emission tomography imaging in early Alzheimer's disease ‐ the case of florbetapir. Curr Med Res Opin 33: 675–685. [DOI] [PubMed] [Google Scholar]
- Hougaard JL, Kessel L, Sander B, Kyvik KO, Sorensen TI & Larsen M (2003): Evaluation of heredity as a determinant of retinal nerve fiber layer thickness as measured by optical coherence tomography. Invest Ophthalmol Vis Sci 44: 3011–3016. [DOI] [PubMed] [Google Scholar]
- Jack CR Jr, Barrio JR & Kepe V (2013): Cerebral amyloid PET imaging in Alzheimer's disease. Acta Neuropathol 126: 643–657. [DOI] [PMC free article] [PubMed] [Google Scholar]
- de Jager CA, Budge MM & Clarke R (2003): Utility of TICS‐M for the assessment of cognitive function in older adults. Int J Geriatr Psychiatry 18: 318–324. [DOI] [PubMed] [Google Scholar]
- Jansen WJ, Ossenkoppele R, Knol DL et al. (2015): Prevalence of cerebral amyloid pathology in persons without dementia: a meta‐analysis. JAMA 313: 1924–1938. [DOI] [PMC free article] [PubMed] [Google Scholar]
- Khan TK (2018): An algorithm for preclinical diagnosis of Alzheimer's disease. Front Neurosci 12: 275. [DOI] [PMC free article] [PubMed] [Google Scholar]
- Konijnenberg E, Carter SF, Ten Kate M et al. (2018): The EMIF‐AD PreclinAD study: study design and baseline cohort overview. Alzheimers Res Ther 10: 75. [DOI] [PMC free article] [PubMed] [Google Scholar]
- van de Kreeke JA, Nguyen HT, Konijnenberg E et al. (2018): Retinal and cerebral microvasculopathy: relationships and their genetic contributions. Invest Ophthalmol Vis Sci 59: 5025–5031. [DOI] [PubMed] [Google Scholar]
- Kumar A, Singh A & Ekavali (2015): A review on Alzheimer's disease pathophysiology and its management: an update. Pharmacol Rep 67: 195–203. [DOI] [PubMed] [Google Scholar]
- Kwun Y, Sung J, Yang Y, Yang S, Ham DI & Song YM (2011): Genetic influences on macular thickness in Koreans: the healthy twin study. Invest Ophthalmol Vis Sci 52: 9523–9526. [DOI] [PubMed] [Google Scholar]
- Leuzy A, Zimmer ER, Heurling K, Rosa‐Neto P & Gauthier S (2014): Use of amyloid PET across the spectrum of Alzheimer's disease: clinical utility and associated ethical issues. Amyloid 21: 143–148. [DOI] [PubMed] [Google Scholar]
- Lim JK, Li QX, He Z et al. (2016): The eye as a biomarker for Alzheimer's disease. Front Neurosci 10: 536. [DOI] [PMC free article] [PubMed] [Google Scholar]
- London A, Benhar I & Schwartz M (2013): The retina as a window to the brain‐from eye research to CNS disorders. Nat Rev Neurol 9: 44–53. [DOI] [PubMed] [Google Scholar]
- McGrory S, Cameron JR, Pellegrini E et al. (2017): The application of retinal fundus camera imaging in dementia: a systematic review. Alzheimers Dement (Amst) 6: 91–107. [DOI] [PMC free article] [PubMed] [Google Scholar]
- Mitka M (2013): PET imaging for Alzheimer disease: are its benefits worth the cost? JAMA 309: 1099–1100. [DOI] [PubMed] [Google Scholar]
- Montgomery W, Ueda K, Jorgensen M, Stathis S, Cheng Y & Nakamura T (2018): Epidemiology, associated burden, and current clinical practice for the diagnosis and management of Alzheimer's disease in Japan. Clinicoecon Outcomes Res 10: 13–28. [DOI] [PMC free article] [PubMed] [Google Scholar]
- Morris JC (1993): The Clinical Dementia Rating (CDR): current version and scoring rules. Neurology 43: 2412–2414. [DOI] [PubMed] [Google Scholar]
- Morris JC, Heyman A, Mohs RC, Hughes JP, G van Belle, Fillenbaum G, Mellits ED & Clark C (1989): The Consortium to establish a Registry for Alzheimer's Disease (CERAD). Part I. Clinical and neuropsychological assessment of Alzheimer's disease. Neurology 39: 1159–1165. [DOI] [PubMed] [Google Scholar]
- Nishii R, Higashi T, Kagawa S et al. (2018): (18)F‐FPYBF‐2, a new F‐18 labelled amyloid imaging PET tracer: biodistribution and radiation dosimetry assessment of first‐in‐man (18)F‐FPYBF‐2 PET imaging. Ann Nucl Med 32: 256–263. [DOI] [PubMed] [Google Scholar]
- Ouwens KG, Jansen R, Tolhuis B, Slagboom PE, Penninx B & Boomsma DI (2018): A characterization of postzygotic mutations identified in monozygotic twins. Hum Mutat 39: 1393–1401. [DOI] [PMC free article] [PubMed] [Google Scholar]
- Pillai JA, Bermel R, Bonner‐Jackson A et al. (2016): Retinal nerve fiber layer thinning in Alzheimer's disease: a case‐control study in comparison to normal aging, Parkinson's disease, and non‐Alzheimer's dementia. Am J Alzheimers Dis Other Demen 31: 430–436. [DOI] [PMC free article] [PubMed] [Google Scholar]
- Prince M, Bryce R, Albanese E, Wimo A, Ribeiro W & Ferri CP (2013): The global prevalence of dementia: a systematic review and metaanalysis. Alzheimers Dement 9: 63‐75 6: 2. [DOI] [PubMed] [Google Scholar]
- Santos CY, Johnson LN, Sinoff SE, Festa EK, Heindel WC & Snyder PJ (2018): Change in retinal structural anatomy during the preclinical stage of Alzheimer's disease. Alzheimers Dement (Amst) 10: 196–209. [DOI] [PMC free article] [PubMed] [Google Scholar]
- Scheinin NM, Tolvanen TK, Wilson IA, Arponen EM, Nagren KA & Rinne JO (2007): Biodistribution and radiation dosimetry of the amyloid imaging agent 11C‐PIB in humans. J Nucl Med 48: 128–133. [PubMed] [Google Scholar]
- Snyder PJ, Johnson LN, Lim YY, Santos CY, Alber J, Maruff P & Fernandez B (2016): Nonvascular retinal imaging markers of preclinical Alzheimer's disease. Alzheimers Dement (Amst) 4: 169–178. [DOI] [PMC free article] [PubMed] [Google Scholar]
- Sun BL, Li WW, Zhu C et al. (2018): Clinical research on Alzheimer's disease: progress and perspectives. Neurosci Bull 34: 1111–1118. [DOI] [PMC free article] [PubMed] [Google Scholar]
- Ten Kate M, Sudre CH, den Braber A et al. (2018): White matter hyperintensities and vascular risk factors in monozygotic twins. Neurobiol Aging 66: 40–48. [DOI] [PubMed] [Google Scholar]
- Tolboom N, Yaqub M, van der Flier WM et al. (2009): Detection of Alzheimer pathology in vivo using both 11C‐PIB and 18F‐FDDNP PET. J Nucl Med 50: 191–197. [DOI] [PubMed] [Google Scholar]
- Vina J & Sanz‐Ros J (2018): Alzheimer's disease: only prevention makes sense. Eur J Clin Invest 48: e13005. [DOI] [PubMed] [Google Scholar]
- Vitaro F, Brendgen M & Arseneault L (2009): The discordant MZ‐twin method: one step closer to the holy grail of causality. Int J Behav Develop 33: 376–382. [Google Scholar]
- Vlassenko AG, Benzinger TL & Morris JC (2012): PET amyloid‐beta imaging in preclinical Alzheimer's disease. Biochim Biophys Acta 1822: 370–379. [DOI] [PMC free article] [PubMed] [Google Scholar]
- Wu Y & Carson RE (2002): Noise reduction in the simplified reference tissue model for neuroreceptor functional imaging. J Cereb Blood Flow Metab 22: 1440–1452. [DOI] [PubMed] [Google Scholar]
- Yesavage JA, Brink TL, Rose TL, Lum O, Huang V, Adey M & Leirer VO (1982): Development and validation of a geriatric depression screening scale: a preliminary report. J Psychiatr Res 17: 37–49. [DOI] [PubMed] [Google Scholar]
- Zhang S, Smailagic N, Hyde C, Noel‐Storr AH, Takwoingi Y, McShane R & Feng J (2014): (11)C‐PIB‐PET for the early diagnosis of Alzheimer's disease dementia and other dementias in people with mild cognitive impairment (MCI). Cochrane Database Syst Rev: CD010386. [DOI] [PMC free article] [PubMed] [Google Scholar]