

Summary
In the antennal lobe (AL), the first olfactory relay of Drosophila, excitatory neurons are predominantly cholinergic. Ionotropic nicotinic receptors play a vital role in the effects of acetylcholine in the AL. However, the AL also has a high expression level of metabotropic muscarinic acetylcholine receptors type A (mAChRs-A). Nevertheless, the neurons expressing them and their role in the AL are unknown. Elucidating their function may reveal principles in olfactory modulation. Here, we show that mAChRs-A shape AL output and affect behavior. We localized mAChRs-A effects to a sub-population of GABAergic local neurons (iLNs), where they play a dual role: direct excitation of iLNs and stabilization of the synapse between receptor neurons and iLNs, which undergoes strong short-term depression. Our results reveal modulatory functions of the AL main excitatory neurotransmitter. Striking similarities to the mammalian olfactory system predict that mammalian glutamatergic metabotropic receptors could be associated with similar modulations.
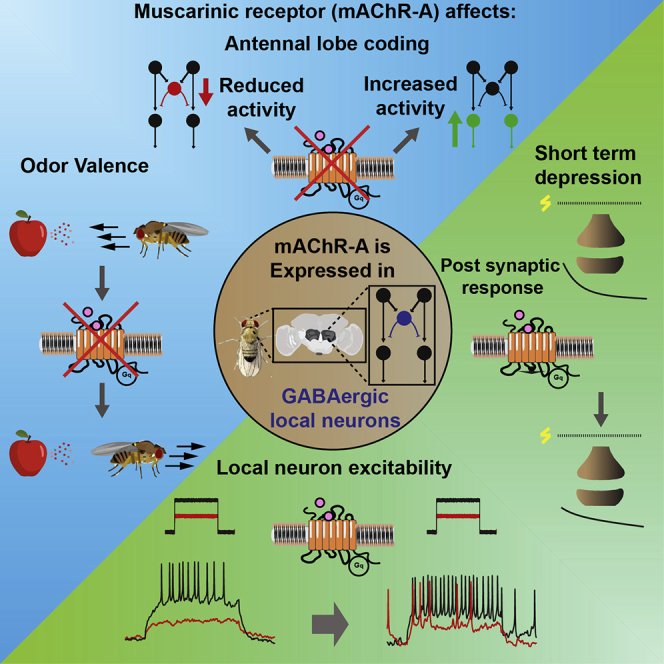
Graphical Abstract
Highlights
-
•
mAChR-A affects GABAergic local neurons in the fly’s antennal lobe
-
•
mAChR-A activity changes the antennal lobe odor coding and odor valence
-
•
mAChR-A protects the GABAergic local neurons from short-term depression
-
•
mAChR-A activation increases the excitability of GABAergic local neurons
The function of muscarinic receptors (mAChR-A) in the Drosophila first olfactory relay, the antennal lobe (AL), is unknown. Rozenfeld et al. show that GABAergic local neurons (iLNs) express mAChR-A, which excites them and potentiates the synapse between receptor neurons and iLNs. mAChR-A knockdown affects AL output and odor valance.
Introduction
Most animals in the animal kingdom rely on olfaction for survival. Odorants provide crucial information about the nature and location of food, potential mating partners, predators, and other danger cues (Li and Liberles, 2015). The Drosophila olfactory system resembles that of higher organisms, solves olfactory coding in the same manner (Li and Liberles, 2015, Touhara and Vosshall, 2009), and therefore serves as a prime model system to understand olfactory coding (Wilson, 2013). Although metabotropic receptors for the principal excitatory neurotransmitter are highly expressed in the first relay of the Drosophila olfactory pathway (Blake et al., 1993, Hannan and Hall, 1996), their role remains entirely obscure. As metabotropic receptors often have regulatory roles (Lizbinski and Dacks, 2018), elucidating their function may reveal principles in olfactory coding.
Flies detect odorant cues using cholinergic olfactory receptor neurons (ORNs) in their antennae and maxillary palps, where each ORN expresses a single odorant receptor gene (Hallem and Carlson, 2004, Vosshall et al., 1999). Axons of ORNs expressing the same receptor converge onto the same glomerulus in the antennal lobe (AL; homologous to the mammalian olfactory bulb) (Gao et al., 2000, Vosshall et al., 2000). Upon binding an odorant, ORNs can reach high firing rates (Hallem and Carlson, 2006), and the synapse between ORNs and second-order neurons is subsequently subjected to strong short-term depression (STD), arising in part from vesicle depletion in the ORNs (Kazama and Wilson, 2008, Martelli and Fiala, 2019, Nagel and Wilson, 2016, Nagel et al., 2015, Olsen and Wilson, 2008). The AL also contains second-order excitatory cholinergic projection neurons (ePNs), which receive input from a single ORN type, as well as inhibitory GABAergic projection neurons (iPNs), which are mostly multiglomerular (Tanaka et al., 2012). ePNs serve as one of the primary output channels of the AL and delivers odor information to the lateral horn (mostly responsible for innate odor valance) and to the mushroom body (mostly responsible for learning and memory) (Tanaka et al., 2012). In addition to the 2 types of PNs, the AL also contains a large and heterogeneous population of local neurons (LNs). These include excitatory cholinergic LNs (eLNs) and inhibitory GABAergic and glutamatergic LNs (iLNs). Similar to the iPNs, LNs are mostly multiglomerular, with each LN covering a subgroup of glomeruli (Chou et al., 2010, Liu and Wilson, 2013, Olsen et al., 2007, Root et al., 2008, Seki et al., 2010, Shang et al., 2007, Tanaka et al., 2012).
Neurons innervating the AL perform various computations on olfactory sensory information, such as increasing the signal-to-noise ratio, gain control, habituation, signal separation, and enhancement of interglomerular contrast (Das et al., 2011, Galizia, 2014, Masse et al., 2009, Mohamed et al., 2019, Olsen and Wilson, 2008, Olsen et al., 2010, Sudhakaran et al., 2012, Root et al., 2008). While these tasks involve all of the different neurons in the AL, and thus various types of neurotransmitters, the cholinergic neurons play a major role in AL computation, either directly or by recruiting LNs. Ionotropic nicotinic receptors play a vital role in the effects of acetylcholine (ACh), the main excitatory neurotransmitter of the fly (Nagel et al., 2015). However, over 25 years ago, in situ hybridization and immunocytochemical localization revealed that the AL also expresses high levels of metabotropic muscarinic ACh receptors (mAChRs) (Blake et al., 1993, Hannan and Hall, 1996). Despite this abundance of mAChRs, their role in the AL remains completely unknown.
The Drosophila genome contains genes coding for 3 mAChRs (Collin et al., 2013, Onai et al., 1989, Shapiro et al., 1989, Xia et al., 2016), but only 2 of them, the A type and the B type (mAChR-A and mAChR-B, respectively) are expressed in the Drosophila brain (Croset et al., 2018, Davie et al., 2018). mAChR-A is homologous to the vertebrate M1, M3, and M5 type mAChRs. Like them, it is activated by muscarine (in addition to ACh), it is coupled to Gq, and it is blocked by mAChR antagonists such as atropine (Collin et al., 2013, Ren et al., 2015). mAChR-B, on the other hand, is homologous to the vertebrate M2 and M4 type mAChRs, it has a 1,000‐fold lower sensitivity to muscarine (although ACh activates it normally), and it is coupled to Gi/o, but it is not blocked by known mAChRs antagonists (Collin et al., 2013, Ren et al., 2015).
Here, we show that mAChR-A is important for AL output and that reducing mAChR-A activity either by pharmacological or genetic means, increases the odor responses of ePNs. We used anatomical and functional methods to localize the effects mediated through mAChR-A to a subpopulation of GABAergic iLNs. Our results revealed that the physiological effects on ePNs are followed by changes in odor perception and behavioral output. In addition, the results indicate that mAChR-A acts by increasing the response of iLNs to odors and stabilizing the synapse between ORNs and iLNs by reducing the STD that this synapse undergoes. We further demonstrate that mAChR-A increases the excitability of iLNs. The striking similarities to the mammalian olfactory system may suggest that the mammalian glutamatergic metabotropic receptors (mGluRs) play a similar role in synaptic stabilization.
Results
Blocking mAChR-A Increases ePN Odor Response
To investigate the role of mAChR-A in the AL, we examined whether muscarine, an mAChR-A agonist, affects AL output (Figure 1A). This manipulation is specific for mAChR-A because although there are also high levels of mAChR-B in the AL (Croset et al., 2018, Davie et al., 2018), the affinity of mAChR-B to muscarine is 1,000-fold lower than that of mAChR-A (Collin et al., 2013). AL output was evaluated using 2-photon functional imaging to assess ePN responses to 4 odors: isoamyl acetate (IAA), 4-methylcyclohexanol (MCH), 3-octanol (3-OCT), and linalool. The GH146-GAL4 driver line (Heimbeck et al., 2001), which covers ∼70% of ePNs (Strutz et al., 2014), was used to drive the Ca2+ indicator GCaMP6f (Chen et al., 2013). Local application of muscarine to the AL had no significant effect on ePN odor responses or on the basal fluorescence level (Figures 1B–1D). In contrast, 30 min of exposure to muscarine significantly reduced both baseline activity and odor responses (Figures S1A and S1B). We then examined the effects of atropine, which in the fly is a specific antagonist for mAChR-A (Collin et al., 2013). In contrast to the results with muscarine, the local application of atropine significantly increased ePN responses to most of the odors examined (Figures 1B and 1C). These results were accompanied by an increase in the pre-stimulus basal activity (Figure 1D). The difference between the immediate effect of atropine and muscarine can arise from the different efficacy of ACh and muscarine. mAChR-A activation by muscarine is much lower than ACh (Collin et al., 2013); thus, atropine, which blocks the effects of endogenously released ACh, may exhibit faster effects than the slower activation by muscarine. We also tested the mean odor response during the entire odor presentation. Similar results were obtained using this approach (Figure S1C); thus, for further analysis, we used peak odor responses. The local application of external solution had no effect on ePN odor responses or basal activity (Figures S1D and S1E). Thus, mAChRs-A expressed in the AL, but not necessarily in ePNs, were responsible for the inhibitory effect seen on the basal activity of ePNs and their response to odors.
Figure 1.

Pharmacologically Blocking AL mAChR-A Increases ePN Odor Response
(A) Experimental scheme. ePN odor responses were imaged before and after local application, by pico injector, of muscarine (10 μM) or atropine (100 μM). GCaMP6f expression is indicated by green and radial lines indicate the imaging region.
(B) Top, averaged traces ± SEM (shading) of odor responses (as indicated, odor pulse is labeled with a black bar) obtained from a single plane of the entire AL for GCaMP6f labeled neurons driven by GH146-GAL4 for control (black) and following muscarine application (green). There was no effect of muscarine. Bottom, as in the top panel, but before (black) and following atropine application (dark blue). There was a significant increase in ePN odor responses (see also C) (n = 4–11 flies).
(C) Peak ΔF/F during odor response for the traces presented in the top panel. Application of atropine significantly increased the peak response to IAA, MCH, and linalool. Gray lines indicate single flies (n = 4–11 flies; ∗p < 0.05; for statistical analysis, see Table S1).
(D) Mean baseline activity for the traces presented in (B) shows a significant increase in baseline activity after atropine application. Gray lines indicate single flies (n = 19–29 flies; ∗∗p < 0.01; for statistical analysis, see Table S1).
(E) AL glomeruli diagram. The color scale indicates the ratio of the peak ΔF/F of individual glomeruli before and after atropine application (n = 4–16 glomeruli obtained from 18 flies; for statistical analysis, see Table S1).
Since various ePNs within the AL are subject to differential regulation (Hong and Wilson, 2015, Root et al., 2008), we next examined the effect of atropine application on 13 ePN types. Analysis of this separate dataset with respect to the entire AL (Figures S1F and S1G) confirmed the findings of Figure 1B. In all of the odors examined, atropine application resulted in an overall increase in odor responses in the different glomeruli. For IAA, post hoc comparisons revealed no significant increases in any of the individual ePNs (Table S1), and for linalool, an effect was found only in the VA5 ePN type (Figure 1E). In contrast, for apple cider vinegar (ACV), atropine application generated a strong differential increase between ePN activities (Figure 1E), with some ePNs demonstrating a marked increase in neural activity compared to the other ePNs (e.g., VA2, VA3; Figure 1E).These ePNs were previously found to be innervated by iLNs, and their activity was strongly affected by GABA application (Hong and Wilson, 2015), raising the possibility that mAChR-A affects mainly inhibitory LNs. Taken together, mAChR-A is expressed in the AL and plays a functional role in both baseline activity and odor responses. It also differentially affects individual ePN activity while causing a general ePN inhibition.
mAChR-A Is Expressed in a Subgroup of GABAergic iLNs
The Drosophila AL comprises a wide range of cell types, including ORN axons, excitatory and inhibitory PN dendrites, GABAergic and glutamatergic iLNs, cholinergic eLNs, and other modulatory neurons (Liu and Wilson, 2013, Lizbinski et al., 2018, Olsen et al., 2007, Root et al., 2008, Shang et al., 2007). Since atropine could affect all of the neurons in the AL, we examined which neurons express mAChR-A. Antibody-labeling experiments and single-cell RNA sequencing have previously demonstrated that mAChR-A is expressed pan-neuronally (Blake et al., 1993, Croset et al., 2018, Davie et al., 2018). To unravel in which AL neurons mAChR-A is expressed, we used mAChR-A-MiMIC-GAL4 flies (Bielopolski et al., 2019) to drive UAS-mCD8:eGFP. As previously reported, mAChR-A-MiMIC-GAL4 drove GFP expression throughout the brain (Blake et al., 1993, Croset et al., 2018, Davie et al., 2018, Hannan and Hall, 1996). No expression was detected in ePNs, iPNs, and ORNs (Figure S2A), as shown by a lack of fluorescence in the medial and mediolateral AL tract (mALT, mlALT), the lateral horn, and the antennal commissure (Video S1). This suggests that the observed effect of atropine is not due to a direct manipulation of mAChR-A in ePNs or ORNs.
Confocal sections (1.5 μm) through the central brain of a fly carrying mAChR-A-MiMIC-GAL4 > UAS-mCD8-GFP transgenes.
To isolate the cell population that expresses mAChR-A, we expressed GFP in mAChR-A-MiMIC-GAL4 flies and stained against choline acetyltransferase (ChAT antibody), GABA, and the vesicular glutamate transporter (dvGlut antibody). These represent the 3 major neurotransmitters in the AL. The results revealed that an average of 50.83 ± 23.9 cells (mean, STD, n = 6 flies) of the GABA+ neurons in the AL lateral cluster co-localized with MiMIC-mAChR-A-GAL4 (Figure 2A, top). ChAT antibody staining revealed that an average of 20.2 ± 8.16 AL cells (mean, STD, n = 5 flies) were also co-localized with neurons covered by the MiMIC-mAChR-A-GAL4 driver line; however, consistent with the lack of fluorescence in the mALT, these cholinergic neurons do not seem to be in the typical ePN cluster location (Figure 2A, center). In contrast, immunostaining against dvGlut revealed that only an average of 3.4 ± 1.14 AL cells (mean, STD, n = 5 flies) were also co-localized with cells expressing MiMIC-mAChR-A-GAL4 (Figure 2A, bottom).
Figure 2.

Anatomical and Functional Localization of mAChR-A
(A) Confocal sections through the AL of a fly carrying mAChR-A-MiMIC-GAL4 > UAS-mCD8-GFP transgenes (green, left column) after immunostaining (blue, middle column) against GABA (top row), ChAT (center row), and dvGlut (bottom row). Colocalization (pixel overlap) of both markers is presented in gray in the right column. Images are from an individual confocal section (1 μm). mAChR-A-MiMIC-GAL4 > UAS-mCD8-GFP is co-localized with a subpopulation of GABAergic neurons in the AL and with some cholinergic neurons; only a few glutamatergic cells show co-localization. In some cases, brightness and contrast were adjusted for visualization purposes. In those cases, the adjustments were made for the entire confocal stack and were the same for both channels. Orientation axis: D, dorsal; V, ventral; L, lateral; M, medial.
(B) Experimental scheme of (C). Flies were incubated with TTX (1 μM) to block all neuronal activity (designated by gray neurons). GCaMP6f was driven by different GAL4 driver lines (green). Radial lines indicate imaging region. Muscarine (10 μM) was applied by a pico injector. Imaging was performed in the AL.
(C) Mean baseline fluorescence obtained from a single plane of the entire AL in a 33.3-s time window for the designated GAL4 driver lines before and after the addition of muscarine. Gray lines indicate single flies (n = 5–6 flies; ∗p < 0.05, ∗∗p < 0.01; for statistical analysis, see Table S1).
The anatomical analysis revealed broad expression of mAChR-A in the AL. We therefore examined in which neurons mAChR-A exerts a physiological effect. mAChR-A is a Gq-coupled receptor that activates downstream phospholipase C and the release of Ca2+ from internal stores. Therefore, to examine for a functional role of mAChR-A, we drove GCaMP6f in different populations of AL neurons (ORNs, ePNs, iPNs, iLNs, and eLNs). To isolate the neurons from any circuits’ effects, brains were incubated with the voltage-gated Na+ channel blocker tetrodotoxin (TTX; Figure 2B). The efficiency of TTX in blocking AL neuronal activity was verified in ORNs (Figure S2B). We then examined whether the local application of muscarine could increase the level of Ca2+ in different types of neurons. Of 4 iLN driver lines tested—GH298-GAL4, NP3056-GAL4, LN674-GAL4, and LN2-GAL4—a significant increase in basal fluorescence level was observed for GH298-GAL4 and NP3056-GAL4 (Figure 2C). A significant effect was also observed for Orco-GAL4. No effect was observed for iPNs (MZ699-GAL4), ePNs (GH146-GAL4), or eLNs (krasavietz-GAL4) (Figure 2C). The local application of external solution or atropine had no effect on the basal fluorescence level (Figure S2C) in GH298-GAL4, which displayed the most robust effect. Knock down (KD) of mAChR-A in GH298-GAL4 using UAS-mAChR-A RNAi, which brings the mAChR-A level down to ∼30% of the original level (Bielopolski et al., 2019), reduced the effect of muscarine on those iLN Ca2+signals (Figure S2D). GABAergic LNs were demonstrated to be composed of a varied population of neurons with different morphology and functional properties (Chou et al., 2010, Liou et al., 2018, Mohamed et al., 2019, Nagel and Wilson, 2016). Therefore, to verify that we correctly identified the neuronal population in which mAChR-A is expressed, we co-expressed mAChR-A-GAL4 with various GAL4 lines and counted the number of overlapping neurons (Table S2). Consistent with the anatomical and functional results above, we found no overlap with ePNs and a large overlap with a sub-population of iLNs covered by GH298-GAL4, NP3056-GAL4, and HB4-93-GAL4 driver lines. HB4-93-GAL4 was demonstrated to have a large overlap with both GH298-GAL4 and NP3056-GAL4. Similarly, GH298-GAL4 and NP3056-GAL4 were demonstrated to have a modest overlap (Chou et al., 2010). The combined anatomical, functional, and physiological results indicate that mAChR-A acts on GABAergic iLNs, with the strongest effect occurring in a sub-population of iLNs covered by the GH298-GAL4 driver line.
Knock Down of mAChR-A in iLNs Increases ePN Odor Response
The results described so far suggest that atropine does not directly affect the ePN odor response, but rather that the increased response observed is a consequence of blocking mAChR-A in AL GABAergic iLNs. Because the strongest effect was seen in neurons covered by the GH298-GAL4 driver line (Stocker et al., 1997) (Figure 2C), this line was selected for further investigation. To this end, we first verified that GH298-GAL4 is relatively restricted to iLNs. In accordance with a previous report (Volders et al., 2012), we found that GH298-GAL4 drives expression mainly in AL neurons (Figure S2E). We also examined expression in the ventral nerve cord (VNC) and found very limited expression (Figure S2F). We used GH298-GAL4 to specifically KD mAChR-A in GABAergic iLNs and the GH146-QF driver line along with the QUAS-GCaMP3 transgene to assess the effect on ePN odor responses (Figure 3A). Consistent with the pharmacological (Figure 1) and anatomical (Figure 2) experiments, KD of mAChR-A in iLNs increased ePN odor responses (Figure 3B). Despite co-localization of cholinergic neurons with the MiMIC-mAChR-A-GAL4 driver line, KD of mAChR-A in ORNs or ePNs and imaging odor responses in ORNs or ePNs, respectively, had no significant effect on their odor responses (Figures 3C–3F). These results confirm the pharmacological, anatomical, and physiological evidence that mAChR-A acts on GABAergic iLNs and that the increase in ePN odor responses observed both by genetic and pharmacological blocking of mAChR-A activity is due to the reduced inhibition of iLNs. However, these results do not suggest that iLNs act directly on ePNs, but rather it is most likely that iLNs inhibit ORNs, as was previously demonstrated (Olsen and Wilson, 2008, Root et al., 2008). These results also suggest that, contrary to the inhibitory role we previously described for mAChR-A in Kenyon cells (Bielopolski et al., 2019), mAChR-A contributes to iLN activation.
Figure 3.

KD of mAChR-A in iLNs Increases ePN Odor Response
(A, C, and E) Experimental scheme of the experiments in which mAChR-A was KD in iLNs and PNs were imaged (B), mAChR-A was KD in ORNs and ORNs were imaged (D), and mAChR-A was KD in PNs and PNs were imaged (F). Light blue (either filled circles or light blue outline) indicates KD of mAChR-A; green indicates expression of GCaMP. Radial lines indicate the imaging region. In all cases, a single plane of the AL was imaged and the entire plane was analyzed.
(B, D, and F) Top, averaged traces ± SEM (shading) of odor responses (as indicated, odor pulse is labeled with a black bar) obtained from a single plane of the entire AL. Black indicates GCaMP3 (B) or GCaMP6f (D and F) labeled neurons driven by GH146-QF (B), Orco-GAL4 (D), or GH146-GAL4 (F) for control, with light blue for flies where mAChR-A was KD by the UAS-mAChR-A RNAi transgene in GH298-GAL4 (B), Orco-GAL4 (D), or GH146-GAL4 (F). Bottom, peak ΔF/F during odor response for the traces presented in the top panel. While there was a significant increase in the ePN odor responses to all of the odors examined when mAChR-A was KD in iLNs (B), there was no significant change in odor responses to any of the odors examined when mAChR-A was KD in ORNs (D) or in ePNs (F). Gray dots indicate single flies (n = 10 B, 7 D, and 7 F flies; ∗p < 0.05, ∗∗p < 0.01; for statistical analysis, see Table S1).
Knock Down of mAChR-A in iLNs Affects Odor Valence
iLNs are involved in many processes in olfactory perception, such as gain control (Olsen and Wilson, 2008, Root et al., 2008), habituation (Das et al., 2011, Sudhakaran et al., 2012), discrimination (Olsen et al., 2010), and valence (Mohamed et al., 2019). To examine whether the effects observed in ePNs following KD of mAChR-A in iLNs also affect the behavior of flies, we looked at their ability to detect and track odors using an open field arena with an odor source at the center (Figure 4A). We selected ACV, which showed a pronounced change in the glomerular activity map (Figure 1E), and linalool, which showed relatively little change in the glomerular activity map. Before all of the experiments, flies were starved for 48 h. In the case of ACV, parental controls found the odor source after approximately 2 min and spent almost 40% of the time in the proximity of the odor source (Figures 4A–4C). However, the KD of mAChR-A in iLNs resulted in a much longer time to approach the odor source, with most flies never entering the odor region (Figures 4A–4C). In contrast to ACV, the KD of mAChR-A had no significant effect on the behavior of the flies toward linalool (Figure S3A), suggesting that mAChR-A KD changed ACV valence. Alternatively, it is possible that flies lack the ability to identify the odor source and have a naive preference for the outer edge of the arena (Simon and Dickinson, 2010). However, the change in the AL activity map (Figure 1E) suggests that the ACV may actually have become aversive (Badel et al., 2016, Knaden et al., 2012, Seki et al., 2017). To examine this option, we used behavioral chambers that are more suited to identifying changes in odor valence since they restrict the movement of the flies to 1 dimension and have a clear decision zone between odor and mineral oil (Parnas et al., 2013) (Figure 4D). The KD of mAChR-A in iLNs caused an aversive response to ACV, in contrast to parental controls (Figure 4E). Consistent with the lack of change in the glomerular activity map, there was no effect on linalool valence (Figure S3B). To further verify that we had correctly identified the neurons in which mAChR-A exerts its effect and, in particular, the lack of effect on AL cholinergic neurons, we also examined the effects of mAChR-A KD in ORNs, ePNs, and GABAergic iLNs covered by the LN2-GAL4 driver line, in which we did not see any physiological effect of mAChR-A (Figure 2C). As expected, mAChR-A KD in these neurons had no effect on ACV valence (Figure 4E). In the open field arena, flies expressing mAChR-A RNAi in iLNs showed reduced motility (Figure 4C). To examine whether this is due to odor aversion or to a motor defect (Malloy et al., 2019), we tested the walking velocity of the flies in the absence of odor in the 1D chambers and found no effect (Figure S3C), consistent with the restricted expression to the AL and limited expression in VNC (Figure S2F). It is worth noting that this change in valence could be due to the recruitment of DM5 ePNs, as was previously shown (Semmelhack and Wang, 2009). Although this type of ePN was not a part of our sampled subset of ePNs, it could have also contributed to this result. These results demonstrate that mAChR-A plays an important role in the activity of a subset of iLNs, which affect AL output, and has a strong behavioral impact on odor responses.
Figure 4.

KD of mAChR-A in iLNs Affects the Perception of ACV
(A and D) Example of single fly trajectories in the open field arena (A) or in the behavioral chambers (D) in response to ACV for the parental controls UAS-mAChR-A RNAi transgene (left, black) and GH298-GAL4 driver line (center, gray) and the experimental group, in which GH298-GAL4 was used to drive UAS-mAChR-A RNAi (right, light blue).
(B) Heatmaps representing the number of occurrences in each location using an overlay of the trajectories of all flies as in (A).
(C) Analysis of the data presented in (A) and (B) of the total distance the flies walked (left), the time until first arrival to the odor source (center), and the percentage of time spent in the vicinity of the odor source (right) for the parental controls UAS-mAChR-A RNAi transgene (black) and GH298-GAL4 driver line (gray) and for the experimental group, in which GH298-GAL4 was used to drive UAS-mAChR-A RNAi (light blue). Gray dots indicate single flies (n = 7 flies; ∗p < 0.05; for statistical analysis, see Table S1).
(E) Valence values for ACV (positive values indicate attraction and vice versa) obtained from fly trajectories as in (D) for the parental controls UAS-mAChR-A RNAi transgene (black) and GH298-GAL4 driver line (gray); for the experimental group, in which GH298-GAL4 was used to drive UAS-mAChR-A RNAi (light blue); and for the mAChR-A KD controls, in which Orco-GAL4 (purple), GH146-GAL4 (green), or LN2-GAL4 (orange) were used to drive UAS-mAChR-A RNAi. Gray dots indicate single flies (n = 27–57 flies; ∗∗∗p < 0.001; for statistical analysis, see Table S1).
Genotypes used: +/+;UAS-mAChR-A RNAi/+, +/+;GH298-GAL4/+, +/+;GH298-GAL4/UAS-mAChR-A RNAi, Orco-GAL4/+;UAS-mAChR-A RNAi/+, GH146-GAL4/+;UAS-mAChR-A RNAi/+, and LN2-GAL4/+;+/+;UAS-mAChR-A RNAi/+.
iLN Odor Response Profile Is Heterogeneous and Odor Dependent
Previous electrophysiological studies have demonstrated that iLNs are heterogeneous with respect to their odor responses, with some iLNs responding to odor onsets, offsets, or both (Nagel and Wilson, 2016). In addition, different odors have been shown to elicit variable responses in iLNs (Chou et al., 2010, Wilson and Laurent, 2005). As mAChR-A activity may affect only certain aspects of iLN odor responses, we examined whether functional imaging can identify the temporal response patterns described previously for iLNs. To this end, we imaged iLN cell bodies. Each fly was presented with 3–4 odors and a single imaging plane was selected with ∼15 cell bodies. In total, ∼60 iLNs were tested for each odor, with 789 neurons tested across all of the odors. Figure S4A demonstrates the results obtained from a single fly in which the odor responses of 14 neurons to 4 different odors were imaged. While some neurons displayed similar response dynamics to all of the odors during the odor pulse (e.g., neurons #2 and #8, Figure S4A), most of the neurons showed odor-specific response dynamics during the odor pulse and all of the neurons demonstrated odor-specific response dynamics when the post-odor response was taken into account (e.g., neurons #5, #7, and #12, Figure S4A). Such recordings revealed all 10 odor response categories previously described for iLNs (Chou et al., 2010, Nagel and Wilson, 2016, Wilson and Laurent, 2005). Eight of the categories define different dynamics of iLN odor responses, with 2 categories defining non-responding cells and oscillatory cells (Figure S4B). For each odor, we quantified the percentage of neurons in each category (Figure S4C; Table S3). In general, although each iLN responded in a different manner to different odors, over the entire iLN population, the proportion of cells in each category was conserved between odors, with an average pairwise correlation of 0.6 (Figure S4D). Using this database, we selected for further experiments 15 odors that covered all of the categories and had the least unresponsive iLNs (Figure S4C).
Pharmacologically Blocking mAChR-A Reduces iLN Odor Response
To determine whether blocking mAChR-A affects odor responses within a specific iLN response type, we first examined the effect of atropine on the iLN response profile. Although in some cases, atropine application changed the type of neuronal response (Figure S5A), there was no significant overall change in the excitatory odor profile of responses (Figure 5A). We did observe a slight decrease in the inhibitory iLN responses and a slight increase in the oscillatory iLNs (Figure 5A). Recalling that atropine indirectly increased ePN activity (Figures 1 and 3) suggests that blocking mAChR-A reduced inhibitory input to the presynaptic ORNs or to ePNs. Thus, we expected that mAChR-A contributes to the activation of iLNs. Therefore, we examined the effect of atropine application on neurons that display excitatory responses to odors, namely neurons in one of the “ON” or “OFF” categories. The results from all of the neurons in these categories were analyzed to generate a repeated-measures 2-way ANOVA model using odors and the presence or absence of atropine as factors. When factored across all of the odors, blocking mAChR-A activity decreased the peak amplitudes of both ON and OFF neurons (Figure 5B). The decreases seen were not uniform, with some odors being more susceptible to the reduction in mAChR-A activity (Figure S5B).
Figure 5.

mAChR-A Increases ON and OFF Responses of iLNs
(A) Distribution of iLN response categories before (black) and after (dark blue) atropine (100 μM) application. Each dot represents the percentage of neurons in the specified category for a given odor. Overall, there were no significant changes in the percentage of neurons in each category, except for the inhibition and oscillatory categories (n = 15 flies; ∗p < 0.05, ∗∗p < 0.01; for statistical analysis, see Table S1).
(B) Estimated marginal means of the peak ΔF/F of ON and OFF odor responses before and after atropine application obtained from iLN somata labeled for GCaMP6f labeled neurons driven by GH298-GAL4. A repeated-measures 2-way ANOVA model was used to assess the effect of atropine application across odors. A significant main effect for atropine was observed (n = 991–1,049 ON or OFF peaks obtained from 34 flies; for statistical analysis, see Table S1).
(C and D) Peak ΔF/F during ON (C) and OFF (D) odor responses (as indicated) obtained from iLN somata labeled for GCaMP6f labeled neurons driven by GH298-GAL4 for control (black) and for flies, in which mAChR-A was KD using the GH298-GAL4 > UAS-mAChR-A RNAi transgene (light blue). Gray dots indicate single cells (n = 4–64 ON or OFF peaks obtained from 10 flies; ∗p < 0.05, ∗∗p < 0.01, ∗∗∗p < 0.001; for statistical analysis, see Table S1).
KD of mAChR-A in iLNs Reduces iLN Odor Response
To further verify that mAChR-A increases iLN odor responses, we KD mAChR-A in iLNs. As with acute atropine application, we did not observe a change in the fractions of the excitatory odor responses (Figure S5C), but we did see a decrease in the fraction of inhibitory responses in iLNs and an increase in the percentage of non-responding iLNs (rather than an increase in oscillatory iLNs; Figure S5C). Analysis of the ON and OFF responses revealed a reduction of iLN ON odor responses, but little or no effect on OFF odor responses (except in the case of hexyl acetate; Figures 5C and 5D). Thus, the cumulative results of both acute pharmacological blocking and chronically genetic KD of mAChR-A demonstrate that mAChR-A activity contributes to iLN odor responses, with perhaps a stronger effect on 1 response type of iLNs.
mAChR-A Stabilizes the Synapse between ORNs and iLNs and Increases the Excitability of iLNs
The results described so far have considered the effects of mAChR-A on different components of the iLN odor response. However, muscarinic receptors also participate in processes of synaptic plasticity, such as long-term potentiation and long-term depression (Buchanan et al., 2010, Caruana et al., 2011, Dennis et al., 2016, Dickinson et al., 2009, Jo et al., 2010, Ovsepian et al., 2004). STD has previously been demonstrated at the synapse between ORNs and ePNs (Kazama and Wilson, 2008, Martelli and Fiala, 2019) and was especially pronounced in the ORN to the GABAergic iLN synapse (Nagel and Wilson, 2016, Nagel et al., 2015). It was therefore interesting to examine whether mAChR-A plays a role in modulating this synapse. To this end, we blocked mAChR-A by incubating the brain with atropine and examined the responses elicited in iLNs expressing GCaMP6f following a 20-s stimulation of the antennal nerve at different frequencies. Stimulation at 1 Hz elicited a decrease in the iLN responses, which was only slightly affected by atropine (Figure S6A). However, stimulation at 2 Hz produced a larger depression that was increased even further following atropine application (Figure 6A). As previously described (Nagel et al., 2015), 2 exponents with different coefficients (Table S1) were required to best fit the kinetics of the STD. Atropine affected and reduced only the slower component (Figure 6A). Due to the differences between 1- and 2-Hz stimulation, we also examined atropine effects at 3-Hz stimulation, which produced similar results to those obtained for 2 Hz (Figure S6B). Similarly to acute atropine application, mAChR-A KD in iLNs caused a strong depression when we stimulated ORNs at 2 Hz (Figure S6C).
Figure 6.

mAChR-A Activity Reduces the STD of the ORN to iLN Synapse and Increases iLN Excitability
(A–D) Left, example of the fluorescence signal measured in iLNs (A and B), or ePNs (C and D) obtained from a single plane of the entire AL for GCaMP6f labeled neurons driven by GH298-GAL4 (A and B) or GH146-GAL4 (C and D) in response to a 20-s tetanic stimulation of the antennal nerve at 2 Hz in controls (black), following the application of atropine (100 μM, blue) or following the application of muscarine (10 μM, green). Right, analysis (mean peak response ± SEM) of the traces, as in the left panels. Application of the mAChR-A antagonist, atropine, increases the STD of the ORN to iLN synapse (A), but decreases the STD of the ORNs to PNs synapse (C). In contrast, the mAChR-A agonist, muscarine, decreases the STD of the ORN to iLN synapse (B), but increases the STD of the ORN to ePN synapse (D). A 2-exponent fit (solid line) was fitted to the peak ΔF/F signals in response to the electrical stimuli (n = 10 A, 10 B, 9 C, 8 D, control, 9 D, muscarine flies; for statistical analysis, see Table S1).
(E) Averaged peak ΔF/F ± SEM following a single electric stimulation of the antennal nerve at the designated time obtained from a single plane of the entire AL for GCaMP6f labeled neurons driven by GH298-GAL4 for controls (black) and following the application of muscarine (10 μM, green). Responses are normalized to the first peak. Muscarine enhances the responses in iLNs (n = 9; ∗p < 0.05; for statistical analysis, see Table S1).
(F) Left, whole-cell current clamp-patch recordings from iLN somata covered by GH298-GAL4 for controls (black) and after the application of muscarine (10 μM, green) following current injections at the designated values. Right, analysis of the traces (mean firing rate ± SEM), as in the left panels. The application of muscarine increases the excitability of iLNs (n = 13; for statistical analysis, see Table S1).
To confirm that mAChR-A activity protects the ORN to iLN synapse from depression, we examined the effects of muscarine on the STD. At stimulations of 2 and 3 Hz, muscarine caused an increase in the stability of the ORN to iLN synapse (Figures 6B and S6E). Although a depression of the ORN to iLN synapse was observed at 1 Hz, the addition of muscarine had only a slight effect (Figure S6D). A possible explanation for the lack of effect for 1-Hz stimulation is that mAChR-A requires stronger ORNs input to be recruited. To test this hypothesis, we electrically stimulated the antennal nerve at increasing intensities and compared the responses of iLNs in control (having both nicotinic and muscarinic receptors) or mAChR-A KD flies (having mostly nicotinic receptors). Whereas for high-stimulation intensities mAChR-A KD reduced iLN response, mAChR-A KD had no effect at a low-stimulation intensity (Figure S6F). Our results indicate that mAChR-A activity stabilizes the synapse between ORNs and iLNs to some extent, counteracting the effects of the STD on iLN activity.
To examine the question of whether the changes in iLN activity caused by atropine and muscarine (Figures 6A and 6B) are sufficient to affect AL output, we assessed the effects of atropine and muscarine on the ORN to ePN synapse. As expected, atropine, which reduced iLN activity (Figure 6A), increased ePN activity (Figure 6C). Similarly, increased iLN activity following muscarine application (Figure 6B) decreased ePN activity (Figure 6D). These results also suggest that the effect of mAChR-A on the ORN to iLN synapse is due to monosynaptic effects in iLNs and not to polysynaptic circuit effects, which affect the presynaptic terminal of the ORNs, where STD is believed to occur (Kazama and Wilson, 2008, Martelli and Fiala, 2019, Nagel and Wilson, 2016, Nagel et al., 2015, Olsen and Wilson, 2008). Thus, the results indicate that the influence of mAChR-A on the STD of the ORN to iLN synapses affects AL output as manifested by ePN activity.
A possible mechanism by which mAChR-A can protect iLNs from STD is to increase their excitability. To test this, we imaged the responses in iLNs to a single, short antennal nerve stimulation (which should not involve any polysynaptic effects) before and during muscarine application. Muscarine increased the excitability of iLNs to a single stimulation (Figure 6E), but not when mAChR-A was KD in iLNs (Figure S6G). To further validate this hypothesis, we used in vivo whole-cell patch-clamp recordings in iLNs, which allowed us to directly examine iLN excitability without any circuit’s effects (Figure 6F). Following muscarine application, a clear increase in baseline activity and in response to current injection is observed (Figure 6F). The maximal firing rate was not affected (Figure 6F). Using the same protocol with saline application did not change iLN firing rates (Figure S6H). Taken together, mAChR-A activation increases iLN excitability, and the effect of mAChR-A is mainly monosynaptic in iLNs.
iLNs Are More Susceptible to Depression Due to Asynchronous ORN Input
Why does mAChR-A affect mainly iLNs? iLNs have been shown to be more intrinsically depressible than ePNs (Nagel et al., 2015); however, the different nature of the synaptic input to these 2 populations of neurons may also contribute to the difference in STD. Each ePN is usually uniglomerular and receives synaptic input from all or most ORNs belonging to the same class. iLNs, in contrast, are multiglomerular and sample fewer ORNs of the same class (Figure 7A) (Berck et al., 2016, Chou et al., 2010, Liou et al., 2018, Okada et al., 2009, Seki et al., 2010, Tanaka et al., 2012). Thus, ePNs receive a relatively homogeneous input compared to iLNs (Egea-Weiss et al., 2018). To address whether these differences affect iLN STD, we used a previously described computational model (Nagel et al., 2015) of the synapse between ORNs and PNs or iLNs, but with the same depression rule for both neuron types (Figure 7A). iLNs that receive input from ORNs with asynchronous firing rates (Figure 7A, right) are more susceptible to STD than are ePNs (Figure 7B). In our model, asynchronous firing rates usually resulted in lower average firing rates and, to some extent, in a higher temporal asynchrony of post-synaptic action potential timing. Forcing the average firing rate of the ORN input to iLNs to be similar to that of the ORN input to ePNs results in no difference in STD (Figure 7C). Using ORN input of the same class to the post-synaptic neuron (i.e., with identical firing rate) but with increased asynchrony of ORN response onset dramatically increases STD (Figure 7D). These results suggest that both the firing rate of ORNs and the asynchrony of ORN response onset affect iLN STD, with asynchrony of response onset probably having a greater role. As iLNs receive a less synchronized ORN input (Egea-Weiss et al., 2018), this contributes to their higher susceptibility to STD. Thus, according to this model, mAChR-A is required in iLNs to counteract their increased susceptibility to STD due to the nature of their synaptic input.
Figure 7.

iLNs Are More Susceptible to Depression Due to Asynchronous Input
(A) Schematic representation of the model. Hzi corresponds to ORN firing rates, Φ(t) corresponds to the maximal jitter in ORN response onset, with jitter ranging from 0 ms to Φ(t). The ePN model received a uniform ORN input (black), while iLN received a varied ORN input (colored). ORN firing rates were first convolved with a previously described depression (A(t)) model (Nagel et al., 2015), summed across 20 simulated ORNs, g(t), and then fed into a simple leaky integrate and fire model neuron (Vm(t)).
(B) Top, mean peristimulus time histogram (PSTH) of ePNs and iLNs. ePN Hz1 was 140 Hz and Φ(t) was 10 ms. iLN Hzi ranged from 45 to 140 Hz and Φ(t) was 10 ms. Bottom, example of raster plots obtained for ePNs and iLNs.
(C) Mean PSTH of ePNs and iLNs. For both ePNs and iLNs, Φ(t) was 10 ms. ePN Hz1 was 140 and iLN Hzi ranged from 85 to 180, with an average of 132.5.
(D) Mean PSTH for 2 Φ(t). For both cases, Hzi was 140. In one case, Φ(t) was 10 ms and in the second case, Φ(t) was 30 ms.
Discussion
In the mammalian olfactory bulb, ORNs release glutamate. Group I mGluRs, which are Gq-coupled receptors, were shown to be differentially expressed by different populations of olfactory bulb inhibitory local granule cells (Heinbockel et al., 2007b). In addition, group I mGluRs were shown to increase both granule cell excitability and granule cell-mediated GABAergic inhibition of the main output neurons of the olfactory bulb, the mitral cells (Heinbockel et al., 2004, Heinbockel et al., 2007a). We note striking similarities in the Drosophila AL, where ORNs release ACh. mAChRs-A, which are Gq-coupled receptors, are also differentially expressed in inhibitory LNs. Here, mAChRs-A also increase both the excitability of iLNs and the inhibitory effect on the ePNs.
These observations raise the issue that if the main role of mAChRs-A is to merely excite the inhibitory neurons, then what is the added advantage of driving excitation also by mAChRs-A rather than by only the nicotinic receptor? Our results demonstrate an additional role for mAChRs-A in the stabilization of the synapse between ORNs and iLNs. While a transiency in iLN activity is required for the AL circuitry to function (Nagel and Wilson, 2011, Nagel and Wilson, 2016), it is still important for iLNs to remain active across varied conditions, even if to a lesser degree. Reducing ORN to iLN synapse STD allows iLNs to retain their effects under a broad range of ORN firing rates. The strong similarity between the roles of mAChRs-A and olfactory bulb group I mGluRs raises the possibility that the same principle is also true in the case of the mammalian olfactory bulb.
We show that mAChR-A increases iLN excitability, which may serve to generate a more sustained response in iLNs. However, it was previously demonstrated that intrinsic properties of iLNs support a more transient odor response (Nagel et al., 2015). How can these 2 seemingly opposing results be reconciled? An appealing hypothesis is that these 2 mechanisms act on a different timescale. The intrinsic properties of iLNs were shown to affect odor responses at the scale of hundreds of milliseconds (Nagel and Wilson, 2016), whereas the effects of mAChR-A on iLNs occur on the timescale of seconds (Figure 6). In this context, a slow presynaptic depression was described in ORNs that also occurs over tens of seconds (Martelli and Fiala, 2019). Thus, it is possible that mAChR-A is required to compensate for this slower component of depression. While it is reasonable to assume that ACh released from ORNs recruits the muscarinic receptors and affects iLN excitability, it is important to note that eLNs and ePNs also release ACh onto the AL (Olsen et al., 2007, Rybak et al., 2016, Seki et al., 2010, Shang et al., 2007, Tobin et al., 2017), which can serve to activate mAChR-A.
What are the molecular and cellular mechanisms underlying the effects of mAChR-A on iLNs? This issue was not addressed within the framework of this manuscript. However, studies of the effects of mammalian M1 receptors on long-term potentiation may shed light on the mechanism. For example, the activation of M1 receptors was shown to cause the insertion of α-amino-3-hydroxy-5-methyl-4-isoxazolepropionic acid receptors (AMPARs) and N-methyl-d-aspartate receptors (NMDARs) in the spines of rat hippocampal CA1 pyramidal neurons (Fernández de Sevilla and Buño, 2010, Fernandez de Sevilla et al., 2008). In addition, M1 receptors were reported to enhance NMDAR activation by inhibiting Ca2+-activated K+ channels (Buchanan et al., 2010) and to increase dendritic excitability by enhancing R-type Ca2+channel activity (Williams and Fletcher, 2019). In this context, we show that mAChR-A activation increases iLN excitability, which may serve to counter to some extent the STD that the ORN to iLN synapse undergoes. From the above comparison, recruitment of nicotinic receptors or changes in potassium channel activity seem reasonable candidates for downstream mechanisms. However, other channels and signaling pathways may also be affected.
In conclusion, the results of this study highlight striking similarities between the roles and expression patterns of the metabotropic receptors for the main excitatory neurotransmitter of the mammalian system and those in Drosophila olfactory systems. In addition, we have discovered a role for these metabotropic receptors in the synaptic stabilization of the ORN to iLN synapse and in modulating iLN excitability.
STAR★Methods
Key Resources Table
| REAGENT or RESOURCE | SOURCE | IDENTIFIER |
|---|---|---|
| Antibodies | ||
| Mouse Anti-Drosophila choline acetyltransferase monoclonal Antibody | DSHB | (DSHB Cat# chat4b1; RRID:AB_528122 |
| Rabbit polyclonal anti-dvGlut | Daniels et al., 2008 | N/A |
| Anti-GABA antibody produced in rabbit | Sigma-Aldrich | Sigma-Aldrich Cat# A2052; RRID:AB_477652 |
| Goat Anti-Rabbit IgG H&L, Alexa Fluor® 568 antibody | Abcam | Abcam Cat# ab175471; RRID:AB_2576207 |
| Goat Anti-Mouse IgG H&L (Alexa Fluor 647) Antibody | Abcam | Abcam Cat# ab150115; RRID:AB_2687948 |
| Abberior® STAR RED anti-rabbit antibody | Prof. Robert Kittel | N/A |
| Chemicals, Peptides, and Recombinant Proteins | ||
| Atropine | Sigma-Aldrich | CAS: 51-55-8 |
| Muscarine chloride | Sigma-Aldrich | CAS: 2303-35-7 |
| Tetrodotoxin | Alomone Labs | CAS: 18660-81-6 |
| Experimental Models: Organisms/Strains | ||
| y[1] w[1118]; P{w[+mW.hs] = GawB}GH146 | BDSC | BDSC Cat# 30026, RRID:BDSC_30026 |
| w[∗]; P{w[+mW.hs] = GawB}CG2162[NP3056] | DGGR | DGGR Cat# 113080; RRID:DGGR_113080 |
| LN674-GAL4 | Liou et al., 2018 | N/A |
| HB4-93-GAL4 | Chou et al., 2010 | N/A |
| w[∗] P{w[+mW.hs] = GawB}Sxl[NP2426] / FM7c (LN2-GAL4) | DGGR | DGGR Cat# 104198; RRID:DGGR_104198 |
| MZ699-GAL4 | Parnas et al., 2013 | N/A |
| krasavietz-GAL4 | Shang et al., 2007 | N/A |
| w[∗]; P{w[+mC] = Orco-GAL4.W}11.17; TM2/TM6B, Tb[1] | BDSC | BDSC Cat# 26818; RRID:BDSC_26818 |
| w[∗]; P{w[+mW.hs] = GawB}GH298 | BDSC | BDSC Cat# 37294; RRID:BDSC_37294 |
| mAChR-A-MiMIC-GAL4 | Bielopolski et al., 2019 | N/A |
| w[1118]; PBac{Disc\RFP[DsRed2.3xP3] = GH146-QF.P}53 | BDSC | BDSC Cat# 30015; RRID:BDSC_30015 |
| w[1118]; P{y[+t7.7] w[+mC] = 20XUAS-IVS-GCaMP6f}attP40 | BDSC | BDSC Cat# 42747; RRID:BDSC_42747 |
| w[1118]; PBac{y[+mDint2] w[+mC] = 20XUAS-IVS-GCaMP6f}VK00005 | BDSC | BDSC Cat# 52869; RRID:BDSC_52869 |
| w[1118]; P{w[+mC] = QUAS-GCaMP3.L}5 | BDSC | BDSC Cat# 65684; RRID:BDSC_65684 |
| y[1] v[1]; P{y[+t7.7] v[+t1.8] = TRiP.JF02725}attP2 | BDSC | BDSC Cat# 27571; RRID:BDSC_27571 |
| w[∗]; P{y[+t7.7] w[+mC] = 10XUAS-IVS-mCD8::GFP}attP2 | BDSC | BDSC Cat# 32185; RRID:BDSC_32185 |
| y[1] w[∗]; Mi{y[+mDint2] = MIC}mAChR-A[MI13848] | BDSC | BDSC Cat# 59216; RRID:BDSC_59216 |
| Software and Algorithms | ||
| MATLAB | MathWorks, Natick, MA | https://www.mathworks.com/products/matlab.html |
| Prism 6 | GraphPad | https://www.graphpad.com/ |
| SPSS | IBM Corp. | SPSS; RRID:SCR_002865 |
| Fiji | Max Planck Institute of Molecular Cell Biology and Genetics; Dresden; Germany | Fiji; RRID:SCR_002285 |
| pClamp | Molecular Devices | pClamp; RRID:SCR_011323 |
Lead Contact and Materials Availability
Further information and requests for resources and reagents should be directed to and will be fulfilled by the Lead Contact, Moshe Parnas (mparnas@tauex.tau.ac.il). Flies generated for this paper will be available upon request.
Experimental Model and Subject Details
Fly Strains
Fly strains were raised on cornmeal agar under a 12 h light/12 h dark cycle at 25°C. Both male and female flies were used in all experiments. The following fly strains were used: GH146-GAL4 (BDSC:BDSC_30026, Stocker et al., 1997), NP3056-GAL4 (Hayashi et al., 2002), LN674-GAL4 (Liou et al., 2018), LN2-GAL4 (DGRC:104198, Hayashi et al., 2002), MZ699-GAL4 (Lai et al., 2008, Okada et al., 2009), krasavietz-GAL4 (Shang et al., 2007), Orco-GAL4 (BDSC:BDSC_26818, Wang et al., 2003), GH298-GAL4 (BDSC:BDSC_37294, Stocker et al., 1997), HB4-93-GAL4 (Chou et al., 2010), mAChR-A-MiMIC-GAL4 (Bielopolski et al., 2019), GH146-QF (BDSC:BDSC_30015, Potter et al., 2010), UAS-GCaMP6f (BDSC:BDSC_42747 and BDSC:BDSC_52869, Chen et al., 2013), QUAS-GCaMP3 (BDSC:BDSC_65684), UAS-mAChR-A RNAi (TRiP.JF02725, BDSC:BDSC_27571), UAS-mCD8-GFP (BDSC:BDSC_32185), mAChR-A-MiMIC-GFP (BDSC:BDSC_59216, Venken et al., 2011). The vector used in order to generate the mAChR-A-MiMIC-GAL4 driver line was DGRC:1325 and the injections were performed by BestGene Inc. Verification PCR for MiMIC construct and strains as well as orientation PCR for MiMIC transformants were performed by BestGene and are available on GitHub (https://github.com/Eyal-ro).
Method Details
Odors used
All odors except ACV were purchased from Sigma-Aldrich (Rehovot, Israel) and were at the purest level available: Isoamyl acetate (IAA), 3-octanol (3-OCT), 4-methylcyclohexanol (MCH), linalool, γ-decalactone, methyl salicylate, hexyl acetate, ethyl lactate, ethyl acetate, ethyl formate, isobutyl acetate, methyl hexanoate, ethyl benzoate, methyl acetate, ethyl propionate, β-citronellol, limonene, geraniol, geranyl acetate, 2-heptanone, 2-pentanone, 2-butanone, pentyl alcohol, 4-ethyl guaiacol, α-terpineol, 1-octanol, benzyl alcohol, 1-hexanol, acetic acid. ACV was bought at a local supermarket (RAUCH Fruchtsäfte GmbH & Co OG apple cider vinegar)
Functional Imaging
Flies used for functional imaging were reared as described above. Sample sizes were chosen to be consistent with previous works in the field. Imaging was done by two-photon laser-scanning microscopy (DF-Scope installed on an Olympus BX51WI microscope). Flies were anesthetized on ice then a single fly was moved to a custom built chamber and fixed to aluminum foil using wax. Cuticle and trachea in the required area were removed, and the exposed brain was superfused with carbonated solution (95% O2, 5% CO2) containing 103 mM NaCl, 3 mM KCl, 5 mM trehalose, 10 mM glucose, 26 mM NaHCO3, 1 mM NaH2PO4, 1.5 mM CaCl2, 4 mM MgCl2, 5 mM N-Tris (TES), pH 7.3. Odors at 10−1 dilution were delivered by switching mass-flow controlled carrier at 0.4 l/min and stimulus streams at 0.4 l/min (Sensirion) via software controlled solenoid valves (The Lee Company). This resulted in a final concentration of 5X10⁻² of odor delivered to the fly. Air-streamed odor was delivered through a 1/16 inch ultra-chemical-resistant Versilon PVC tubing (Saint-Gobain, NJ, USA) that was placed 5 mm from the fly’s antenna.
Fluorescence was excited by a Ti-Sapphire laser (Mai Tai HP DS, 100 fs pulses) centered at 910 nm, attenuated by a Pockels cell (Conoptics) and coupled to a galvo-resonant scanner. Excitation light was focused by a 20X, 1.0 NA objective (Olympus XLUMPLFLN20XW), and emitted photons were detected by GaAsP photomultiplier tubes (Hamamatsu Photonics, H10770PA-40SEL), whose currents were amplified (Hamamatsu HC-130-INV) and transferred to the imaging computer (MScan 2.3.01). All imaging experiments were acquired at 30 Hz.
When necessary, movies were motion-corrected using the TurboReg (Thévenaz et al., 1998) ImageJ plugin (Schindelin et al., 2012). ΔF/F was calculated as was previously described (Lin et al., 2014). When a pharmacological effect was tested in the same fly, all ROIs ΔF/F were calculated with the baseline fluorescence of the ROI prior pharmacology. A fly that displayed strong movements in the Z axis during the imaging session was discarded. With that exception, no flies were excluded from the analysis. When single glomeruli were imaged, a 3D atlas of the AL (Grabe et al., 2015) was used to manually identify the glomeruli.
Pharmacological application
The following drugs were used: atropine (Sigma-Aldrich #A0132), muscarine (Sigma-Aldrich #M6532) and TTX (Alomone Labs #T-550). In all cases stock solutions were prepared and diluted in external solution to the final concentration before experiments. When an immediate response to a drug was examined, a glass pipette filled was placed in close proximity to the AL and was emptied using a pico injector (Harvard Apparatus, PLI-100). When long incubation of 30 minutes was used, the entire bath chamber was filled with external solution containing the drug.
Antennal nerve stimulation
Antennal nerve stimulation was as described previously (Kazama and Wilson, 2008). Briefly, a glass pipette was pulled and broken to create a narrow opening that allowed the antennal nerve to be sucked in. A constant current stimulator (Digitimer, DS3 Isolated Current Stimulator) was controlled by custom LabView script. Shock intensity was selected on the basis of the minimal stimulus needed to generate a visible GCaMP6f signal. All stimuli in the tetanic stimulus protocols were in the range of 150-230mA and each lasted 50 μs. The same glass pipette was used for each experiment in order to minimize variability in shock delivery.
Structural Imaging
Brain dissections, fixation, and immunostaining were performed as described (Wu and Luo, 2006). To visualize native GFP fluorescence, dissected brains were fixed in 4% (w/v) paraformaldehyde in PBS (1.86 mM NaH2PO4, 8.41 mM Na2HPO4, 175 mM NaCl) and fixed for 20 minutes at room temperature. Samples were washed for 3 × 20 minutes in PBS containing 0.3% (v/v) Triton X-100 (PBT). Primary antisera were mouse monoclonal anti-ChAT (1:50, 4B1, DSHB), rabbit polyclonal anti-dvGlut (1:10.000, Daniels et al., 2008), and rabbit polyclonal anti-GABA (1:100, A2052, Sigma-Aldrich). Secondary antisera were Alexa568 coupled to goat anti-rabbit or Alexa647 coupled to goat anti-mouse (1:500, all Abcam), and Abberior STAR RED coupled to goat anti-rabbit (1:500, kindly provided by Prof. Kittel). Primary antisera were applied for 1-2 days and secondary antisera for 1-2 days in PBT at 4°C, followed by embedding in Vectashield. Images were collected on a Leica TCS SP5, SP8, Zeiss LSM 800, or Nikon A1 confocal microscope and processed in ImageJ. Colocalization analysis was done with the ImageJ Colocalization Threshold plugin (https://imagej.net/Colocalization_Threshold). Cell count was done manually using the ImageJ Cell Counter plugin.
Behavioral Analysis
For behavioral assays, 5-10 post-eclosion flies were used. Sample sizes were chosen to be consistent with previous works in the field. When starved flies were used they were transferred to a fresh bottle containing water-soaked KimWipes 48 h prior to experiment. For experiments with ACV, flies were fed with food containing ACV for 2 days prior to the experiment in order to increase the attraction to ACV.
Fly genotypes used for the behavioral assays are as follow:
+/+;UAS-mAChR-A RNAi/+, +/+;GH298-GAL4/+, +/+; GH298-GAL4/UAS-mAChR-A RNAi, Orco-GAL4/+;UAS-mAChR-A RNAi/+, GH146-GAL4/+;UAS-mAChR-A RNAi/+ and LN2-GAL4/+;+/+;UAS-mAChR-A RNAi/+
Open field arena
Experiments were performed in a custom-built small plastic dish (90 mm diameter, 6 mm height) with a small hole at the center, placed in a light proof box with illumination from an 820 nm IR LED panel. Images were captured using a Mako G-125 B camera (Allied Vision Technologies Co.) at 30 fps. Odors at a concentration of 10−1 were applied to filter paper that covered the central hole and flies were monitored for 30 minutes. The fly position was extracted using Ctrax (Branson et al., 2009) and analysis was performed offline using custom MATLAB scripts. A circular odor interest zone was defined as having a radius of 10 mm around the odor source and was used to calculate the first time the fly entered this zone and the percent of time it spent in the area. If a fly never entered the odor zone, the time to odor was set to the maximal time in the arena (30 minutes).
Behavioral chambers
Experiments were performed in a custom-built, fully automated apparatus (Claridge-Chang et al., 2009, Parnas et al., 2013). Single flies were placed in clear polycarbonate chambers (length 50 mm, width 5 mm, height 1.3 mm). Air flow was controlled with mass flow controllers (CMOSens PerformanceLine, Sensirion). A carrier flow (2.7 l/min) was combined with an odor stream (0.3 l/min) obtained by circulating the air flow through vials filled with a liquid odorant. Odors were prepared at 10-fold dilution in mineral oil except ACV which was diluted in double distilled water. Liquid dilution and mixing carrier and odor stimulus stream resulted in a final 100 fold dilution of odors. Fresh odors were prepared daily.
The 3 l/minute total flow (carrier and odor stimulus) was split between 20 chambers resulting in a flow rate of 0.15 l/minute per half chamber. Two identical odor delivery systems delivered odors independently to each half of the chamber. Air or odor streams from the two halves of the chamber converged at a central choice zone. The 20 chambers were stacked in two columns each containing 10 chambers and were backlit by 940 nm LEDs (Vishay TSAL6400). Images were obtained by a MAKO CMOS camera (Allied Vision Technologies) equipped with a Computar M0814-MP2 lens. The apparatus was operated in a temperature controlled incubator (Panasonic MIR 154) at 25°C.
A virtual instrument written in LabVIEW 7.1 (National Instruments) extracted fly position data from video images and controlled the delivery of odors. Data were analyzed in MATLAB 2018a (The MathWorks). A fly’s preference was calculated as the percentage of time spent on one side of the chamber. The naive preference index was calculated as (preference for left side when it contained odor) – (preference for left side when it contained air).
The behavioral chambers are more suited to assess odor valence as they are one-dimensional and thus limiting the movement of the flies, forcing the fly to choose between odor and mineral oil. In addition, they have a constant odor concentration throughout the half chamber the odors are presented in, which generates a clear decision zone.
Electrophysiology
Flies were dissected similarly to those used for functional imaging, and the same external solutions were used. Sample sizes were chosen to be consistent with previous works in the field. In vivo whole-cell current clamp recordings were made as previously described (Wilson and Laurent, 2005) on 2-4 days old flies. Briefly, the GH298-GAL4 driver line was used to drive GFP in iLN and the flies’ brains were visualized on a Scientifica SliceScope Pro 1000 upright microscope with a 40x water immersion objective. Patch pipettes with a resistance of 9–12 MΩ were filled with a solution containing: potassium aspartate 140mM, HEPES 10mM, KCL 1mM, MgATP 4mM, Na3GTP 0.5mM, EGTA 1mM. The pH of the solution was adjusted to 7.3 and osmolarity to 265 mOsm. Voltage was acquired using an Axon Instruments MultiClamp 700B in current-clamp mode, was digitized at 50 kHz, and low-pass filtered at 1 kHz. Current steps of −40pA to 100pA were applied with six trials for each condition (pre/post muscarine). Upon achieving a Giga-seal and following and subsequently break-in, a small constant hyperpolarizing current was applied to maintain a membrane potential of −60mV.
Computational model
The computational model was based on a previously described short-term synaptic depression model of the ORN to ePN synapse (Nagel et al., 2015). At each time sample a vector of ORN firing rates was convolved with the previously described depression model function (A(t)). ORN input was then summed (g(t)) and fed into a leaky integrate and fire neuron (Figure 7A). For each condition 100 repetitions were performed and averaged to yield peristimulus time histograms (PSTHs). For detailed model parameters and equations see source code.
Quantification and Statistical Analysis
Statistics and data analysis
All statistical testing and parameter extraction were done using custom MATLAB code (The MathWorks, Inc.), Prism 6 (GraphPad) and with SPSS (IBM Corp.). All statistical tests details can be found in Table S1. Significance was defines as a p value smaller than 0.05 and all statistical tests were two-sided.
For Figure 7, two exponents were required in most cases to fit the data. For consistency, the same fit equation was used for all panels.
Effect size was calculated with the Measures of Effect Size (MES) Toolbox https://github.com/hhentschke/measures-of-effect-size-toolbox/blob/master/readme.md).
For presentation, bar plots with dots were generated using the UnivarScatter MATLAB ToolBox (https://www.mathworks.com/matlabcentral/fileexchange/54243-univarscatter) and the shadedErrorBar function (https://github.com/raacampbell/shadedErrorBar) for shaded errors on imaging traces.
Data and Code Availability
The data and code used to generate Figures 1, 2, 3, 4, 5, and 6 are available from the Lead Contact on request.
The code used to generate the computational model and the details regarding the generation of the mAChR-A-MiMIC-GAL4 driver line is available on GitHub (https://github.com/Eyal-ro).
Acknowledgments
We thank Dr. Karla Kaun and Dr. Andrew C. Lin for critical comments on the manuscript. We thank Dr. Silke Sachse, Dr. Ya-Hui Chou, Dr. Gero Miesenböck, the Bloomington Stock Center, the Vienna Drosophila RNAi Center, and the Kyoto Drosophila Genetic Resource Center for fly strains. We also thank Dr. di Antonio for sending his anti-dvGlut antiserum. We thank Dr. Katherine I. Nagel for providing the code for the computational model. This work was supported by the European Research Council (676844, M.P.) and the Israel Science Foundation (343/18, M.P.).
Author Contributions
Conceptualization, Methodology, Investigation, Formal Analysis, Software, Writing – Review & Editing, Visualization, E.R. Investigation, H.L. Project Initiation, Conceptualization, Methodology, Investigation, Formal Analysis, Software, Writing – Original Draft, Writing – Review & Editing, Visualization, Supervision, Funding Acquisition, M.P.
Declaration of Interests
The authors declare no competing interests.
Published: December 3, 2019
Footnotes
Supplemental Information can be found online at https://doi.org/10.1016/j.celrep.2019.10.125.
Supplemental Information
Statistical analysis for the data presented in Figures 1, 2, 3, 4, 5, 6, and S1–S6.
References
- Badel L., Ohta K., Tsuchimoto Y., Kazama H. Decoding of Context-Dependent Olfactory Behavior in Drosophila. Neuron. 2016;91:155–167. doi: 10.1016/j.neuron.2016.05.022. [DOI] [PubMed] [Google Scholar]
- Berck M.E., Khandelwal A., Claus L., Hernandez-Nunez L., Si G., Tabone C.J., Li F., Truman J.W., Fetter R.D., Louis M. The wiring diagram of a glomerular olfactory system. eLife. 2016;5:e14859. doi: 10.7554/eLife.14859. [DOI] [PMC free article] [PubMed] [Google Scholar]
- Bielopolski N., Amin H., Apostolopoulou A.A., Rozenfeld E., Lerner H., Huetteroth W., Lin A.C., Parnas M. Inhibitory muscarinic acetylcholine receptors enhance aversive olfactory learning in adult Drosophila. eLife. 2019;8:e48264. doi: 10.7554/eLife.48264. [DOI] [PMC free article] [PubMed] [Google Scholar]
- Blake A.D., Anthony N.M., Chen H.H., Harrison J.B., Nathanson N.M., Sattelle D.B. Drosophila nervous system muscarinic acetylcholine receptor: transient functional expression and localization by immunocytochemistry. Mol. Pharmacol. 1993;44:716–724. [PubMed] [Google Scholar]
- Branson K., Robie A.A., Bender J., Perona P., Dickinson M.H. High-throughput ethomics in large groups of Drosophila. Nat. Methods. 2009;6:451–457. doi: 10.1038/nmeth.1328. [DOI] [PMC free article] [PubMed] [Google Scholar]
- Buchanan K.A., Petrovic M.M., Chamberlain S.E.L., Marrion N.V., Mellor J.R. Facilitation of long-term potentiation by muscarinic M(1) receptors is mediated by inhibition of SK channels. Neuron. 2010;68:948–963. doi: 10.1016/j.neuron.2010.11.018. [DOI] [PMC free article] [PubMed] [Google Scholar]
- Caruana D.A., Warburton E.C., Bashir Z.I. Induction of activity-dependent LTD requires muscarinic receptor activation in medial prefrontal cortex. J. Neurosci. 2011;31:18464–18478. doi: 10.1523/JNEUROSCI.4719-11.2011. [DOI] [PMC free article] [PubMed] [Google Scholar]
- Chen T.-W.W., Wardill T.J., Sun Y., Pulver S.R., Renninger S.L., Baohan A., Schreiter E.R., Kerr R.A., Orger M.B., Jayaraman V. Ultrasensitive fluorescent proteins for imaging neuronal activity. Nature. 2013;499:295–300. doi: 10.1038/nature12354. [DOI] [PMC free article] [PubMed] [Google Scholar]
- Chou Y.-H.H., Spletter M.L., Yaksi E., Leong J.C.S.S., Wilson R.I., Luo L. Diversity and wiring variability of olfactory local interneurons in the Drosophila antennal lobe. Nat. Neurosci. 2010;13:439–449. doi: 10.1038/nn.2489. [DOI] [PMC free article] [PubMed] [Google Scholar]
- Claridge-Chang A., Roorda R.D., Vrontou E., Sjulson L., Li H., Hirsh J., Miesenböck G. Writing memories with light-addressable reinforcement circuitry. Cell. 2009;139:405–415. doi: 10.1016/j.cell.2009.08.034. [DOI] [PMC free article] [PubMed] [Google Scholar]
- Collin C., Hauser F., Gonzalez de Valdivia E., Li S., Reisenberger J., Carlsen E.M.M., Khan Z., Hansen N.O., Puhm F., Søndergaard L. Two types of muscarinic acetylcholine receptors in Drosophila and other arthropods. Cell. Mol. Life Sci. 2013;70:3231–3242. doi: 10.1007/s00018-013-1334-0. [DOI] [PMC free article] [PubMed] [Google Scholar]
- Croset V., Treiber C.D., Waddell S. Cellular diversity in the Drosophila midbrain revealed by single-cell transcriptomics. eLife. 2018;7:e34550. doi: 10.7554/eLife.34550. [DOI] [PMC free article] [PubMed] [Google Scholar]
- Daniels R.W., Gelfand M.V., Collins C.A., DiAntonio A. Visualizing glutamatergic cell bodies and synapses in Drosophila larval and adult CNS. J. Comp. Neurol. 2008;508:131–152. doi: 10.1002/cne.21670. [DOI] [PubMed] [Google Scholar]
- Das S., Sadanandappa M.K., Dervan A., Larkin A., Lee J.A., Sudhakaran I.P., Priya R., Heidari R., Holohan E.E., Pimentel A. Plasticity of local GABAergic interneurons drives olfactory habituation. Proc. Natl. Acad. Sci. USA. 2011;108:E646–E654. doi: 10.1073/pnas.1106411108. [DOI] [PMC free article] [PubMed] [Google Scholar]
- Davie K., Janssens J., Koldere D., De Waegeneer M., Pech U., Kreft Ł., Aibar S., Makhzami S., Christiaens V., Bravo González-Blas C. A Single-Cell Transcriptome Atlas of the Aging Drosophila Brain. Cell. 2018;174:982–998.e20. doi: 10.1016/j.cell.2018.05.057. [DOI] [PMC free article] [PubMed] [Google Scholar]
- Dennis S.H., Pasqui F., Colvin E.M., Sanger H., Mogg A.J., Felder C.C., Broad L.M., Fitzjohn S.M., Isaac J.T.R., Mellor J.R. Activation of Muscarinic M1 Acetylcholine Receptors Induces Long-Term Potentiation in the Hippocampus. Cereb. Cortex. 2016;26:414–442. doi: 10.1093/cercor/bhv227. [DOI] [PMC free article] [PubMed] [Google Scholar]
- Dickinson B.A., Jo J., Seok H., Son G.H., Whitcomb D.J., Davies C.H., Sheng M., Collingridge G.L., Cho K. A novel mechanism of hippocampal LTD involving muscarinic receptor-triggered interactions between AMPARs, GRIP and liprin-alpha. Mol. Brain. 2009;2:18. doi: 10.1186/1756-6606-2-18. [DOI] [PMC free article] [PubMed] [Google Scholar]
- Egea-Weiss A., Renner A., Kleineidam C.J., Szyszka P. High Precision of Spike Timing across Olfactory Receptor Neurons Allows Rapid Odor Coding in Drosophila. iScience. 2018;4:76–83. doi: 10.1016/j.isci.2018.05.009. [DOI] [PMC free article] [PubMed] [Google Scholar]
- Fernández de Sevilla D., Buño W. The muscarinic long-term enhancement of NMDA and AMPA receptor-mediated transmission at Schaffer collateral synapses develop through different intracellular mechanisms. J. Neurosci. 2010;30:11032–11042. doi: 10.1523/JNEUROSCI.1848-10.2010. [DOI] [PMC free article] [PubMed] [Google Scholar]
- Fernandez de Sevilla D., Nunez A., Borde M., Malinow R., Buno W. Cholinergic-Mediated IP3-Receptor Activation Induces Long-Lasting Synaptic Enhancement in CA1 Pyramidal Neurons. J. Neurosci. 2008;28:1469–1478. doi: 10.1523/JNEUROSCI.2723-07.2008. [DOI] [PMC free article] [PubMed] [Google Scholar]
- Galizia C.G. Olfactory coding in the insect brain: data and conjectures. Eur. J. Neurosci. 2014;39:1784–1795. doi: 10.1111/ejn.12558. [DOI] [PMC free article] [PubMed] [Google Scholar]
- Gao Q., Yuan B., Chess A. Convergent projections of Drosophila olfactory neurons to specific glomeruli in the antennal lobe. Nat. Neurosci. 2000;3:780–785. doi: 10.1038/77680. [DOI] [PubMed] [Google Scholar]
- Grabe V., Strutz A., Baschwitz A., Hansson B.S., Sachse S. Digital in vivo 3D atlas of the antennal lobe of Drosophila melanogaster. J. Comp. Neurol. 2015;523:530–544. doi: 10.1002/cne.23697. [DOI] [PubMed] [Google Scholar]
- Hallem E.A., Carlson J.R. The odor coding system of Drosophila. Trends Genet. 2004;20:453–459. doi: 10.1016/j.tig.2004.06.015. [DOI] [PubMed] [Google Scholar]
- Hallem E.A., Carlson J.R. Coding of odors by a receptor repertoire. Cell. 2006;125:143–160. doi: 10.1016/j.cell.2006.01.050. [DOI] [PubMed] [Google Scholar]
- Hannan F., Hall L.M. Temporal and spatial expression patterns of two G-protein coupled receptors in Drosophila melanogaster. Invert. Neurosci. 1996;2:71–83. doi: 10.1007/BF02336662. [DOI] [PubMed] [Google Scholar]
- Hayashi S., Ito K., Sado Y., Taniguchi M., Akimoto A., Takeuchi H., Aigaki T., Matsuzaki F., Nakagoshi H., Tanimura T. GETDB, a database compiling expression patterns and molecular locations of a collection of Gal4 enhancer traps. Genesis. 2002;34:58–61. doi: 10.1002/gene.10137. [DOI] [PubMed] [Google Scholar]
- Heimbeck G., Bugnon V., Gendre N., Keller A., Stocker R.F. A central neural circuit for experience-independent olfactory and courtship behavior in Drosophila melanogaster. Proc. Natl. Acad. Sci. USA. 2001;98:15336–15341. doi: 10.1073/pnas.011314898. [DOI] [PMC free article] [PubMed] [Google Scholar]
- Heinbockel T., Heyward P., Conquet F., Ennis M. Regulation of Main Olfactory Bulb Mitral Cell Excitability by Metabotropic Glutamate Receptor mGluR1. J. Neurophysiol. 2004;92:3085–3096. doi: 10.1152/jn.00349.2004. [DOI] [PubMed] [Google Scholar]
- Heinbockel T., Laaris N., Ennis M. Metabotropic Glutamate Receptors in the Main Olfactory Bulb Drive Granule Cell-Mediated Inhibition. J. Neurophysiol. 2007;97:858–870. doi: 10.1152/jn.00884.2006. [DOI] [PMC free article] [PubMed] [Google Scholar]
- Heinbockel T., Hamilton K.A., Ennis M. Group I metabotropic glutamate receptors are differentially expressed by two populations of olfactory bulb granule cells. J. Neurophysiol. 2007;97:3136–3141. doi: 10.1152/jn.01202.2006. [DOI] [PubMed] [Google Scholar]
- Hong E.J., Wilson R.I. Simultaneous encoding of odors by channels with diverse sensitivity to inhibition. Neuron. 2015;85:573–589. doi: 10.1016/j.neuron.2014.12.040. [DOI] [PMC free article] [PubMed] [Google Scholar]
- Jo J., Son G.H., Winters B.L., Kim M.J., Whitcomb D.J., Dickinson B.A., Lee Y.B., Futai K., Amici M., Sheng M. Muscarinic receptors induce LTD of NMDAR EPSCs via a mechanism involving hippocalcin, AP2 and PSD-95. Nat. Neurosci. 2010;13:1216–1224. doi: 10.1038/nn.2636. [DOI] [PubMed] [Google Scholar]
- Kazama H., Wilson R.I. Homeostatic matching and nonlinear amplification at identified central synapses. Neuron. 2008;58:401–413. doi: 10.1016/j.neuron.2008.02.030. [DOI] [PMC free article] [PubMed] [Google Scholar]
- Knaden M., Strutz A., Ahsan J., Sachse S., Hansson B.S. Spatial representation of odorant valence in an insect brain. Cell Rep. 2012;1:392–399. doi: 10.1016/j.celrep.2012.03.002. [DOI] [PubMed] [Google Scholar]
- Lai S.-L., Awasaki T., Ito K., Lee T. Clonal analysis of Drosophila antennal lobe neurons: diverse neuronal architectures in the lateral neuroblast lineage. Development. 2008;135:2883–2893. doi: 10.1242/dev.024380. [DOI] [PubMed] [Google Scholar]
- Li Q., Liberles S.D. Aversion and attraction through olfaction. Curr. Biol. 2015;25:R120–R129. doi: 10.1016/j.cub.2014.11.044. [DOI] [PMC free article] [PubMed] [Google Scholar]
- Lin A.C., Bygrave A.M., de Calignon A., Lee T., Miesenböck G. Sparse, decorrelated odor coding in the mushroom body enhances learned odor discrimination. Nat. Neurosci. 2014;17:559–568. doi: 10.1038/nn.3660. [DOI] [PMC free article] [PubMed] [Google Scholar]
- Liou N.F., Lin S.H., Chen Y.J., Tsai K.T., Yang C.J., Lin T.Y., Wu T.H., Lin H.J., Chen Y.T., Gohl D.M. Diverse populations of local interneurons integrate into the Drosophila adult olfactory circuit. Nat. Commun. 2018;9:2232. doi: 10.1038/s41467-018-04675-x. [DOI] [PMC free article] [PubMed] [Google Scholar]
- Liu W.W., Wilson R.I. Glutamate is an inhibitory neurotransmitter in the Drosophila olfactory system. Proc. Natl. Acad. Sci. USA. 2013;110:10294–10299. doi: 10.1073/pnas.1220560110. [DOI] [PMC free article] [PubMed] [Google Scholar]
- Lizbinski K.M., Dacks A.M. Intrinsic and Extrinsic Neuromodulation of Olfactory Processing. Front. Cell. Neurosci. 2018;11:424. doi: 10.3389/fncel.2017.00424. [DOI] [PMC free article] [PubMed] [Google Scholar]
- Lizbinski K.M., Marsat G., Dacks A.M. Systematic Analysis of Transmitter Coexpression Reveals Organizing Principles of Local Interneuron Heterogeneity. eNeuro. 2018;5 doi: 10.1523/ENEURO.0212-18.2018. ENEURO.0212-18.2018. [DOI] [PMC free article] [PubMed] [Google Scholar]
- Malloy C.A., Somasundaram E., Omar A., Bhutto U., Medley M., Dzubuk N., Cooper R.L. Pharmacological identification of cholinergic receptor subtypes: modulation of locomotion and neural circuit excitability in Drosophila larvae. Neuroscience. 2019;411:47–64. doi: 10.1016/j.neuroscience.2019.05.016. [DOI] [PubMed] [Google Scholar]
- Martelli C., Fiala A. Slow presynaptic mechanisms that mediate adaptation in the olfactory pathway of Drosophila. eLife. 2019;8:e43735. doi: 10.7554/eLife.43735. [DOI] [PMC free article] [PubMed] [Google Scholar]
- Masse N.Y., Turner G.C., Jefferis G.S.X.E. Olfactory information processing in Drosophila. Curr. Biol. 2009;19:R700–R713. doi: 10.1016/j.cub.2009.06.026. [DOI] [PubMed] [Google Scholar]
- Mohamed A.A.M., Retzke T., Das Chakraborty S., Fabian B., Hansson B.S., Knaden M., Sachse S. Odor mixtures of opposing valence unveil inter-glomerular crosstalk in the Drosophila antennal lobe. Nat. Commun. 2019;10:1201. doi: 10.1038/s41467-019-09069-1. [DOI] [PMC free article] [PubMed] [Google Scholar]
- Nagel K.I., Wilson R.I. Biophysical mechanisms underlying olfactory receptor neuron dynamics. Nat. Neurosci. 2011;14:208–216. doi: 10.1038/nn.2725. [DOI] [PMC free article] [PubMed] [Google Scholar]
- Nagel K.I., Wilson R.I. Mechanisms Underlying Population Response Dynamics in Inhibitory Interneurons of the Drosophila Antennal Lobe. J. Neurosci. 2016;36:4325–4338. doi: 10.1523/JNEUROSCI.3887-15.2016. [DOI] [PMC free article] [PubMed] [Google Scholar]
- Nagel K.I., Hong E.J., Wilson R.I. Synaptic and circuit mechanisms promoting broadband transmission of olfactory stimulus dynamics. Nat. Neurosci. 2015;18:56–65. doi: 10.1038/nn.3895. [DOI] [PMC free article] [PubMed] [Google Scholar]
- Okada R., Awasaki T., Ito K. Gamma-aminobutyric acid (GABA)-mediated neural connections in the Drosophila antennal lobe. J. Comp. Neurol. 2009;514:74–91. doi: 10.1002/cne.21971. [DOI] [PubMed] [Google Scholar]
- Olsen S.R., Wilson R.I. Lateral presynaptic inhibition mediates gain control in an olfactory circuit. Nature. 2008;452:956–960. doi: 10.1038/nature06864. [DOI] [PMC free article] [PubMed] [Google Scholar]
- Olsen S.R., Bhandawat V., Wilson R.I. Excitatory interactions between olfactory processing channels in the Drosophila antennal lobe. Neuron. 2007;54:89–103. doi: 10.1016/j.neuron.2007.03.010. [DOI] [PMC free article] [PubMed] [Google Scholar]
- Olsen S.R., Bhandawat V., Wilson R.I. Divisive normalization in olfactory population codes. Neuron. 2010;66:287–299. doi: 10.1016/j.neuron.2010.04.009. [DOI] [PMC free article] [PubMed] [Google Scholar]
- Onai T., FitzGerald M.G., Arakawa S., Gocayne J.D., Urquhart D.A., Hall L.M., Fraser C.M., McCombie W.R., Venter J.C. Cloning, sequence analysis and chromosome localization of a Drosophila muscarinic acetylcholine receptor. FEBS Lett. 1989;255:219–225. doi: 10.1016/0014-5793(89)81095-6. [DOI] [PubMed] [Google Scholar]
- Ovsepian S.V., Anwyl R., Rowan M.J. Endogenous acetylcholine lowers the threshold for long-term potentiation induction in the CA1 area through muscarinic receptor activation: in vivo study. Eur. J. Neurosci. 2004;20:1267–1275. doi: 10.1111/j.1460-9568.2004.03582.x. [DOI] [PubMed] [Google Scholar]
- Parnas M., Lin A.C., Huetteroth W., Miesenböck G. Odor discrimination in Drosophila: from neural population codes to behavior. Neuron. 2013;79:932–944. doi: 10.1016/j.neuron.2013.08.006. [DOI] [PMC free article] [PubMed] [Google Scholar]
- Potter C.J., Tasic B., Russler E.V., Liang L., Luo L. The Q system: a repressible binary system for transgene expression, lineage tracing, and mosaic analysis. Cell. 2010;141:536–548. doi: 10.1016/j.cell.2010.02.025. [DOI] [PMC free article] [PubMed] [Google Scholar]
- Ren G.R., Folke J., Hauser F., Li S., Grimmelikhuijzen C.J.P. The A- and B-type muscarinic acetylcholine receptors from Drosophila melanogaster couple to different second messenger pathways. Biochem. Biophys. Res. Commun. 2015;462:358–364. doi: 10.1016/j.bbrc.2015.04.141. [DOI] [PubMed] [Google Scholar]
- Root C.M., Masuyama K., Green D.S., Enell L.E., Nässel D.R., Lee C.H., Wang J.W. A presynaptic gain control mechanism fine-tunes olfactory behavior. Neuron. 2008;59:311–321. doi: 10.1016/j.neuron.2008.07.003. [DOI] [PMC free article] [PubMed] [Google Scholar]
- Rybak J., Talarico G., Ruiz S., Arnold C., Cantera R., Hansson B.S. Synaptic circuitry of identified neurons in the antennal lobe of Drosophila melanogaster. J. Comp. Neurol. 2016;524:1920–1956. doi: 10.1002/cne.23966. [DOI] [PMC free article] [PubMed] [Google Scholar]
- Schindelin J., Arganda-Carreras I., Frise E., Kaynig V., Longair M., Pietzsch T., Preibisch S., Rueden C., Saalfeld S., Schmid B. Fiji: an open-source platform for biological-image analysis. Nat. Methods. 2012;9:676–682. doi: 10.1038/nmeth.2019. [DOI] [PMC free article] [PubMed] [Google Scholar]
- Seki Y., Rybak J., Wicher D., Sachse S., Hansson B.S. Physiological and morphological characterization of local interneurons in the Drosophila antennal lobe. J. Neurophysiol. 2010;104:1007–1019. doi: 10.1152/jn.00249.2010. [DOI] [PubMed] [Google Scholar]
- Seki Y., Dweck H.K.M., Rybak J., Wicher D., Sachse S., Hansson B.S. Olfactory coding from the periphery to higher brain centers in the Drosophila brain. BMC Biol. 2017;15:56. doi: 10.1186/s12915-017-0389-z. [DOI] [PMC free article] [PubMed] [Google Scholar]
- Semmelhack J.L., Wang J.W. Select Drosophila glomeruli mediate innate olfactory attraction and aversion. Nature. 2009;459:218–223. doi: 10.1038/nature07983. [DOI] [PMC free article] [PubMed] [Google Scholar]
- Shang Y., Claridge-Chang A., Sjulson L., Pypaert M., Miesenböck G. Excitatory local circuits and their implications for olfactory processing in the fly antennal lobe. Cell. 2007;128:601–612. doi: 10.1016/j.cell.2006.12.034. [DOI] [PMC free article] [PubMed] [Google Scholar]
- Shapiro R.A., Wakimoto B.T., Subers E.M., Nathanson N.M. Characterization and functional expression in mammalian cells of genomic and cDNA clones encoding a Drosophila muscarinic acetylcholine receptor. Proc. Natl. Acad. Sci. USA. 1989;86:9039–9043. doi: 10.1073/pnas.86.22.9039. [DOI] [PMC free article] [PubMed] [Google Scholar]
- Simon J.C., Dickinson M.H. A new chamber for studying the behavior of Drosophila. PLoS One. 2010;5:e8793. doi: 10.1371/journal.pone.0008793. [DOI] [PMC free article] [PubMed] [Google Scholar]
- Stocker R.F., Heimbeck G., Gendre N., de Belle J.S. Neuroblast ablation in Drosophila P[GAL4] lines reveals origins of olfactory interneurons. J. Neurobiol. 1997;32:443–456. doi: 10.1002/(sici)1097-4695(199705)32:5<443::aid-neu1>3.0.co;2-5. [DOI] [PubMed] [Google Scholar]
- Strutz A., Soelter J., Baschwitz A., Farhan A., Grabe V., Rybak J., Knaden M., Schmuker M., Hansson B.S., Sachse S. Decoding odor quality and intensity in the Drosophila brain. eLife. 2014;3:e04147. doi: 10.7554/eLife.04147. [DOI] [PMC free article] [PubMed] [Google Scholar]
- Sudhakaran I.P., Holohan E.E., Osman S., Rodrigues V., Vijayraghavan K., Ramaswami M. Plasticity of recurrent inhibition in the Drosophila antennal lobe. J. Neurosci. 2012;32:7225–7231. doi: 10.1523/JNEUROSCI.1099-12.2012. [DOI] [PMC free article] [PubMed] [Google Scholar]
- Tanaka N.K., Endo K., Ito K. Organization of antennal lobe-associated neurons in adult Drosophila melanogaster brain. J. Comp. Neurol. 2012;520:4067–4130. doi: 10.1002/cne.23142. [DOI] [PubMed] [Google Scholar]
- Thévenaz P., Ruttimann U.E., Unser M. A pyramid approach to subpixel registration based on intensity. IEEE Trans. Image Process. 1998;7:27–41. doi: 10.1109/83.650848. [DOI] [PubMed] [Google Scholar]
- Tobin W.F., Wilson R.I., Lee W.A. Wiring variations that enable and constrain neural computation in a sensory microcircuit. eLife. 2017;6:e24838. doi: 10.7554/eLife.24838. [DOI] [PMC free article] [PubMed] [Google Scholar]
- Touhara K., Vosshall L.B. Sensing odorants and pheromones with chemosensory receptors. Annu. Rev. Physiol. 2009;71:307–332. doi: 10.1146/annurev.physiol.010908.163209. [DOI] [PubMed] [Google Scholar]
- Venken K.J.T., Schulze K.L., Haelterman N.A., Pan H., He Y., Evans-Holm M., Carlson J.W., Levis R.W., Spradling A.C., Hoskins R.A., Bellen H.J. MiMIC: a highly versatile transposon insertion resource for engineering Drosophila melanogaster genes. Nat. Methods. 2011;8:737–743. doi: 10.1038/nmeth.1662. [DOI] [PMC free article] [PubMed] [Google Scholar]
- Volders K., Scholz S., Slabbaert J.R., Nagel A.C., Verstreken P., Creemers J.W.M., Callaerts P., Schwärzel M. Drosophila rugose is a functional homolog of mammalian Neurobeachin and affects synaptic architecture, brain morphology, and associative learning. J. Neurosci. 2012;32:15193–15204. doi: 10.1523/JNEUROSCI.6424-11.2012. [DOI] [PMC free article] [PubMed] [Google Scholar]
- Vosshall L.B., Amrein H., Morozov P.S., Rzhetsky A., Axel R. A spatial map of olfactory receptor expression in the Drosophila antenna. Cell. 1999;96:725–736. doi: 10.1016/s0092-8674(00)80582-6. [DOI] [PubMed] [Google Scholar]
- Vosshall L.B., Wong A.M., Axel R. An olfactory sensory map in the fly brain. Cell. 2000;102:147–159. doi: 10.1016/s0092-8674(00)00021-0. [DOI] [PubMed] [Google Scholar]
- Wang J.W., Wong A.M., Flores J., Vosshall L.B., Axel R. Two-photon calcium imaging reveals an odor-evoked map of activity in the fly brain. Cell. 2003;112:271–282. doi: 10.1016/s0092-8674(03)00004-7. [DOI] [PubMed] [Google Scholar]
- Williams S.R., Fletcher L.N. A Dendritic Substrate for the Cholinergic Control of Neocortical Output Neurons. Neuron. 2019;101:486–499.e4. doi: 10.1016/j.neuron.2018.11.035. [DOI] [PubMed] [Google Scholar]
- Wilson R.I. Early olfactory processing in Drosophila: mechanisms and principles. Annu. Rev. Neurosci. 2013;36:217–241. doi: 10.1146/annurev-neuro-062111-150533. [DOI] [PMC free article] [PubMed] [Google Scholar]
- Wilson R.I., Laurent G. Role of GABAergic inhibition in shaping odor-evoked spatiotemporal patterns in the Drosophila antennal lobe. J. Neurosci. 2005;25:9069–9079. doi: 10.1523/JNEUROSCI.2070-05.2005. [DOI] [PMC free article] [PubMed] [Google Scholar]
- Wu J.S., Luo L. A protocol for dissecting Drosophila melanogaster brains for live imaging or immunostaining. Nat. Protoc. 2006;1:2110–2115. doi: 10.1038/nprot.2006.336. [DOI] [PubMed] [Google Scholar]
- Xia R.Y., Li M.Q., Wu Y.S., Qi Y.X., Ye G.Y., Huang J. A new family of insect muscarinic acetylcholine receptors. Insect Mol. Biol. 2016;25:362–369. doi: 10.1111/imb.12229. [DOI] [PubMed] [Google Scholar]
Associated Data
This section collects any data citations, data availability statements, or supplementary materials included in this article.
Supplementary Materials
Confocal sections (1.5 μm) through the central brain of a fly carrying mAChR-A-MiMIC-GAL4 > UAS-mCD8-GFP transgenes.
Statistical analysis for the data presented in Figures 1, 2, 3, 4, 5, 6, and S1–S6.
Data Availability Statement
The data and code used to generate Figures 1, 2, 3, 4, 5, and 6 are available from the Lead Contact on request.
The code used to generate the computational model and the details regarding the generation of the mAChR-A-MiMIC-GAL4 driver line is available on GitHub (https://github.com/Eyal-ro).