Abstract
Background:
Breast cancer (BC) risk assessment models are statistical estimates based on patient characteristics. We developed a gene expression assay to assess BC risk using benign breast biopsy tissue.
Study Design:
A NanoString-based Malignancy-Risk (MR) gene signature was validated for formalin-fixed paraffin-embedded (FFPE) tissue. It was applied to FFPE benign and BC specimens obtained from women who underwent breast biopsy, some of whom developed BC during follow-up to evaluate diagnostic capability of the MR signature. BC risk was calculated with MR score, Gail risk score, and both tests combined. Logistic regression and receiver operating characteristic curves were used to evaluate these 3 models.
Results:
NanoString MR demonstrated concordance between FF and FFPE malignant samples (r=0.99). Within the validation set, 563 women with benign breast biopsies from 2007-2011 were identified and followed for at least 5 years; 50 women developed BC (affected) within 5 years from biopsy. Three groups compared: benign tissue from unaffected and affected patients and malignant tissue from affected patients. Kruskal-Wallis test suggested difference between the groups (p=0.09) with trend in higher predicted MR score for benign tissue from affected patients prior to development of BC. Neither the MR signature nor Gail risk score were statistically different between affected and unaffected patients; combining both tests demonstrated best predictive value (AUC=0.71).
Conclusions:
FFPE gene expression assays can be used to develop a predictive test for BC. Further investigation of the combined MR signature and Gail Model is required. Our assay was limited by scant cellularity of archived breast tissue.
Keywords: Breast cancer, Gail Model, gene signature, gene expression, cancer risk, NanoString
Introduction:
Breast cancer (BC) risk assessment is important for the identification of patients that will benefit from surveillance or chemoprevention. The risk factors associated with the development of BC have been well documented; for example, age over 65 is associated with a nearly 6-fold increase in BC risk (1). The Gail Model is a commonly used statistical model for estimating 5-year and lifetime risk of developing breast cancer in women (2). It is one of the earliest developed models, and as a result, has been widely studied and validated (3). The model is based on 4 major risk factors: age of menarche, age of first live birth, family history of breast cancer and multiple previous benign breast biopsies with adjustment for current age. There is no doubt that the Gail Model has benefitted countless women, yet there are major limitations. Since its introduction, subsequent versions have been expanded to more accurately predict breast cancer risk in different racial groups to expand its applicability (4–6). However, the Gail Model remains limited in its ability to predict BC at the individual level, which is well discussed in an editorial by Elmore et al (7). At the population level, the original Gail model reported an expected (predicted BC) to observed BC ratio of 0.93 based on the patients in their study population (2). However, when applied to a validation cohort, Rockhill et al reported concordance (high risk without development of BC or low risk with development of BC) of only 0.58 for the individual patient (7, 8). This demonstrates a limitation of statistical models for predicting BC development; risk factors may be well defined but are often not specific to a disease. An effective tool for BC prediction should function well at the individual level and ideally utilize factors that are specific to BC.
The development of a gene expression-based clinical assay to quantify breast cancer risk represents a refined and personalized medicine approach to BC risk reduction and specific therapeutic decision-making. Breast abnormalities are preferentially diagnosed by percutaneous breast biopsy and approximately 70% of biopsies will be benign (9). The actual diagnosis of BC is a histologic finding. Importantly, there is evidence demonstrating that microscopically normal-appearing tissue may harbor pre-malignant genetic aberrancies (10). In order to maximize the potential clinical use of this finding, we sought to validate a unique gene expression signature utilizing a formalin-fixed paraffin-embedded (FFPE) based platform, which is the standard process for archival tissue at all institutions.
We previously described a Malignancy Risk gene signature of 117 genes capable of distinguishing histologically-normal tissue at increased risk for breast cancer development (10). Notably, the majority of the genes found to be at risk for BC development in benign tissue were associated with cell cycle and cell proliferative functions. This MR gene signature was subsequently applied to non-small cell lung cancer (NSCLC) and found to be associated with overall survival (OS), thus supporting its use as a prognostic and predictive indicator in lung cancer (11). Our hypothesis is that this Malignancy Risk (MR) gene signature is also a more accurate predictor of breast cancer development than the Gail Model in women with 5 years of follow-up after a benign breast biopsy.
The goal of this study was to utilize the MR gene signature to develop an FFPE-based, multi-gene assay to quantify the risk of breast cancer occurrence in unaffected patients within 5 years following a benign breast biopsy. We proposed three aims to achieve this goal: 1) technical validation of a malignancy risk (MR) gene signature from microarray on fresh frozen (FF) tissue to formalin-fixed paraffin-embedded (FFPE) specimens; 2) evaluation of the ability of the MR signature to detect cancer risk in a retrospective cohort and 3) comparison of the MR signature to the Gail Model in predicting BC risk in a retrospective cohort.
Materials and Methods:
The original MR gene signature was identified using FF tissue (10). In order to develop a test that is widely applicable, our first priority was validation of the gene signature in FFPE specimens, which is the clinical standard for long-term tissue preservation and interpretation of biopsy specimens.
Identification of MR Gene Signature in FFPE tissue
We utilized the NanoString platform to identify gene sequences. This platform allows for the creation of custom CodeSets (ie; probes) to identify a gene target of up to 800 genes. The vendor, NanoString Technologies (Seattle, WA) created a custom RNA probe (NanoString nCounter® Gene Expression [GX] CodeSet) of our gene signature (11). Tissue types, tissue sources, and case/control statuses were randomized for each NanoString cartridge hybridization and 50 ng of RNA was used as input for FF tissue samples. As suggested by the vendor, input amounts for FFPE samples were calculated using a sliding scale based on the percentage of fragments >300 nucleotides in length (DV300) as reported from a quality control smear analysis on the Agilent TapeStation (12). Actual input amounts ranged from 66 to 169 ng per sample.
The RNA samples were hybridized and processed on the NanoString nCounter® Analysis System according to the manufacturer’s protocol. Briefly, RNA was hybridized to the reporter and capture probes in a thermal cycler for 16 hours at 65°C. Washing and cartridge immobilization were performed on the nCounter® PrepStation, and the cartridge was scanned at 555 fields of view (FOV) on the nCounter® Digital Analyzer. The resulting .RCC files containing raw counts were reviewed for quality using the NanoString nSolver™ Analysis Software v1.2 and then exported for normalization and analysis.
Specimen identification for validation
Detection of the MR signature in FFPE was validated using the NanoString platform. We performed a single-institution retrospective review of electronic medical record (EMR) and tissue/data banks for female breast cancer patients in accordance with the Institutional Review Board (IRB) of the University of South Florida. From the EMR, we included archived historical, clinical and pathological information. From the tissue/data banks, we obtained FF and FFPE benign breast and invasive malignant tumor specimens that were obtained from the same patient; normal breast tissue was collected at the same time in an adjacent location for comparison. Among these samples, we selected cases with (a) available FF and FFPE tumor specimens and (b) available adjacent normal/benign tissues (both FF and FFPE). For both tissue types (malignant and normal/benign), FF and FFPE samples were paired when possible to detect correlation between microarray and NanoString CodeSet.
RNA extraction and quantification from FF tissue
Frozen tissue specimens were stored in liquid nitrogen within 20 minutes from the time of excision. Once selected, identified tissue sections were embedded in optimal cutting temperature compound and mounted on the microtome-cryostat. Five μm tissue sections were cut and stained with standard H&E protocol and subsequently macrodissected. This harvested tissue was used for RNA extraction using RNeasy mini kit (Qiagen, Hilden, Germany, cat#74106). The tissue was then cut into small fragments in the presence of liquid nitrogen and homogenized in Buffer RLT (Qiagen, cat#79216) and 1 mm glass beads in a Mini-BeadBeater (Biospec Product Inc, Bartlesville, OK, USA) for 1 minute/RT at maximum speed. An equal amount of 70% ethanol was added to the tissue homogenate and the mixture transferred to a silica-based column for centrifuge at 8000g/15s/RT. Then the RNA on the column was washed several times with wash solution and was DNase treated on the column. RNA was eluted from the filter columns with RNase-free water, then quantified using Qubit RNA BR Assay Kit (ThermoFisher Scientific, cat#Q10210). RNA quality control was performed on the Agilent 2200 TapeStation system.
RNA extraction and quantification from FFPE tissue
RNA was extracted from FFPE tissue blocks. A 4 μm section was stained with standard H&E protocol and a trained pathologist identified tumor (if applicable) for analysis. Based on the H&E slide, 20 μm thick sections were serially sectioned from the initial tissue block and tumor was macrodissected. This harvested tissue was used for RNA extraction using the RecoverAll™ Total Nucleic Acid Isolation Kit (ThermoFisher Scientific, Waltham MA, cat#AM1975). The tissue was deparaffinized with xylene followed by subsequent ethanol washes, then digested in a Proteinase K solution and incubated first in 50°C then 80°C for 15 minutes each. RNA in the lysate was precipitated with Isolation Additive and ethanol and separated on a filter cartridge column by centrifugation. Then the RNA on the column was washed several times with wash solutions and was DNase treated on the column. Quantification and quality control were performed in the same manner described above.
Validation of MR score in FFPE tissue
A common set of 117 genes was identified among these samples capable of identifying histologically-normal but molecularly-abnormal benign breast tissue (10). Based on an unpublished internal study utilizing the MR gene signature, 81 of 117 genes were used as the MR gene signature because of their high correlation between FF and FFPE RNA tissue samples in NanoString platform. After further gene screening, 25 genes failed identification of gene expression and did not demonstrate expression above threshold, yielding a set of 56 genes in the final MR gene signature used for the rest of the project (Supplemental Figure 1). An additional 18 housekeeping genes were identified as reference genes to ensure normalization of the data. Batch adjustment was performed using the ComBat R package (13). The NanoStringDiff method published by Wang et al was then used to compare expression of the 56 genes in the MR signature between FF and FFPE specimens (14).
The Malignancy-Risk score is a numerical representation of the weighted average of the expression of each gene in the MR signature. The expression of each gene in the signature is ranked by percentile of expression across all benign tissue, whether the gene was consistently upregulated or downregulated. The weighted average of the percentile ranks were then analyzed using principal component analysis (PCA) to reduce gene expression data dimensionality and express the overall expression level of each gene as a single vector, which is defined by the first principal component (PC1). The PC1 was utilized to account for the largest variation in the data; in our experience with other gene expression studies utilizing the MR signature, the PC1 corresponds most effectively to cancer risk-related information (see 3. Derive malignancy-risk gene score by Chen et al (10)). PC1 loading coefficients, which contribute to PC1, are weighted values of expression for each gene. A higher correlation of PC1 loading coefficients between FFPE and FF specimens indicates that expression of this gene is similar between the tissue types, or, more importantly, in molecularly abnormal benign tissue at risk for cancer transformation. This MR score was previously validated in six external datasets and its association with BC risk tested in patients with atypical ductal hyperplasia (ADH) using the microarray platform (15, 16).
Evaluation of breast cancer risk in a retrospective cohort
In order to evaluate expression the MR signature in benign tissue, we analyzed biopsy specimens from a cohort of patients who underwent core biopsy for abnormal breast imaging and were followed serially for at least two years. All patients in this cohort were consented for a tissue collection study from 2007-2011. From this cohort, patients with a benign biopsy that developed breast cancer during follow-up (affected) were matched to patients that did not develop breast cancer (unaffected). Patients were matched according to age, presence of a first-degree family member with breast cancer and body mass index (BMI). Genetic testing use and results were not obtainable for this patient cohort, as use of genetic testing and results were not included in the EMR until after 2011 due to institutional policy. Because the NanoString experiments were performed at different times, batch adjustment was conducted using ComBat R package (13). The MR signature score was used to analyze specimens from three types of tissue: 1) unaffected benign control, 2) benign “pre-cancer” tissue from affected patients that developed cancer (this tissue was collected at the time of initial biopsy) and 3) malignant samples from the affected patients, collected later at time of cancer diagnosis. The confirmed malignant samples were included as an internal control to ensure identification of malignancy. The Kruskal-Wallis rank sum test was applied to compare the difference in MR signature expression among the three groups, with Dunn’s test for multiple comparisons and adjustment of false discovery rate by the Benjamini-Hockberg correction. We utilized normalized data obtained from the NanoStringDiff method to repeat all of our analyses using the same methods (14).
Evaluation of MR gene signature compared to Gail Model to predict breast cancer risk
Review of the electronic medical record (EMR) for each patient in the validation set was performed; clinical data was collected to generate a Gail risk score based on the online calculator (https://bcrisktool.cancer.gov). Three models were compared: MR score alone, Gail risk score alone, and the combination of both scores. Logistic regression and receiver operating characteristic (ROC) curve were used to evaluate the three models in predicting BC risk. Support vector machine was used to evaluate the final model using the sigmoid kernel with 10-fold cross-validation over 1,000 times. We again utilized normalized data obtained from the NanoStringDiff method to repeat all of our analyses using the same methods (14).
Results
Microarray FF/FFPE Validation
Table 1 identifies the number of specimens of each tissue type utilized to validate the use of the NanoString platform to identify the MR signature in FFPE. We initially collected 144 total FF and FFPE specimens, 7 of which failed quality control. Of the remaining 137 specimens, 112 came from 28 cases with 4 types of available tissue: FF and FFPE for both benign tissue and malignant tumor. The remaining 25 specimens were not complete sets of tissue (Table 1).
Table 1:
Distribution of tissue specimen types for Malignancy-Risk gene signature validation in FFPE
| Type | FF | FFPE | Total |
|---|---|---|---|
| Normal | 30 | 36 | 66 |
| Tumor | 35 | 36 | 71 |
| Total | 65 | 72 | 137 |
Abbreviations: FFPE: formalin-fixed paraffin-embedded
Expression of the 18 housekeeping genes had expected low variation across all samples (CV% 17~23). Normal tissue had poor cellularity and therefore low RNA yield for both FF and FFPE samples. Average RNA yield was 0.64 μg, and there was no correlation between RNA input quantity and successful NanoString assay between FF and FFPE tissue (p=0.4; Supplemental Figure 2). MR genes had good correlation between FF and FFPE tumor specimens with Pearson correlation coefficient (r) of 0.66 (p<0.001) (Figure 1). FF and FFPE normal specimens had poor correlation (r=0.24; p=0.23). However, PC1 loading coefficients of FFPE and FF specimens (n=137) showed high correlation (r=0.99; p<0.001) (Figure 2), supporting the validity of the FFPE assay compared to FF tissue.
Figure 1: Correlation of MR score for the 28 paired samples.
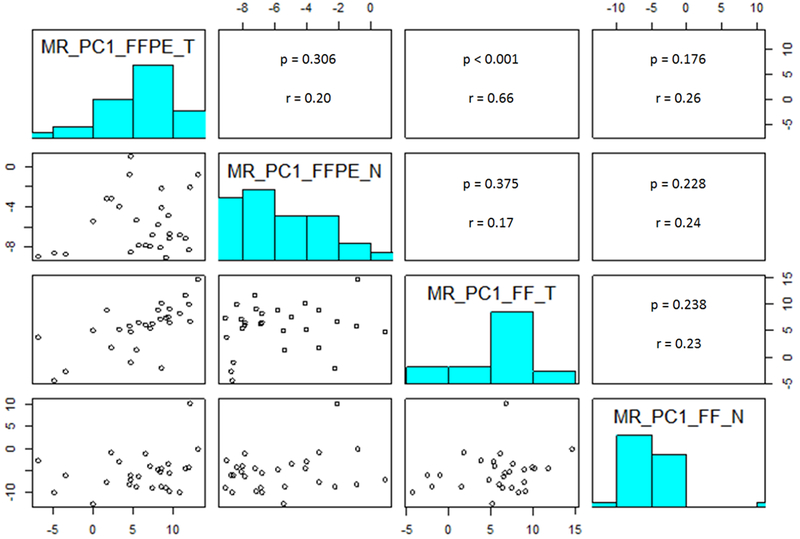
Abbreviations: FFPE = formalin-fixed paraffin-embedded; FF = fresh frozen; MR = malignancy risk score; PC1 = first principal component; MR_PC1_FFPE_T = PC1 loading coefficients of tumor specimen from FFPE; MR_PC1_FFPE_N = PC1 loading coefficients of benign specimen from FFPE; MR_PC1_FF_T = PC1 loading coefficients of tumor specimen from FF tissue; MR_PC1_FF_N = PC1 loading coefficients of benign specimen from FF tissue.
Figure 2: Correlation of PC1 loading coefficients between FFPE and FF specimens (n=137).
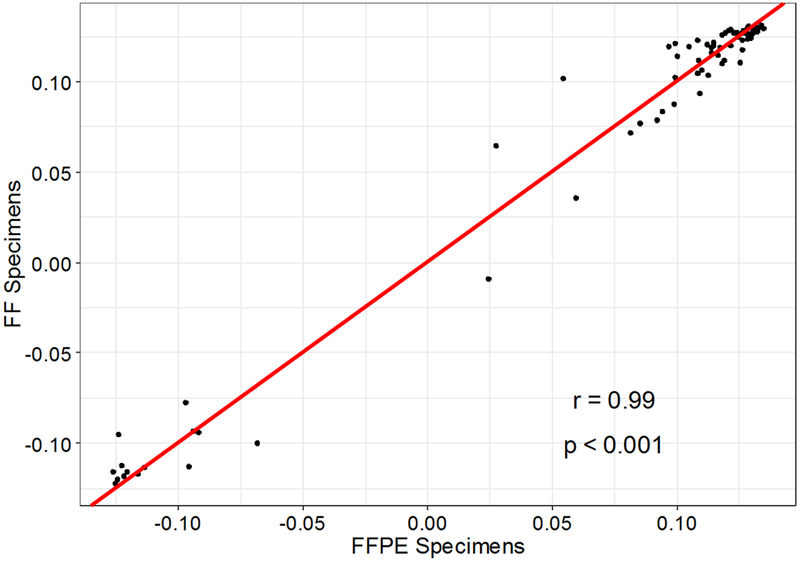
Abbreviations: FFPE = formalin-fixed paraffin-embedded; FF = fresh frozen.
The NanoStringDiff method confirmed a difference in gene expression for 55 of 56 genes in our gene signature based on a q-value <0.05 (Supplemental Table 1). We repeated our analysis of gene expression between FF and FFPE specimens which confirmed high correlation between malignant specimens (r=0.66; p<0.001) and poor correlation between benign specimens (r=0.24; p=0.23). PC1 loading coefficients again demonstrated high correlation (r=0.94; p<0.001; Supplemental Figures 3 and 4).
Comparison of MR gene signature expression in benign and malignant tissue
A separate experimental cohort was then identified for the purposes of evaluating the predictive value of the MR signature. At our institution, 563 women underwent a breast biopsy with a benign result between 2007-2011 (Figure 3). All patients had follow-up for 5 years. At two-year follow-up, 48 patients were identified that subsequently developed BC following benign breast biopsy and two patients developed BC between years two and five. The 50 affected patients that subsequently developed BC were matched 1:2 by age (within five years), body mass index (BMI) and first-degree family history of BC to unaffected patients in the benign biopsy cohort. FFPE specimens were analyzed for all patients with the custom NanoString CodeSet. Due to the poor cellularity of archived FFPE breast tissue, analyzable tissue-based assays were obtained for only 35 benign (unaffected) controls and 17 benign pre-cancer (affected) tissue specimens in addition to 28 malignant tissue specimens from the affected subjects (Figure 3). In total, 52 analyzable benign specimens with sufficient RNA were obtained for evaluation of MR signature (35 unaffected, 17 affected). Twenty-eight malignant tissue specimens were also included for comparison. Kruskal-Wallis rank sum test confirmed a difference between the three groups (Figure 4). As expected, benign control tissue (n=35) and malignant tissue (n=28) had the lowest and highest (p<0.001) expression of the MR signature, respectively. Affected pre-cancer tissue (n=17) demonstrated an elevated predicted MR score compared to benign tissue (p=0.09). This demonstrates that the NanoString platform can be used to distinguish between histologically normal and abnormal tissue and suggests that it can potentially identify molecularly abnormal tissue. These trends support our hypothesis that there is a difference in gene expression in tissue at risk for cancer transformation due to molecular abnormalities. Repeat analysis using data from NanoStringDiff demonstrated very similar results (Supplemental Figure 5).
Figure 3: CONSORT diagram of Validation Set Subjects.
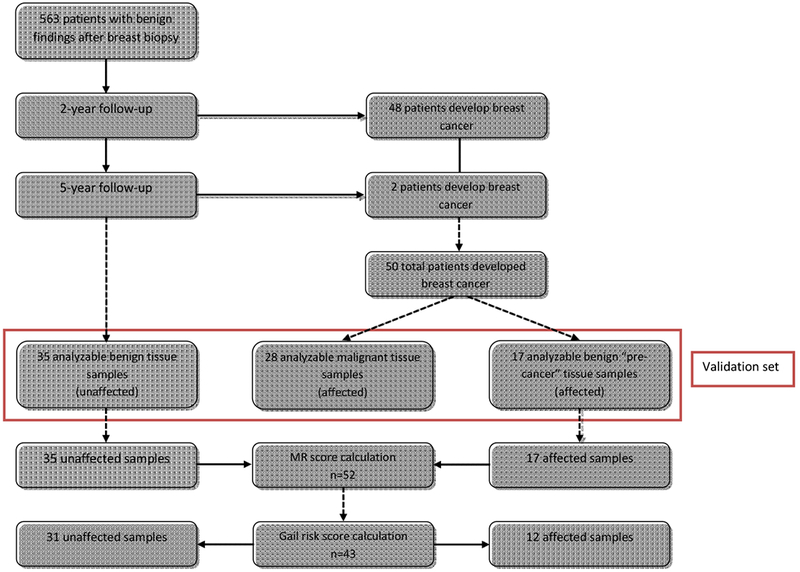
Abbreviations: MR = malignancy risk.
Figure 4: Comparison of MR score among unaffected, affected, and malignant samples.
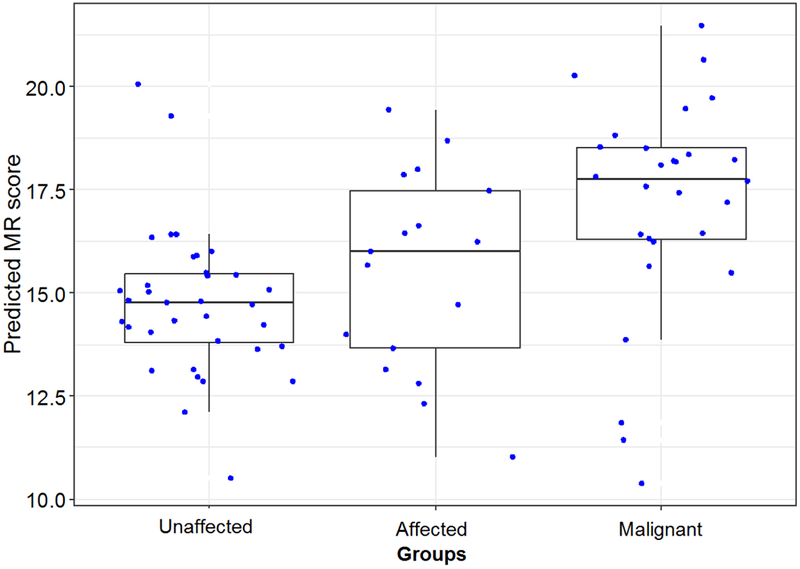
Abbreviations: unaffected = patients that do not develop breast cancer after initial benign biopsy; affected = patients that developed breast cancer after initial benign biopsy during follow up; malignant = patients diagnosed with breast cancer on initial biopsy; MR = malignancy risk.
Comparison of MR gene signature and Gail Model risk estimation
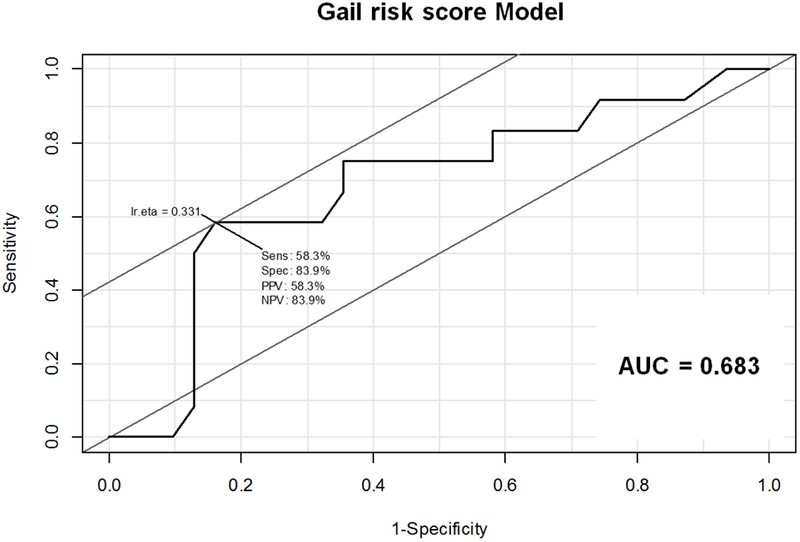
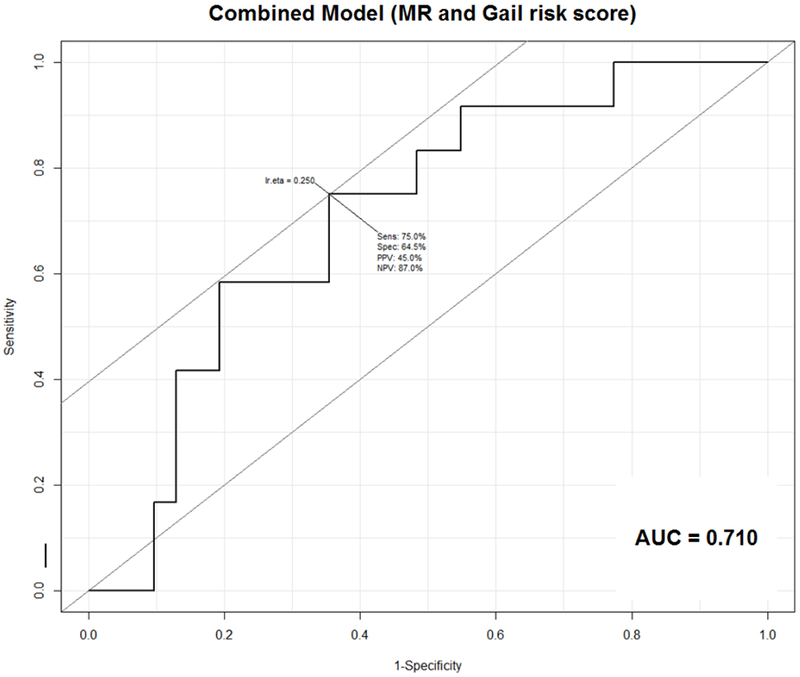
For the 52 patients with analyzable benign tissue specimens, we performed a retrospective review of the EMR to obtain information to calculate breast cancer risk by the BCRAT (Gail risk score). Sufficient information to calculate the Gail risk score was obtained for 43/52 subjects (31/35 unaffected and 12/17 affected). Therefore, the MR score-alone model was used for all 52 benign biopsy specimens (Figure 3). Supplemental Table 2 summarizes clinicopathologic characteristics of the 52 patients that provided these samples, including hormone receptor-status and histologic subtype of subsequent cancer in affected patients. The 43-patient subset with calculated Gail risk score was used alone and for the models combining MR score and Gail risk score. Neither the MR alone (p=0.19) nor the Gail Model prediction alone (p=0.13) reached statistical significance, with AUC of 0.61 and 0.68, respectively (Figures 5A, B). The model combining the MR and Gail risk scores had the best prediction (AUC=0.71; Figure 5C). Repeat analysis using data from NanoStringDiff demonstrated similar results (Supplemental Figure 6).
Figure 5: Receiver Operating Characteristic (ROC) curves for (A) MR score, (B) Gail risk score, and (C) combined MR and Gail risk scores.
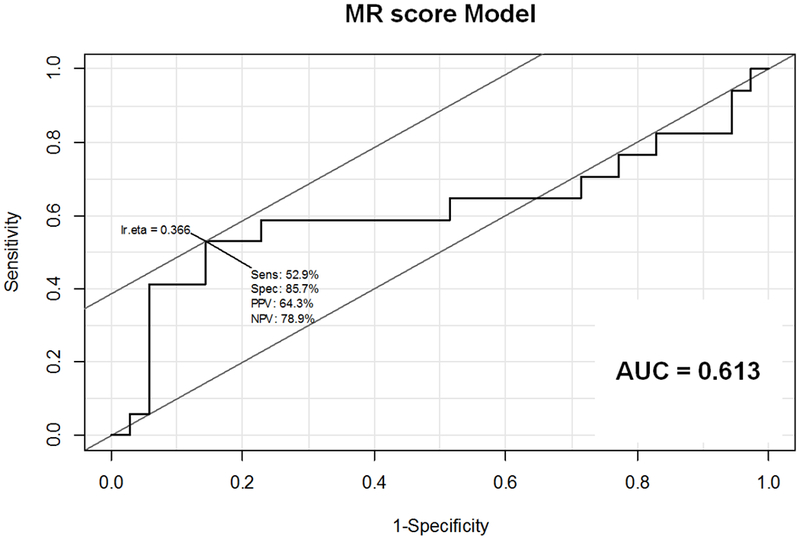
A. ROC curve for MR score Model. Sensitivity 52.9%, Specificity 85.7%, PPV 64.3%, NPV 78.9%, AUC=0.613
B. ROC curve for Gail risk score Model. Sensitivity 58.3%, Specificity 83.9%, PPV 58.3%, NPV 83.9%, AUC=0.683
C. ROC curve for combined MR and Gail risk score Model. Sensitivity 75%, Specificity 64.5%, PPV 45%, NPV 87%, AUC=0.710
Abbreviations: AUC = area under the curve; NPV = negative predictive value; PPV = positive predictive value; Sens = sensitivity; Spec = specificity
The results were rechecked using support vector machine (SVM), which showed that affected patients tended to have higher MR or Gail risk scores (Figure 6). SVM yielded a sensitivity of 83% (10/12), a specificity of 65% (20/31), a positive predictive value of 48% (10/21) and a negative predictive value of 91% (20/22) for the combination of MR and Gail risk score combined. The 10-fold cross-validation over 1,000 times yielded a median accuracy rate of 58% (95% CI 48-67%).
Figure 6: Support vector machine (SVM) prediction of MR score + Gail risk score with confusion matrix generated from SVM plot.
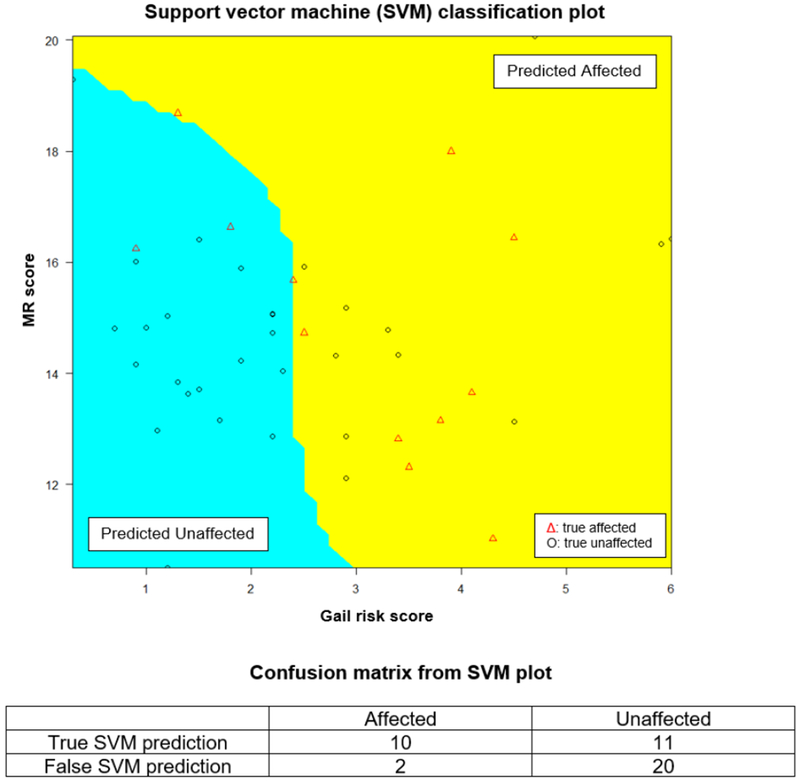
Abbreviations: unaffected = patients that do not develop breast cancer after initial benign biopsy; affected = patients that developed breast cancer after initial benign biopsy during follow up; MR = malignancy risk.
Discussion:
Breast cancer risk estimation continues to evolve with the advances in gene expression and germline mutation testing. It is important to distinguish, first and foremost, that germline DNA testing (genetic testing) for breast cancer risk generates a quantifiable cancer risk assessment which is completely separate from the risk categorizations generated by other predictive models; these mutations often confer increased risk for breast cancer as well as other malignancies, but are only identified in about 2% of the general population and 10% of the breast cancer population (17–19). The presence of a deleterious germline mutation may warrant similar clinical recommendations for breast cancer surveillance, risk reduction, or prophylaxis, but do not evaluate gene expression in breast tissue and are otherwise outside the scope of this discussion.
There are numerous predictive models of breast cancer employing different approaches to estimating breast cancer risk in the general non-mutation carrier population. Risk assessment tools can be separated into three general categories; models that estimate breast cancer risk, models that estimate the risk of germline mutations, and models that estimate both (20). The methodology behind the estimation of breast cancer development determines whether the model can be applied to the general population and the type of information provided by the model. Accurate determination of breast cancer risk is valuable, both in establishing preventative surveillance or treatment, but also in avoiding unnecessary medical or surgical overtreatment.
Models that estimate genetic risk are prevalent and incorporate risk factors predictive of BRCA1 and BRCA2 mutations. Some, like the MYRIAD model only estimate the probability of BRCA1 and/or BRCA2 mutations (21–23). Other models, like BRCAPRO (24, 25), BOADICEA (26) and the Tyrer-Cuzick model (27) predict both risk of germline mutation as well as risk of breast cancer development. While these models provide invaluable information in counseling and treating high-risk patients, they provide a different approach to breast cancer risk estimation than the model we propose.
Models that estimate breast cancer risk only incorporate known risk factors such as family and reproductive and/or biopsy histories to generate empiric regression models, including the Gail Model. Newer models also incorporate modifiable risk factors, such as models proposed by Maas and Petracci et al (28, 29). The Chen and Tice models also include mammographic breast density to increase risk estimation (30, 31). We propose a model that is a more accurate measurement of breast cancer risk because it utilizes objective data from a benign breast biopsy unique to each patient.
The Gail Model, introduced in 1989, was the first validated predictive model for estimation of breast cancer (2). It studied white women who received annual breast screening examinations as part of the Breast Cancer Detection Demonstration Project (BCDDP) from 1973 to 1980. Women that developed invasive or in situ ductal carcinoma in this time period were matched to women who did not receive recommendation for breast biopsy. A composite risk score was calculated from the four assessed risk factors.
Costantino and colleagues performed a validation study of the original Gail Model, which they referred to as model 1 (2, 3). A modification of model 1 was created, named model 2, to only include invasive breast cancer by substituting rates of invasive breast cancer from the Surveillance, Epidemiology and End Results (SEER) database in place of the incidence rates from the BCDDP used in model 1. Model 2 was applied to a new population of patients studied in the Breast Cancer Prevention Trial (BCPT) to estimate five-year breast cancer risk. Overall, the ratio of expected to observed cases of breast cancer was 1.03, indicating good calibration in the studied population. Several other validation studies have been conducted, utilizing different populations, that ultimately conclude that the Gail Model accurately predicts breast cancer risk in women that are regularly screened (8, 32, 33).
Rockhill and colleagues applied model 2 to the Nurses’ Health Study population, to assess the calibration as well as discriminatory accuracy (8). Patients were also followed for five years. They also obtained an expected to observed ratio of 1.03 as in the study by Costantino. In terms of individual discriminatory accuracy, Rockhill and colleagues obtained a concordance statistic of 0.58, barely better than chance. This is explained by the relatively low relative risk associated with the factors assessed in the Gail Model, such that the model can only be generally applied to the population at large, but cannot be specifically used at an individual level.
In contrast, a gene-expression based assay is highly individualized. Our prior work supports the idea that the expression of proliferative genes in histologically-normal but molecularly-abnormal can be identified in tissue that ultimately becomes a malignancy and used to predict cancer transformation well before it occurs (10). This demonstrates that valuable clinical information can be obtained from a benign biopsy. We successfully demonstrated the feasibility of using FFPE gene expression assays to develop a personalized, predictive test for breast cancer risk. We utilized benign biopsy tissue that correlated extremely well with FF tissue, which is important to its general applicability, as FFPE is the standard for archiving tissue. While our model successfully differentiated between benign and proven malignant tissue, we did not achieve statistically significant results when comparing benign tissue from unaffected patients to benign tissue from affected patients. We identified a trend towards higher predicted MR score in benign tissue from affected patients, which was likely limited by low sample size in our experiments.
Our approach is unique from other predictive models of breast cancer that are based on statistical estimations of risk. The application of gene expression analysis to breast cancer has primarily been applied to prognostication of diagnosed breast cancer, such as Oncotype DX® and MammaPrint™. Both tests utilize gene expression profiling to generate prognostic information. Oncotype DX® is a 21-gene recurrence score stratifying patients into low, moderate or high risk of recurrence. It has been validated to provide risk stratification for both locoregional and distant recurrence (34, 35). While this test is limited to hormone receptor-positive, node-negative breast cancers, it now plays a significant role in guiding adjuvant chemotherapy in these patients.33 MammaPrint™ determines expression of the gene signature in the patients’ tumor and calculates a binary score of high or low risk for breast cancer metastasis. Both of these tests assist in assessing benefit of adjuvant chemotherapy after a diagnosis of breast cancer utilizing tissue obtained from surgical resection (36, 37). Follow-up studies have demonstrated changes in medical decision making on the basis of these tests, and Oncotype DX has been associated with cost-reduction in the treatment of breast cancer (37).
Currently, there are no validated or approved tests to identify differences in gene expression in histologically normal tissue that becomes malignant, yet many studies have demonstrated this ability (10, 38–40). The value of these tests, as previously discussed, will allow for earlier recognition of patients at highest risk for malignancy and focus treatment to those it will benefit the most; our assay falls into this category of risk evaluation. Because these assays apply to unaffected women, the impact of this test on the female population is much higher than cancer-directed prognostic indicators.
Our study was limited by low sample sizes. The scant cellularity of FFPE tissue in benign tissue did not allow for sufficient FFPE NanoString samples to be analyzed, limiting the utility of the MR score alone. Despite this, the combination of the MR score with the Gail Model demonstrated improved predictive capability of either test alone. Further investigation is warranted with the MR score. Our plans for future application in prospectively collected tissue will allow for accurate analysis prior to tissue degradation from long-term storage.
Conclusion:
In the era of personalized medicine, we propose a method to calculate personalized breast cancer risk based on benign breast biopsy specimen that can be performed at any institution that utilizes FFPE tissue. The implications of such a test will greatly impact the management of patients, allowing for earlier diagnosis and focused treatment for patients that will benefit the most, while also reducing the number of patients who do not need prophylactic treatment.
Supplementary Material
Supplemental Figure 1: Expression of the 56 genes used to derive the Malignancy Risk gene signature
Caption: The NanoString MR signature was derived from 56 genes. Each individual gene expression was compared between benign, benign “pre-cancer” and malignant samples and visualized by boxplots. The P-value was obtained from Kruskal-Wallis rank sum test.
Abbreviations: Control = patients who do not develop breast cancer; Pre_case = patients that develop breast cancer; Case = patients with confirmed malignancy.
Supplemental Figure 2: Correlation between RNA input amounts and successful NanoString assay within and between FF/FFPE specimens
Supplemental Figure 3: Correlation of MR score for the 28 paired samples using normalized data from NanoStringDiff method
Abbreviations: FFPE = formalin-fixed paraffin-embedded; FF = fresh frozen; MR = malignancy risk score; PC1 = first principal component; MR_PC1_FFPE_T = PC1 loading coefficients of tumor specimen from FFPE; MR_PC1_FFPE_N = PC1 loading coefficients of benign specimen from FFPE; MR_PC1_FF_T = PC1 loading coefficients of tumor specimen from FF tissue; MR_PC1_FF_N = PC1 loading coefficients of benign specimen from FF tissue
Supplemental Figure 4: Correlation of PC1 loading coefficients between FFPE and FF specimens using normalized data from NanoStringDiff method (n=137)
Abbreviations: FFPE = formalin-fixed paraffin-embedded; FF = fresh frozen;
Supplemental Figure 5: Comparison of MR score among unaffected, affected and malignant samples using normalized data from NanoStringDiff method
Abbreviations: unaffected = patients that do not develop breast cancer after initial benign biopsy; affected = patients that developed breast cancer after initial benign biopsy during follow up; malignant = patients diagnosed with breast cancer on initial biopsy; MR = malignancy risk;
Supplemental Figure 6: Receiver Operating Characteristic curves for (A) MR score, (B) Gail risk score and (C) combined MR and Gail risk scores using normalized data from NanoStringDiff method
A. ROC curve for MR score Model. Sensitivity 52.9%, Specificity 77.1%, PPV 52.9%, NPV 77.1%, AUC=0.610
B. ROC curve for Gail risk score Model. Sensitivity 58.3%, Specificity 83.9%, PPV 58.3%, NPV 83.9%, AUC=0.683
C. ROC curve for combined MR and Gail risk score Model. Sensitivity 75%, Specificity 67.7%, PPV 47.4%, NPV 87.5%, AUC=0.707
Abbreviations: AUC = area under the curve; NPV = negative predictive value; PPV = positive predictive value; Sens = sensitivity; Spec = specificity
Supplemental Table 1: Difference in expression of 56 malignancy risk signature genes between benign and malignant specimens by NanoStringDiff method
Supplemental Table 2: Summary of clinicopathologic characteristics of patients in study cohort
Synopsis:
Evaluation of a gene expression-based assay on FFPE to quantify breast cancer risk in women after benign biopsy. The predictive value of our Malignancy Risk score was limited by poor cellularity of benign breast samples, however the combination of Malignancy Risk score and Gail risk score provided more accurate risk assessment than either alone.
Acknowledgements:
This work was supported in part by the Tissue Core and Molecular Genomics Core Facilities and the Biostatistics and Bioinformatics Shared Resource at the Moffitt Cancer Center, an NCI designated Comprehensive Cancer Center (P30-CA076292).
Disclosure:
Disclosure statement: The authors report no proprietary or commercial interest in any product mentioned or concept discussed in this article. The Malignancy-Risk signature patent (#9195796) is owned by Moffitt Cancer Center. This work was supported by the National Cancer Institute (NCI) R21-CA198762-02 at Moffitt Cancer Center, Tampa, FL. M.C.L also currently receives support from the Department of Defense (W81XWH-16-1-0385) and NCI (1P20-CA202920-01A1).
Footnotes
Publisher's Disclaimer: This is a PDF file of an unedited manuscript that has been accepted for publication. As a service to our customers we are providing this early version of the manuscript. The manuscript will undergo copyediting, typesetting, and review of the resulting proof before it is published in its final citable form. Please note that during the production process errors may be discovered which could affect the content, and all legal disclaimers that apply to the journal pertain.
Presented in part at the 14th Annual Academic Surgical Congress, Houston, TX (February 7, 2019) and the Florida Chapter American College of Surgeons Commission on Cancer, Orlando, FL (March 23, 2019)
References:
- 1.Singletary SE. Rating the risk factors for breast cancer. Ann Surg. 2003. April;237(4):474–82. [DOI] [PMC free article] [PubMed] [Google Scholar]
- 2.Gail MH, Brinton LA, Byar DP, et al. Projecting individualized probabilities of developing breast cancer for white females who are being examined annually. J Natl Cancer Inst. 1989. December 20;81(24):1879–86. [DOI] [PubMed] [Google Scholar]
- 3.Costantino JP, Gail MH, Pee D, et al. Validation studies for models projecting the risk of invasive and total breast cancer incidence. J Natl Cancer Inst. 1999. September 15;91(18): 1541–8. [DOI] [PubMed] [Google Scholar]
- 4.Gail MH, Costantino JP, Pee D, et al. Projecting individualized absolute invasive breast cancer risk in African American women. J Natl Cancer Inst. 2007. December 5;99(23):1782–92. [DOI] [PubMed] [Google Scholar]
- 5.Matsuno RK, Costantino JP, Ziegler RG, et al. Projecting individualized absolute invasive breast cancer risk in Asian and Pacific Islander American women. J Natl Cancer Inst. 2011. June 22;103(12):951–61. [DOI] [PMC free article] [PubMed] [Google Scholar]
- 6.Banegas MP, John EM, Slattery ML, et al. Projecting Individualized Absolute Invasive Breast Cancer Risk in US Hispanic Women. J Natl Cancer Inst. 2017. February;109(2). [DOI] [PMC free article] [PubMed] [Google Scholar]
- 7.Elmore JG, Fletcher SW. The risk of cancer risk prediction: “What is my risk of getting breast cancer”? J Natl Cancer Inst. 2006. December 6;98(23): 1673–5. [DOI] [PubMed] [Google Scholar]
- 8.Rockhill B, Spiegelman D, Byrne C, Hunter DJ, Colditz GA. Validation of the Gail et al. model of breast cancer risk prediction and implications for chemoprevention. J Natl Cancer Inst. 2001. March 7;93(5):358–66. [DOI] [PubMed] [Google Scholar]
- 9.Weaver DL, Rosenberg RD, Barlow WE, et al. Pathologic findings from the Breast Cancer Surveillance Consortium: population-based outcomes in women undergoing biopsy after screening mammography. Cancer. 2006. February 15;106(4):732–42. [DOI] [PubMed] [Google Scholar]
- 10.Chen DT, Nasir A, Culhane A, et al. Proliferative genes dominate malignancy-risk gene signature in histologically-normal breast tissue. Breast Cancer Res Treat. 2010. January;119(2):335–46. [DOI] [PMC free article] [PubMed] [Google Scholar]
- 11.Chen DT, Hsu YL, Fulp WJ, et al. Prognostic and predictive value of a malignancy-risk gene signature in early-stage non-small cell lung cancer. J Natl Cancer Inst. 2011. December 21;103(24):1859–70. [DOI] [PMC free article] [PubMed] [Google Scholar]
- 12.Using the nCounter® Analysis System with FFPE Samples for Gene Expression Analysis. NanoString Technologies; 2012.
- 13.Johnson WE, Li C, Rabinovic A. Adjusting batch effects in microarray expression data using empirical Bayes methods. Biostatistics. 2007. January;8(1):118–27. [DOI] [PubMed] [Google Scholar]
- 14.Wang H, Horbinski C, Wu H, et al. NanoStringDiff: a novel statistical method for differential expression analysis based on NanoString nCounter data. Nucleic Acids Res. 2016. November;44(20). [DOI] [PMC free article] [PubMed] [Google Scholar]
- 15.Chen DT, Nasir A, Venkataramu C, Fulp W, Gruidl M, Yeatman T. Evaluation of malignancy-risk gene signature in breast cancer patients. Breast Cancer Res Treat. 2010. February;120(1):25–34. [DOI] [PMC free article] [PubMed] [Google Scholar]
- 16.Poola I, DeWitty RL, Marshalleck JJ, Bhatnagar R, Abraham J, Leffall LD. Identification of MMP-1 as a putative breast cancer predictive marker by global gene expression analysis. Nat Med. 2005. May;11(5):481–3. [DOI] [PubMed] [Google Scholar]
- 17.Thompson D, Easton D. The genetic epidemiology of breast cancer genes. J Mammary Gland Biol Neoplasia. 2004. July;9(3):221–36. [DOI] [PubMed] [Google Scholar]
- 18.Couch FJ, Shimelis H, Hu C, et al. Associations Between Cancer Predisposition Testing Panel Genes and Breast Cancer. JAMA Oncol. 2017. September 1;3(9):1190–6. [DOI] [PMC free article] [PubMed] [Google Scholar]
- 19.Tung N, Lin NU, Kidd J, et al. Frequency of Germline Mutations in 25 Cancer Susceptibility Genes in a Sequential Series of Patients With Breast Cancer. J Clin Oncol. 2016. May 1;34(13):1460–8. [DOI] [PMC free article] [PubMed] [Google Scholar]
- 20.Cintolo-Gonzalez JA, Braun D, Blackford AL, et al. Breast cancer risk models: a comprehensive overview of existing models, validation, and clinical applications. Breast Cancer Res Treat. 2017. July;164(2):263–84. [DOI] [PubMed] [Google Scholar]
- 21.Shattuck-Eidens D, Oliphant A, McClure M, et al. BRCA1 sequence analysis in women at high risk for susceptibility mutations. Risk factor analysis and implications for genetic testing. JAMA. 1997. October 15;278(15):1242–50. [PubMed] [Google Scholar]
- 22.Frank TS, Manley SA, Olopade OI, et al. Sequence analysis of BRCA1 and BRCA2: correlation of mutations with family history and ovarian cancer risk. J Clin Oncol. 1998. July;16(7):2417–25. [DOI] [PubMed] [Google Scholar]
- 23.Frank TS, Deffenbaugh AM, Reid JE, et al. Clinical characteristics of individuals with germline mutations in BRCA1 and BRCA2: analysis of 10,000 individuals. J Clin Oncol. 2002. March 15;20(6):1480–90. [DOI] [PubMed] [Google Scholar]
- 24.Berry DA, Parmigiani G, Sanchez J, Schildkraut J, Winer E. Probability of carrying a mutation of breast-ovarian cancer gene BRCA1 based on family history. J Natl Cancer Inst. 1997. February 5;89(3):227–38. [DOI] [PubMed] [Google Scholar]
- 25.Berry DA, Iversen ES Jr, Gudbjartsson DF, et al. BRCAPRO validation, sensitivity of genetic testing of BRCA1/BRCA2, and prevalence of other breast cancer susceptibility genes. J Clin Oncol. 2002. June 1;20(11):2701–12. [DOI] [PubMed] [Google Scholar]
- 26.Antoniou AC, Cunningham AP, Peto J, et al. The BOADICEA model of genetic susceptibility to breast and ovarian cancers: updates and extensions. Br J Cancer. 2008. April 22;98(8):1457–66. [DOI] [PMC free article] [PubMed] [Google Scholar]
- 27.Tyrer J, Duffy SW, Cuzick J. A breast cancer prediction model incorporating familial and personal risk factors. Stat Med. 2004. April 15;23(7): 1111–30. [DOI] [PubMed] [Google Scholar]
- 28.Maas P, Barrdahl M, Joshi AD, et al. Breast Cancer Risk From Modifiable and Nonmodifiable Risk Factors Among White Women in the United States. JAMA Oncol. 2016. October 1;2(10):1295–302. [DOI] [PMC free article] [PubMed] [Google Scholar]
- 29.Petracci E, Decarli A, Schairer C, et al. Risk factor modification and projections of absolute breast cancer risk. J Natl Cancer Inst. 2011. July 6;103(13):1037–48. [DOI] [PMC free article] [PubMed] [Google Scholar]
- 30.Chen J, Pee D, Ayyagari R, et al. Projecting absolute invasive breast cancer risk in white women with a model that includes mammographic density. J Natl Cancer Inst. 2006. September 6;98(17):1215–26. [DOI] [PubMed] [Google Scholar]
- 31.Tice JA, Cummings SR, Smith-Bindman R, Ichikawa L, Barlow WE, Kerlikowske K. Using clinical factors and mammographic breast density to estimate breast cancer risk: development and validation of a new predictive model. Ann Intern Med. 2008. March 4;148(5):337–47. [DOI] [PMC free article] [PubMed] [Google Scholar]
- 32.Bondy ML, Lustbader ED, Halabi S, Ross E, Vogel VG. Validation of a breast cancer risk assessment model in women with a positive family history. J Natl Cancer Inst. 1994. April 20;86(8):620–5. [DOI] [PubMed] [Google Scholar]
- 33.Spiegelman D, Colditz GA, Hunter D, Hertzmark E. Validation of the Gail et al. model for predicting individual breast cancer risk. J Natl Cancer Inst. 1994. April 20;86(8):600–7. [DOI] [PubMed] [Google Scholar]
- 34.Mamounas EP, Tang G, Fisher B, et al. Association between the 21-gene recurrence score assay and risk of locoregional recurrence in node-negative, estrogen receptor-positive breast cancer: results from NSABP B-14 and NSABP B-20. J Clin Oncol. 2010. April 1;28(10):1677–83. [DOI] [PMC free article] [PubMed] [Google Scholar]
- 35.Paik S, Shak S, Tang G, et al. A multigene assay to predict recurrence of tamoxifen-treated, node-negative breast cancer. N Engl J Med. 2004. December 30;351(27):2817–26. [DOI] [PubMed] [Google Scholar]
- 36.National Comprehensive Cancer Network Clinical Practice Guidelines in Oncology, Cutaneous Melanoma version 2.2019. 2019. [DOI] [PubMed]
- 37.Gupta A, Mutebi M, Bardia A. Gene-Expression-Based Predictors for Breast Cancer. Ann Surg Oncol. 2015. October;22(11):3418–32. [DOI] [PubMed] [Google Scholar]
- 38.Finak G, Sadekova S, Pepin F, et al. Gene expression signatures of morphologically normal breast tissue identify basal-like tumors. Breast Cancer Res. 2006;8(5):R58. [DOI] [PMC free article] [PubMed] [Google Scholar]
- 39.Graham K, Ge X, de Las Morenas A, Tripathi A, Rosenberg CL. Gene expression profiles of estrogen receptor-positive and estrogen receptor-negative breast cancers are detectable in histologically normal breast epithelium. Clin Cancer Res. 2011. January 15;17(2):236–46. [DOI] [PMC free article] [PubMed] [Google Scholar]
- 40.Tripathi A, King C, de la Morenas A, et al. Gene expression abnormalities in histologically normal breast epithelium of breast cancer patients. Int J Cancer. 2008. April 1;122(7):1557–66. [DOI] [PubMed] [Google Scholar]
Associated Data
This section collects any data citations, data availability statements, or supplementary materials included in this article.
Supplementary Materials
Supplemental Figure 1: Expression of the 56 genes used to derive the Malignancy Risk gene signature
Caption: The NanoString MR signature was derived from 56 genes. Each individual gene expression was compared between benign, benign “pre-cancer” and malignant samples and visualized by boxplots. The P-value was obtained from Kruskal-Wallis rank sum test.
Abbreviations: Control = patients who do not develop breast cancer; Pre_case = patients that develop breast cancer; Case = patients with confirmed malignancy.
Supplemental Figure 2: Correlation between RNA input amounts and successful NanoString assay within and between FF/FFPE specimens
Supplemental Figure 3: Correlation of MR score for the 28 paired samples using normalized data from NanoStringDiff method
Abbreviations: FFPE = formalin-fixed paraffin-embedded; FF = fresh frozen; MR = malignancy risk score; PC1 = first principal component; MR_PC1_FFPE_T = PC1 loading coefficients of tumor specimen from FFPE; MR_PC1_FFPE_N = PC1 loading coefficients of benign specimen from FFPE; MR_PC1_FF_T = PC1 loading coefficients of tumor specimen from FF tissue; MR_PC1_FF_N = PC1 loading coefficients of benign specimen from FF tissue
Supplemental Figure 4: Correlation of PC1 loading coefficients between FFPE and FF specimens using normalized data from NanoStringDiff method (n=137)
Abbreviations: FFPE = formalin-fixed paraffin-embedded; FF = fresh frozen;
Supplemental Figure 5: Comparison of MR score among unaffected, affected and malignant samples using normalized data from NanoStringDiff method
Abbreviations: unaffected = patients that do not develop breast cancer after initial benign biopsy; affected = patients that developed breast cancer after initial benign biopsy during follow up; malignant = patients diagnosed with breast cancer on initial biopsy; MR = malignancy risk;
Supplemental Figure 6: Receiver Operating Characteristic curves for (A) MR score, (B) Gail risk score and (C) combined MR and Gail risk scores using normalized data from NanoStringDiff method
A. ROC curve for MR score Model. Sensitivity 52.9%, Specificity 77.1%, PPV 52.9%, NPV 77.1%, AUC=0.610
B. ROC curve for Gail risk score Model. Sensitivity 58.3%, Specificity 83.9%, PPV 58.3%, NPV 83.9%, AUC=0.683
C. ROC curve for combined MR and Gail risk score Model. Sensitivity 75%, Specificity 67.7%, PPV 47.4%, NPV 87.5%, AUC=0.707
Abbreviations: AUC = area under the curve; NPV = negative predictive value; PPV = positive predictive value; Sens = sensitivity; Spec = specificity
Supplemental Table 1: Difference in expression of 56 malignancy risk signature genes between benign and malignant specimens by NanoStringDiff method
Supplemental Table 2: Summary of clinicopathologic characteristics of patients in study cohort


