Abstract
Introduction
Evidence suggests treatments guided by brain oxygen levels improve patient outcomes following severe traumatic brain injury; however, brain oxygen levels are not routinely monitored as an effective non-invasive method has not been established. We undertook a study, in a sheep model of acute brain injury, to assess a new non-invasive brain oximeter. The monitor uses the principles of pulse oximetry to record a pulse and oxygen levels.
Methods
We studied 8 sheep. An acute increase in intracranial pressure was induced with an injection of blood into the cranial vault. The temporal changes in the brain oximeter, intracranial pressure and cerebral perfusion pressure were recorded. Simultaneous conventional skin pulse oximetry was also recorded to assess the possible influence of skin blood flow on the brain oximeter signal.
Results
At baseline, a pulsatile waveform consistent with the brain circulation was obtained in 7 animals. The baseline brain pulse was quite distinct from the simultaneous conventional skin pulse and similar in shape to a central venous pressure waveform. Injection of blood into the cranial vault triggered an immediate increase in intracranial pressure and fall in cerebral perfusion pressure, by 60-s cerebral perfusion pressure recovered. The brain oximeter oxygen levels demonstrated similar changes with an immediate fall and recovery by 60 s. Periods of high intracranial pressure were also associated with high-frequency oscillations in the brain pulse waveform; there was, however, no change in the conventional skin pulse oximeter pulse waveform.
Conclusion
The brain oximeter detected acute changes in both oxygen levels and the brain pulse waveform following an increase in intracranial pressure levels. The brain oximeter could assist clinicians in the management of acute brain injury.
Keywords: oximetry, traumatic brain injury, brain, sheep
Video abstract
Point your SmartPhone at the code above. If you have a QR code reader the video abstract will appear. Or use:
Plain Language Statement
Following severe brain injury, low oxygen levels commonly develop in the brain and if not recognized and treated early can cause permanent brain damage. Unfortunately, there are no simple methods available to monitor the brain, and therefore this complication is commonly recognized late.
We, therefore, developed a simple non-invasive method to monitor brain oxygen levels. We used a sheep model of acute brain injury to assess the monitor. We found that the monitor detected periods of low blood flow in the brain that are the cause of low oxygen levels. The brain monitor could assist clinicians in the early detection and treatment of low brain oxygen levels to improve patient’s long-term recovery.
Introduction
Following severe traumatic brain injury (TBI), around 55% of patients develop a secondary brain injury in the minutes, hours, days or even weeks after the initial injury. The secondary brain injury is typically due to hypoxia, as a result of intracranial bleeding, brain swelling, hydrocephalus or low blood pressure.1,2 Evidence is emerging that early detection and treatment of brain hypoxia improves patient outcomes.3,4
Monitoring of the brain following TBI remains problematic. Currently, monitoring depends on invasive techniques such as intracranial pressure (ICP) catheters, intraparenchymal oxygen sensors and jugular bulb venous catheters. These approaches carry risks, are technically challenging, are expensive, may still not detect hypoxic complications and cannot provide monitoring from the point of trauma till hospital discharge.2,4,5 Furthermore, non-invasive monitors of brain oxygen levels, such as cerebral oximeters, have failed to demonstrate consistent results, due to blood flow in the skin contaminating the signal.6,7 Current guidelines do not recommend their use.8–10
To address these limitations, we developed a novel non-invasive brain oximeter, based on the principles of pulse oximetry, designed to detect the brain pulse and measure brain oxygen levels. We undertook a study to assess the monitor in a sheep model of acute brain injury.
The aims of the study were first to assess whether the brain oximeter detected changes in brain oxygen levels following an acute increase in intracranial pressure and second to assess whether blood flow and oxygen levels in the skin were a potential source of error.
Materials and Methods
The study was approved by the South Australian Health and Medical Research Institute Animal Ethics Committee and conducted according to guidelines established for the use of animals in experimental research as outlined by the National Health and Medical Research Council code of practice for the care and use of animals for scientific purposes (8th edition, 2013).
The Monitor
The brain oximeter utilizes wavelengths in the near infra-red (NIR) range 660 and 895 nm and uses the principles of pulse oximetry to detect the pulsatile changes in the optical signal.11 Conventional pulse oximeters derive blood oxygen levels by deriving the ratio of ratios (RR). The brain oximeter pulse waveform is quite distinct from the conventional skin pulse oximeter waveform; therefore, a new signal processing algorithm was developed to determine a modified RR (RRm). The RRm is measured throughout the entire cardiac cycle, during both systole and diastole, and the levels therefore represent the average microvascular oxygen level, not the arterial level.
The monitor is different from conventional cerebral oximeters in a number of ways. First, it monitors the pulsatile changes in the optical signal, this allows confirmation that the optical signal is arising from the brain and also provides a measure of relative changes in cerebral blood flow. The sensor is much smaller than a conventional cerebral oximeter and has design elements to minimize skin oxygen levels and blood flow influencing the signal, which is a major limitation of conventional cerebral oximeters.6,7
The oximeter was evaluated in 8 adult Merino sheep, average weight 49.5 kg, 5 were female, that were acclimatized for a minimum of 7 days prior to the commencement of the study. Animals were fasted overnight prior to the procedure and anaesthesia was induced with intravenous thiopentone (1000 mg in 20mL, Jurox Pty Ltd, Australia). Animals were intubated with a size 9 ET tube and maintained on inhalational isoflurane (1.5–3%; Veterinary Companies of Australia) with a mixture of oxygen and room air. Animals remained under general anaesthesia for the entire duration of the experiment. End-tidal CO2 was monitored. Arterial pulse oximetry saturations were maintained at ~100% throughout. An arterial catheter was placed in the right brachial artery or right carotid artery and fed into the aorta for continuous blood pressure monitoring. With the animal in the sphinx position, a 5-mm burr hole was drilled over the left hemisphere and a Codman ICP monitor (Codman & Shurtleff Inc., MA) inserted to an approximate depth of 15 mm, as previously described.12 The cerebral perfusion pressure (CPP) was calculated by subtracting the blood pressure from the ICP. A second burr hole was drilled in the frontal part of the sagittal sinus and a cannula placed to access venous blood gas samples. Venous blood gases from the sagittal sinus were analysed using a Rapid point 500 Siemens (Munich, Germany) blood gas analyser.13 Due to the technical difficulty in in placing the sagittal sinus catheter, samples could only be collected in one animal. The brain oximeter was placed on the shaved scalp, over the right brain hemisphere. To assess the potential influence of skin oxygen levels and blood flow on the brain oximeter signal, we simultaneously recorded the pulsatile waveform and oxygen levels from a conventional skin pulse oximeter placed on the skin of the nose (Covidien, Maxfast, USA).
Injection of Blood into the Cranial Vault
A third burr hole was drilled over the frontal lobe, and a spinal needle was inserted until it touched the bone at the base of the anterior cranial vault. The animal’s blood was aspirated from the arterial line and injected deep into the vault over ~5 s (4–6 mL’s per injection). Physiological recordings were undertaken for up to 5 mins following each injection. Five injections were undertaken. In one animal, saline was used for the last 4 injections, due to blood clotting prior to the injection.
Data Management
Pulse oximeter data output is based on the pulse rate rather than on time. To collate these data from multiple animals with different heart rates, we, therefore, averaged the pulse oximeter data over 5-s windows. In addition, as brain oxygen levels vary during the systolic and diastolic phases of the cardiac cycle, the data were averaged over the whole of each individual cardiac cycle, and therefore represent the average microvascular oxygen level, not the arterial level. We used the known relationship between RR and blood oxygen saturation (SO2), where SO2 = 110–25 (RR) to estimate blood oxygen saturation, as the exact correlation of RRm with blood oxygen levels is yet to be established.11 Exactly the same approach was used for the analysis of the conventional skin pulse oximeter data to ensure a meaningful comparison. The figures demonstrating the pulsatile changes in light intensity from the brain and skin pulse oximeters are presented, by convention, with the Y-axis (light intensity) inverted.
Statistical Analysis
Repeat measures analysis of variance was used to assess the effect of the injection of blood into the cranial vault on the simultaneous brain and skin oxygen level changes. The Mann Whitney U-test assessed the change in the pulse amplitude of the brain and skin pulse oximeters. Least squares linear regression was used to assess the correlation between the sagittal sinus and brain oximeter. Prism software (Version 8, Graph Pad Inc, San Diego, CA, USA).
Results
We studied 8 sheep. In one animal, the brain oximeter signal was inadequate for interpretation, due to a sensor interface problem with the scalp surface. This animal was a castrated male with a prominent horn bud. The results for 7 animals are therefore reported. BP data were available for all animals, but ICP data were available in 5 of the animals, due to technical problems. Sagittal sinus vein cannulation was successful in only 1 animal. In one animal, saline was used for the last 4 injections due to the aspirated blood clotting prior to injection. There was no difference in the responses between the saline and blood injections.
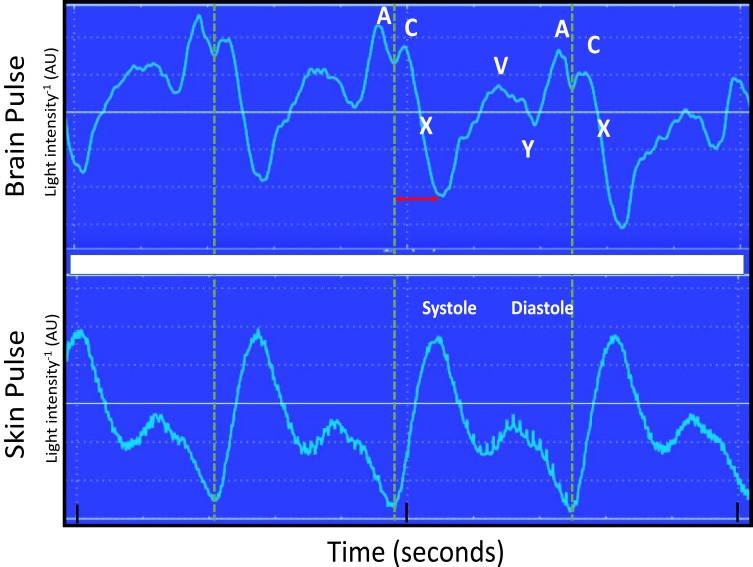
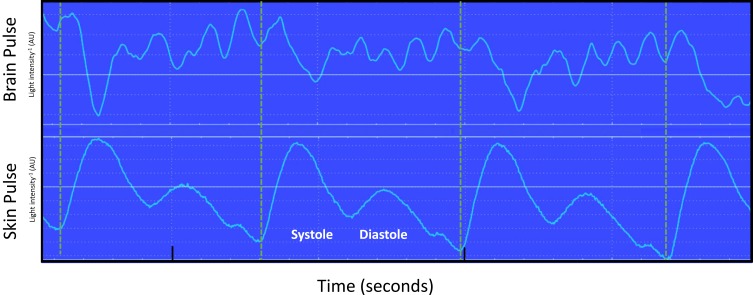
The baseline brain oximeter pulse waveform is demonstrated in Figure 1. It is distinct from the conventional skin pulse oximeter waveform, demonstrating features similar to the shape and timing of the pressure waveform seen in the central venous circulation, including A, C, X, V and Y waves. The start of the brain pulse was delayed relative to the simultaneous conventional skin pulse oximeter pulse, and the pulse peak signal was at the end of diastole.
Figure 1.
Simultaneous recording of the brain and conventional skin pulse oximetry waveforms in a single normal sheep brain. The dashed lines represent the start of the skin pulse. The brain and skin pulses were distinct, with the brain pulse demonstrating a waveform similar in shape and timing to a central venous pressure waveform, with A, C, X, V and Y waves, whereas the skin pulse demonstrated a waveform similar in shape and timing to an arterial pressure waveform. In addition, the start of the brain pulse was delayed relative to the skin pulse, by around 100 ms (arrow) and the peak of the pulse was at the end of diastole.
Abbreviation: AU, arbitrary units.
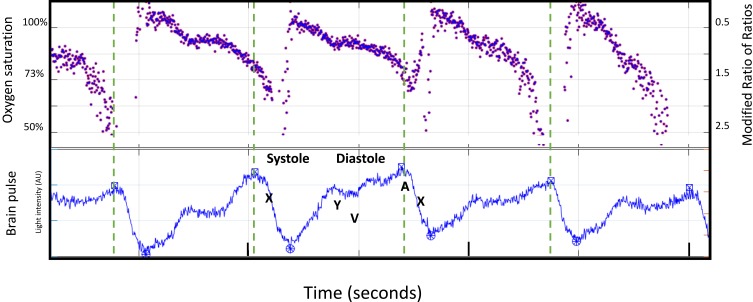
The brain oxygen saturation levels estimated by the RRm levels were not constant but varied with the systolic and diastolic phases. The oxygen level was highest during the systolic phase 100% and fell to ~60%, at the end-diastole, as shown in Figure 2. Conventional skin pulse oximetry oxygen levels remained relatively constant at ~100% throughout the cardiac cycle (data not shown).
Figure 2.
Simultaneous display of the modified ratio of ratios (RRm) and brain oximeter pulse waveform in a single normal animal. The blood oxygen saturation (SO2) and the modified ratio of ratios (right) (Y-axis). The dashed line demonstrates the start of each systole, indicated by the start of the X wave. Systole was temporally associated with a rapid increase in oxygen levels. Thereafter, levels fell during diastole. The lowest oxygen value was at the end of diastole.
Abbreviation: AU, arbitrary units.
Injection of Blood into Cranial Vault to Acutely Increase ICP
Intracranial Pressure Changes
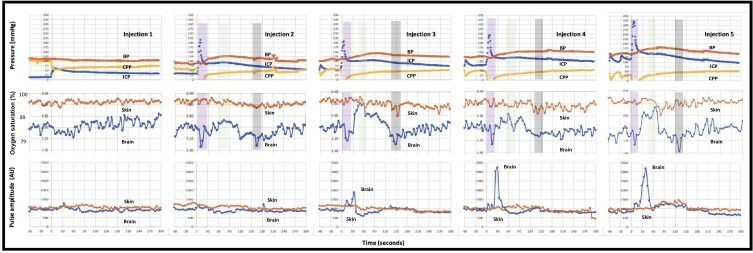
The temporal changes in intracranial, blood and cerebral perfusion pressures (CPP) following each of 5 sequential injections are presented in Figure 3, upper panel. Each of the injections caused an immediate increase in ICP and fall in CPP. Typically, by 60 s the CPP recovered, due to an increase in blood pressure and fall in the ICP. The extent of increase in ICP and the blood pressure response were greater for each subsequent injection.
Figure 3.
Responses to 5 sequential cranial vault injections of blood. Top panel: blood pressure (red), intracranial pressure (blue) and cerebral perfusion pressure (yellow). Each injection caused an immediate increase in the intracranial pressure (ICP) and drop in cerebral perfusion pressure (CPP). Blood pressure increased by 60 s and ICP fell, leading to a recovery in CPP. Middle panel: oxygen saturations and modified ratio of ratios (within figure Y axes) for brain (blue) and skin (orange) pulse oximeters. For the last 4 injections, the initial fall in CPP was also associated with a fall in brain oximeter oxygen levels (purple shading). The recovery in CPP was associated with a marked increase in brain oximeter oxygen levels (green shading). A second fall in brain oxygen levels (grey shading) occurred at ~150 s. Bottom panel: the brain oximeter pulse amplitude (blue) increased markedly, following the last 3 injections, but did not change with the skin pulse oximeter (orange). The oxygen saturation represents the average microvascular levels over the entire cardiac cycle. Pulse oximetry data represent the average for 7 sheep. The pressure data represent the average for 5 sheep. Each cranial vault injection commenced at time = 0.
Brain and Skin Oximeter Oxygen Levels and Pulse Amplitude Changes
The brain and skin oxygen and pulse amplitude responses following each of the 5 sequential injections are shown in Figure 3, middle and lower panels. The extent of the oscillations in the brain oxygen levels and the brain pulse amplitude were more marked for the later injections.
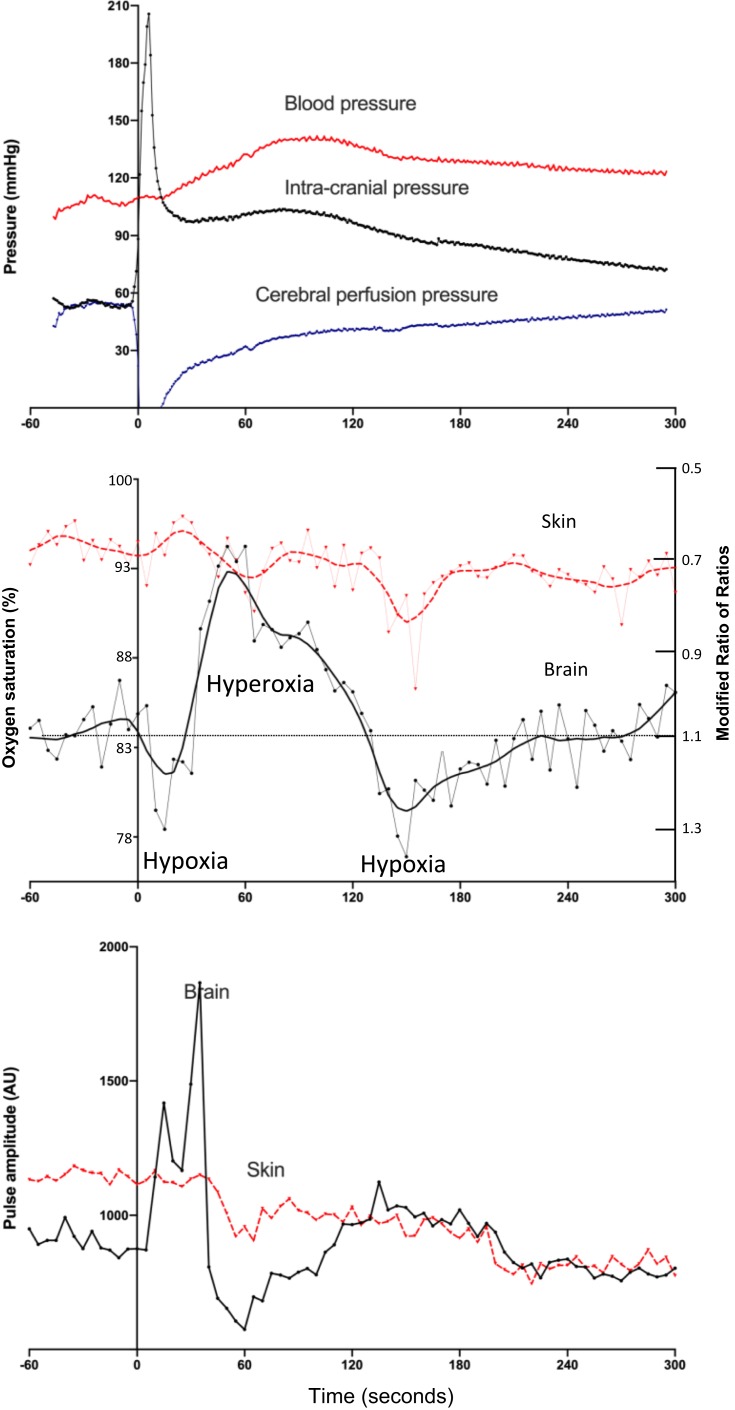
The typical changes are illustrated by the third intracranial injection which is presented in Figure 4. The injection caused an immediate increase in ICP. This was associated with an immediate fall in the CPP which was recovered by 60 s. The brain microvascular oxygen saturation before the third injection was 85%, which fell to 78% immediately following the injection, and by 60 s oxygen levels increased well above baseline levels to reach 94%. Brain oxygen levels fell a second time at ~150, seconds to 77% and recovered thereafter. Skin oxygen levels remained relatively stable. The temporal changes in oxygen levels following the injection of blood were significantly different for the brain and skin oximeters (P < 0.0001, repeat measures analysis, for interaction between time and oximeter type).
Figure 4.
Responses to the third injection of blood into the cranial vault. Top panel: intracranial, blood and cerebral perfusion pressures: The injection caused an immediate increase in the intracranial pressure and drop in cerebral perfusion pressure. Blood pressure increased by 60 s and intracranial pressure fell, leading to a recovery in cerebral perfusion pressure. Middle panel: brain and skin pulse oximeter oxygen levels: the fall in cerebral perfusion pressure was associated with a fall in brain oxygen saturation to 78%. The recovery in cerebral perfusion pressure was associated with an increase in brain oxygen saturation to 94% at 60 s. A further fall in brain oxygen saturation to 77% occurred at 150 s. Skin oxygen levels remained stable. Bottom panel: brain and skin pulse oximeter pulse amplitude levels: The amplitude of the brain oximeter pulse demonstrated a marked increase, but not with the conventional skin pulse oximeter, following the injection. The oxygen saturations represent the average microvascular oxygen level over the entire cardiac cycle for each pulse. Pulse oximetry data represent the average for 7 sheep. The pressure data represent the average for 5 sheep. Each cranial vault injection commenced at time = 0.
The brain pulse amplitude increased markedly by 30 s, after the injection, while the conventional skin pulse oximeter amplitude remained unchanged [P = 0.0006, Mann Whitney U-test, for assessment of the percentage change from baseline, 117% (76 −181) vs 2% (1.9 −18.9) median (IQR)].
Pulse Waveform Changes
High ICP levels (>40 mmHg) were associated with the brain oximeter pulse developing periods of regular high-frequency oscillations at around 7 Hz. These changes were not present in the conventional skin pulse oximeter waveform (Figure 5).
Figure 5.
Simultaneous recording of brain and conventional skin pulse oximetry waveforms during a period of raised intracranial pressure (>40 mmHg) following an injection of blood deep into the brain of an animal. Dashed lines mark the start of each skin pulse. The brain oximeter pulse waveform demonstrated a high-frequency oscillation (~7 Hz). These oscillations were not present in the skin pulse. Oscillations at this frequency in intracranial pressure recordings have been documented and represent movement or “ringing” of the brain in response to the systolic pressure wave entering the brain.
Abbreviation: AU, arbitrary units.
Sagittal Sinus Vein Oxygen Levels
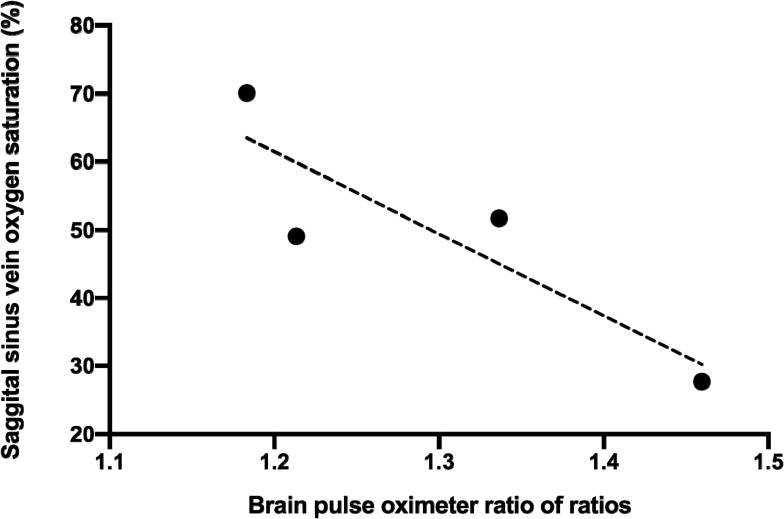
Venous blood gases were measured from the sagittal sinus vein in one animal at baseline and at around 120 s, following each brain injection of blood. Venous oxygen levels correlated with the non-invasive blood oxygen levels measured by the brain oximeter. R2 0.77, P = 0.12 (Figure 6).
Figure 6.
The correlation between oxygen saturation measured in sagittal sinus venous blood gas samples and the modified ratio of ratios of the brain oximeter. R2 0.77, p = 0.12. The data are from a single animal.
Discussion
In this sheep model, we found the brain oximeter detected changes in oxygen levels triggered by an acute increase in intracranial pressure levels. Raised intracranial pressure levels were also associated with changes in the brain pulse waveform. These responses were not present in the conventional skin pulse oximeter pulse waveform, suggesting that skin blood flow does not contaminate the brain signal. The brain pulse oximeter could assist clinicians in the management of patients with traumatic brain injury.
Brain pulse waveform and oxygen levels at baseline
The brain oximeter pulse waveform was quite distinct from that obtained from simultaneous conventional skin pulse oximetry. In conventional pulse oximetry, the waveform is similar in shape and timing to an arterial pressure waveform. The brain pulse waveform was, however, similar in shape and timing to a central venous pressure waveform, with A, C, X, V and Y waves. The brain pulse onset was delayed relative to the simultaneous skin pulse by around 100 ms, and the pulse peak occurred late in diastole. These features are also consistent with the pulse arising from the venous circulation. These findings may reflect the large proportion of the blood that resides in the venous circulation in the brain. Indeed, venular vascular beds account for 50% of the brain microvascular blood volume, and if small veins are included, up to 85% of the brain blood volume.14–18
The change in oxygen levels during the systolic and diastolic phases of the cardiac cycle was quite distinct from conventional skin pulse oximetry. The brain oximeter detected high oxygen saturations (100%) levels during the systolic phase, with a fall to low levels (60%) during the diastolic phase of the cardiac cycle. These findings are consistent with the signal arising predominately from microcirculation of the brain. The increase in oxygen levels during systole may represent arterial blood entering the microcirculation, while the falling levels during diastole may represent oxygen diffusing from the blood into the tissues. This is distinct from conventional skin pulse oximetry, where due to extensive shunting of blood through the skin, bypassing the microcirculation, oxygen levels typically remain arterial throughout the cardiac cycle.19
Injection of Blood into the Cranial Vault to Acutely Increase ICP
Brain Oxygen Levels
Each injection of blood triggered an immediate increase in ICP and fall in CPP; however, by 60 s CPP recovered. These changes were most marked following the last 4 injections. These temporal changes in CPP were reflected in the brain oximeter’s recordings with an immediate fall in oxygen followed by a marked increase by 60 s, and a second fall in oxygen levels occurred at 150 s. The initial fall in oxygen levels is consistent with reduced cerebral perfusion, while the marked increase in brain oxygen levels at 60 s may represent a combination of cerebral vasodilation and an increase in blood pressure resulting in cerebral hyper-perfusion, as has been demonstrated in animal models immediately following acute brain injury.20–22 The second fall in brain oxygen levels at 150 s may represent cerebral vasoconstriction to normalize brain oxygen levels. Conventional skin pulse oximetry did not demonstrate these swings in oxygen levels. Modest reductions in skin oxygen levels were observed also at around 150 s, following later injections. This may represent skin vasoconstriction to redirect blood flow to the brain.
Pulse Amplitude
For the final 3 injections, the amplitude of the brain oximeter pulse increased significantly. These changes were absent in the conventional skin pulse oximetry signal. This finding may reflect a combination of dorsal movement of the brain (towards the skull), due to the increase in ICP (which could increase light from the monitor reaching the brain tissue) and the associated increase in blood pressure combined with cerebral vasodilation, resulting in hyper-perfusion.20–22 This acute increase in the brain oximeter pulse amplitude could provide a method to detect periods of elevated ICP.
Pulse Waveform
Raised ICP levels were also associated with periods of high-frequency oscillations, at around 7 Hz, in the brain oximeter pulse waveform. These oscillations were not present in the skin oximetry pulse. Previous studies have also documented oscillations at this frequency in ICP pressure tracings and represent movement or “ringing” of the brain in response to the systolic blood pressure wave entering the brain.23–25 Raised ICP pressure levels increase the amplitude of these oscillations.26 This increased “ringing” may cause the changes in the brain waveform we observed. The synchronous nature of the pulse and the high-frequency oscillations were consistent with a cardiac source of the brain oscillations. Previous clinical studies, in the setting of acute brain injury, demonstrated that high-frequency oscillations in the ICP were associated with poorer clinical outcomes.25,27 These changes may provide an additional method to detect periods of raised ICP.
Sagittal Sinus Blood
Due to technical challenges, we were only able to obtain sagittal sinus blood in one animal. The brain pulse oximeter oxygen levels demonstrated a correlation with these blood levels. It may be anticipated that the brain oximeter’s oxygen levels and venous blood oxygen levels show a correlation, as the brain pulse oximeter blood oxygen levels reflect the average microvascular oxygen levels which include the diastolic phase of the cardiac cycle when microvascular and venous oxygen levels are equivalent.
The monitor has a number of potential advantages over existing cerebral oximeters. Cerebral oximeters measure a composite of arterial, microvascular and venous blood oxygen, and the accuracy of this measure in detecting brain hypoxia following TBI is poor.28 Unlike cerebral oximeters, the brain oximeter measures a pulse arising from the brain microcirculation, which has characteristic shape and oxygen levels that can be used to discriminate from a signal arising from the skin. This is not possible with cerebral oximeters. The amplitude and shape of the brain oximeter pulse may also provide additional information on relative changes in cerebral blood flow. Finally, the brain oximeter potentially measures the absolute oxygen saturation of blood in the microcirculation. The oxygen levels during the diastolic phase of the cardiac cycle have particular clinical significance, as it is the lowest oxygen level during diastole that determines whether brain cells have sufficient oxygen.29,30 By enabling continuous monitoring and early detection of low brain tissue oxygen levels, clinicians may be able to provide earlier interventions that prevent secondary brain injuries due to hypoxia.31–33
Limitations
We attempted to use the sagittal sinus blood oxygen levels as a measure of brain tissue oxygen levels, but due to technical difficulties, we were successful in only 1 animal. While CPP is a reasonable surrogate of brain oxygen levels, insertion of an intraparenchymal oxygen sensor may have provided a direct measure of brain tissue oxygenation levels. Future trials using a parenchymal oxygen sensor could address this limitation. The association between the RRm value derived by the brain pulse oximeter and blood oxygen levels has not as yet been established. To estimate brain blood oxygen levels, we, therefore, used the known relationship between RR and blood oxygen levels, of conventional pulse oximetry. At low oxygen saturations (<75%), the accuracy of the relationship between RR and blood oxygen levels is known to deteriorate, which adds uncertainty.34 Our current approach can only provide a guide to the relative change in brain oxygen levels. Further work is required to accurately determine the relationship between RRm and brain blood oxygen levels.
Conclusion
The brain oximeter detected changes in both oxygen levels and the brain pulse waveform triggered by an acute increase in intracranial pressure levels. The brain oximeter could assist clinicians in the management of acute brain injury.
Funding Statement
This research received no specific grant from any funding agency in the public or not-for-profit sectors and was funded by Cyban Pty Ltd.
Abbreviations
CPP, cerebral perfusion pressure; ICP, intracranial pressure; RRm, modified ratio of ratios; NIR, near infrared; SO2, oxygen saturation; RR, ratio of ratios; TBI; traumatic brain injury.
Availability of Data and Materials
The datasets used and/or analysed during the current study are available from the corresponding author on reasonable request.
Author Contributions
All authors contributed to the data analysis, drafting or revising the article, gave final approval of the version to be published and agree to be accountable to all aspects of the work. Protocol/project development was performed by BD, RT, CC; data collection or management was done by BD, RT, CC; data analysis was performed by BD; manuscript writing and editing were done by BD, RT, CC.
Disclosure
This research received no specific grant from any funding agency in the public or not-for-profit sectors. Dr Dixon has a financial interest in Cyban Pty Ltd, that is developing the brain oximeter. In addition, Dr Dixon has a patent pending for a Brain oximeter. The Preclinical Imaging and Research Laboratories, South Australian Health and Medical Research Institute and Dr Turner received fees from Cyban Pty Ltd, during the conduct of the study. The authors report no other conflicts of interest in this work.
References
- 1.Maloney-Wilensky E, Gracias V, Itkin A, et al. Brain tissue oxygen and outcome after severe traumatic brain injury: a systematic review. Crit Care Med. 2009;37(6):2057–2063. doi: 10.1097/CCM.0b013e3181a009f8 [DOI] [PubMed] [Google Scholar]
- 2.Oddo M, Levine JM, Mackenzie L, et al. Brain hypoxia is associated with short-term outcome after severe traumatic brain injury independently of intracranial hypertension and low cerebral perfusion pressure. Neurosurgery. 2011;69(5):1037–1045; discussion 1045. doi: 10.1227/NEU.0b013e3182287ca7 [DOI] [PubMed] [Google Scholar]
- 3.Stiefel MF, Spiotta A, Gracias VH, et al. Reduced mortality rate in patients with severe traumatic brain injury treated with brain tissue oxygen monitoring. J Neurosurg. 2005;103(5):805–811. doi: 10.3171/jns.2005.103.5.0805 [DOI] [PubMed] [Google Scholar]
- 4.Okonkwo DO, Shutter LA, Moore C, et al. brain oxygen optimization in severe traumatic brain injury Phase-II: a Phase II randomized trial. Crit Care Med. 2017;45(11):1907–1914. doi: 10.1097/CCM.0000000000002619 [DOI] [PMC free article] [PubMed] [Google Scholar]
- 5.Barone DG, Czosnyka M. Brain monitoring: do we need a hole? An update on invasive and noninvasive brain monitoring modalities. ScientificWorldJournal. 2014;2014:795762. doi: 10.1155/2014/795762 [DOI] [PMC free article] [PubMed] [Google Scholar]
- 6.Kato S, Yoshitani K, Kubota Y, Inatomi Y, Ohnishi Y. Effect of posture and extracranial contamination on results of cerebral oximetry by near-infrared spectroscopy. J Anesth. 2017;31(1):103–110. doi: 10.1007/s00540-016-2275-1 [DOI] [PubMed] [Google Scholar]
- 7.Davie SN, Grocott HP. Impact of extracranial contamination on regional cerebral oxygen saturation: a comparison of three cerebral oximetry technologies. Anesthesiology. 2012;116(4):834–840. doi: 10.1097/ALN.0b013e31824c00d7 [DOI] [PubMed] [Google Scholar]
- 8.Schneider A, Minnich B, Hofstatter E, Weisser C, Hattinger-Jurgenssen E, Wald M. Comparison of four near-infrared spectroscopy devices shows that they are only suitable for monitoring cerebral oxygenation trends in preterm infants. Acta Paediatr. 2014;103(9):934–938. doi: 10.1111/apa.12698 [DOI] [PubMed] [Google Scholar]
- 9.Steppan J, Hogue CW Jr. Cerebral and tissue oximetry. Best Pract Res Clin Anaesthesiol. 2014;28(4):429–439. doi: 10.1016/j.bpa.2014.09.002 [DOI] [PMC free article] [PubMed] [Google Scholar]
- 10.Lund A, Secher NH, Hirasawa A, et al. Ultrasound tagged near infrared spectroscopy does not detect hyperventilation-induced reduction in cerebral blood flow. Scand J Clin Lab Invest. 2016;76(1):82–87. doi: 10.3109/00365513.2015.1101485 [DOI] [PubMed] [Google Scholar]
- 11.Mendelson Y. Pulse oximetry: theory and applications for noninvasive monitoring. Clin Chem. 1992;38(9):1601–1607. [PubMed] [Google Scholar]
- 12.Wells AJ, Vink R, Blumbergs PC, et al. A surgical model of permanent and transient middle cerebral artery stroke in the sheep. PLoS One. 2012;7(7):e42157. doi: 10.1371/journal.pone.0042157 [DOI] [PMC free article] [PubMed] [Google Scholar]
- 13.Hales JR. Chronic catheterization for sampling venous blood from the brain of the sheep. Pflugers Arch. 1972;337(1):81–85. doi: 10.1007/BF00587875 [DOI] [PubMed] [Google Scholar]
- 14.Hirsch S, Reichold J, Schneider M, Szekely G, Weber B. Topology and hemodynamics of the cortical cerebrovascular system. J Cereb Blood Flow Metab. 2012;32(6):952–967. doi: 10.1038/jcbfm.2012.39 [DOI] [PMC free article] [PubMed] [Google Scholar]
- 15.Lee SP, Duong TQ, Yang G, Iadecola C, Kim SG. Relative changes of cerebral arterial and venous blood volumes during increased cerebral blood flow: implications for BOLD fMRI. Magn Reson Med. 2001;45(5):791–800. doi: 10.1002/mrm.1107 [DOI] [PubMed] [Google Scholar]
- 16.Wiedeman MP. Dimensions of blood vessels from distributing artery to collecting vein. Circ Res. 1963;12:375–378. doi: 10.1161/01.RES.12.4.375 [DOI] [PubMed] [Google Scholar]
- 17.Santisakultarm TP, Cornelius NR, Nishimura N, et al. In vivo two-photon excited fluorescence microscopy reveals cardiac- and respiration-dependent pulsatile blood flow in cortical blood vessels in mice. Am J Physiol Heart Circ Physiol. 2012;302(7):H1367–H1377. doi: 10.1152/ajpheart.00417.2011 [DOI] [PMC free article] [PubMed] [Google Scholar]
- 18.Zweifach BW. Quantitative studies of microcirculatory structure and function. II. Direct measurement of capillary pressure in splanchnic mesenteric vessels. Circ Res. 1974;34(6):858–866. doi: 10.1161/01.RES.34.6.858 [DOI] [PubMed] [Google Scholar]
- 19.Walloe L. Arterio-venous anastomoses in the human skin and their role in temperature control. Temperature (Austin). 2016;3(1):92–103. doi: 10.1080/23328940.2015.1088502 [DOI] [PMC free article] [PubMed] [Google Scholar]
- 20.Johnston IH, Rowan JO, Harper AM, Jennett WB. Raised intracranial pressure and cerebral blood flow. I. Cisterna magna infusion in primates. J Neurol Neurosurg Psychiatry. 1972;35(3):285–296. doi: 10.1136/jnnp.35.3.285 [DOI] [PMC free article] [PubMed] [Google Scholar]
- 21.Marchal G, Young AR, Baron JC. Early postischemic hyperperfusion: pathophysiologic insights from positron emission tomography. J Cereb Blood Flow Metab. 1999;19(5):467–482. doi: 10.1097/00004647-199905000-00001 [DOI] [PubMed] [Google Scholar]
- 22.Traupe H, Kruse E, Heiss WD. Reperfusion of focal ischemia of varying duration: postischemic hyper- and hypo-perfusion. Stroke. 1982;13(5):615–622. doi: 10.1161/01.STR.13.5.615 [DOI] [PubMed] [Google Scholar]
- 23.Lang EW, Paulat K, Witte C, Zolondz J, Mehdorn HM. Noninvasive intracranial compliance monitoring. Technical note and clinical results. J Neurosurg. 2003;98(1):214–218. doi: 10.3171/jns.2003.98.1.0214 [DOI] [PubMed] [Google Scholar]
- 24.Wagshul ME, Eide PK, Madsen JR. The pulsating brain: a review of experimental and clinical studies of intracranial pulsatility. Fluids Barriers CNS. 2011;8(1):5. doi: 10.1186/2045-8118-8-5 [DOI] [PMC free article] [PubMed] [Google Scholar]
- 25.Robertson CS, Narayan RK, Contant CF, et al. Clinical experience with a continuous monitor of intracranial compliance. J Neurosurg. 1989;71(5 Pt 1):673–680. doi: 10.3171/jns.1989.71.5.0673 [DOI] [PubMed] [Google Scholar]
- 26.Takizawa H, Gabra-Sanders T, Miller JD. Changes in the cerebrospinal fluid pulse wave spectrum associated with raised intracranial pressure. Neurosurgery. 1987;20(3):355–361. doi: 10.1227/00006123-198703000-00001 [DOI] [PubMed] [Google Scholar]
- 27.Piper IR, Miller JD, Dearden NM, Leggate JR, Robertson I. Systems analysis of cerebrovascular pressure transmission: an observational study in head-injured patients. J Neurosurg. 1990;73(6):871–880. doi: 10.3171/jns.1990.73.6.0871 [DOI] [PubMed] [Google Scholar]
- 28.Leal-Noval SR, Cayuela A, Arellano-Orden V, et al. Invasive and noninvasive assessment of cerebral oxygenation in patients with severe traumatic brain injury. Intensive Care Med. 2010;36(8):1309–1317. doi: 10.1007/s00134-010-1920-7 [DOI] [PubMed] [Google Scholar]
- 29.Tenney SM. A theoretical analysis of the relationship between venous blood and mean tissue oxygen pressures. Respir Physiol. 1974;20(3):283–296. doi: 10.1016/0034-5687(74)90025-5 [DOI] [PubMed] [Google Scholar]
- 30.Lutch JS, Murray JF. Continuous positive-pressure ventilation: effects on systemic oxygen transport and tissue oxygenation. Ann Intern Med. 1972;76(2):193–202. doi: 10.7326/0003-4819-76-2-193 [DOI] [PubMed] [Google Scholar]
- 31.Oropello JM, Manasia A, Hannon E, Leibowitz A, Benjamin E. Continuous fiberoptic arterial and venous blood gas monitoring in hemorrhagic shock. Chest. 1996;109(4):1049–1055. doi: 10.1378/chest.109.4.1049 [DOI] [PubMed] [Google Scholar]
- 32.Jaffurs W Jr., Spicer SS, Carroll RG, Allison EJ Jr., Whitley TW, Mayo HL. Transcutaneous oxygen tension measurements during hemorrhagic hypoperfusion using Trendelenburg and the pneumatic antishock garment. Resuscitation. 1989;17(2):119–129. doi: 10.1016/0300-9572(89)90064-6 [DOI] [PubMed] [Google Scholar]
- 33.Denninghoff KR, Smith MH, Lompado A, Hillman LW. Retinal venous oxygen saturation and cardiac output during controlled hemorrhage and resuscitation. J Appl Physiol (1985). 2003;94(3):891–896. doi: 10.1152/japplphysiol.01197.2001 [DOI] [PubMed] [Google Scholar]
- 34.Carter BG, Carlin JB, Tibballs J, Mead H, Hochmann M, Osborne A. Accuracy of two pulse oximeters at low arterial hemoglobin-oxygen saturation. Crit Care Med. 1998;26(6):1128–1133. doi: 10.1097/00003246-199806000-00040 [DOI] [PubMed] [Google Scholar]
Associated Data
This section collects any data citations, data availability statements, or supplementary materials included in this article.
Data Availability Statement
The datasets used and/or analysed during the current study are available from the corresponding author on reasonable request.


