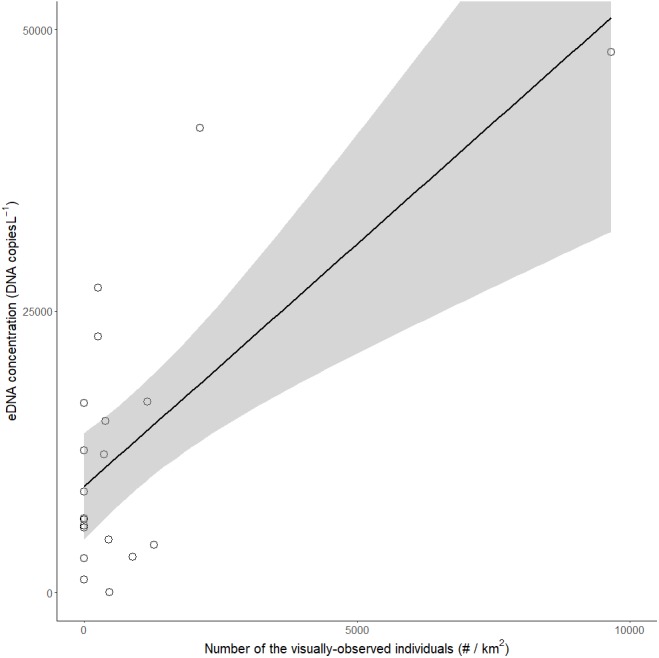
Figure 2. Relationship between the visual observation number of red-eared sliders (Trachemys scripta elegans) per km2 and their eDNA concentrations in the ponds.

The grey area represents the limits of the 95% confidence interval for the slope of the linear regression (R2 = 0.48, p < 0.001).
