Abstract
Motivation
With its capacity for high-resolution data output in one region of interest, chromosome conformation capture combined with high-throughput sequencing (4C-seq) is a state-of-the-art next-generation sequencing technique that provides epigenetic insights, and regularly advances current medical research. However, 4C-seq data are complex and prone to biases, and while specialized programs exist, an unbiased, extensive benchmarking is still lacking. Furthermore, neither substantial datasets with fully characterized ground truth, nor simulation programs for realistic 4C-seq data have been published.
Results
We conducted a benchmarking study on 66 4C-seq samples from 20 datasets, and developed a novel 4C-seq simulation software, Basic4CSim, to allow for detailed comparisons of 4C-seq algorithms on 50 simulated datasets with 10–120 samples each. Simulations and benchmarking were adapted to address different characteristics of 4C-seq data. Simulated data were compared with published samples to validate simulation settings. We identified differences between 4C-seq algorithms in terms of precision, recall, interaction structure, and run time, and observed general trends. Novel differential pipeline versions of single-sample based 4C-seq algorithms were included in the benchmarking. While no single tool was optimally suited for both near-cis and far-cis, and both single-sample and differential analyses, choosing a high-performing algorithm variant did improve results considerably. For near-cis scenarios, r3Cseq, peakC and FourCSeq offered high precision, while fourSig demonstrated high overall F1 scores in far-cis analyses. Finally, 4C-seq simulations may aid in the development of improved analysis algorithms.
Availability and implementation
Basic4CSim is available at https://github.com/walter–ca/Basic4CSim.
Supplementary information
Supplementary data are available at Bioinformatics online.
1 Introduction
Circular chromosome conformation capture combined with high-throughput sequencing (4C-seq) is a next-generation sequencing (NGS)-based technique to identify three-dimensional chromosomal contacts between a chosen point of interest (‘viewpoint’), and other regions of the genome (Gheldof et al., 2012).
One 4C-seq experiment typically yields millions of reads, which originate from a specific set of genomic fragments defined by the chosen restriction enzymes. Due to inherent characteristics of the 4C-seq technology, resulting read distributions can suffer from a number of biases, depending on the properties of the fragments of origin (van de Werken et al., 2012a). Among those are the distance of a 4C-seq fragment to the experiments’ viewpoint, and the presence or the absence of a second restriction enzyme site within a 4C-seq fragment (‘non-blind’ and ‘blind’, respectively). Consequently, these properties have to be respected during the analysis of 4C-seq data to prevent misinterpretation. 4C-seq is characterized by a region of high-information density around the chosen experimental viewpoint (‘near-cis’), combined with relatively sparse data on the remainder of the chromosome on which this viewpoint is located (‘far-cis’), or other chromosomes (‘trans’). Taking into account the structural differences of the signal for these two regions can potentially improve 4C-seq analysis (van de Werken et al., 2012b). While the analysis of a single 4C-seq sample is not trivial, the analysis of samples in a differential setting with a condition and control group becomes even more complex. Since differential questions are regularly encountered in biology and medicine, supporting analysis strategies are of increasing importance. Various algorithms are available to identify near-cis or far-cis interactions (or both). Some algorithms work on one single sample at a time, while others identify differential interactions between two groups of samples. Results are presented graphically (van de Werken et al., 2012a) or as interval sets for predefined P-values or false-discovery rate levels; some tools offer additional statistics and visualizations. Output form, candidate interaction structure, run time or requirements differ between all programs. Therefore, comparing the performance of the algorithms for different tasks, situations and parameter settings is complicated, but necessary to achieve an optimized analysis. With a lack of fully characterized 4C-seq benchmarking datasets, simulated 4C-seq data with a known ground truth is critical for a detailed comparison; however, to our best knowledge, a flexible 4C-seq simulation program which can create realistic 4C-seq fragment data with characteristic biases is still missing.
Hence, we developed a novel 4C-seq data simulation tool, Basic4CSim, which respects the basic structure of experimental 4C-seq data, and can be adapted to simulate different interaction characteristics and noise levels. We then evaluated the precision, recall and F1 score of 5 available 4C-seq analysis programs on 20 published datasets with 66 samples and 87 confirmed interactions in total, and used simulated data to assess the performance and candidate interaction structure of the algorithms in more detail. We focused on assessing the precision and recall of the chosen programs for varying levels of background noise, interaction lengths, signal strengths, restriction enzymes, forms of interactions, levels of significance and control sample interaction strength. Furthermore, we included differential pipelines for single-sample-based algorithms in the benchmarking, compared the F1 score for all algorithm variants, evaluated the similarity of candidate interactions for replicate data with the help of the Jaccard index (Intersection over Union), and tested the stability and usability of the presented programs.
2 Materials and methods
Open source 4C-seq analysis programs were identified and downloaded as of August 2018. Web-interfaces or algorithms based on graphical output were excluded from the analysis. Since we were interested in results for both single-sample analyses and differential questions, we created pipeline versions of single-sample algorithms in R (https://www.R-project.org/, R Core Team, 2018). For each of these algorithms, their native candidate interactions per sample were called, combined and used as a basis for the differential expression algorithm DESeq2 (Love et al., 2014) to create differential analyses (Fig. 1). Basic statistics for the chosen algorithms are provided in Table 1, details regarding the differential pipelines are included in Supplementary Note S1.
Fig. 1.
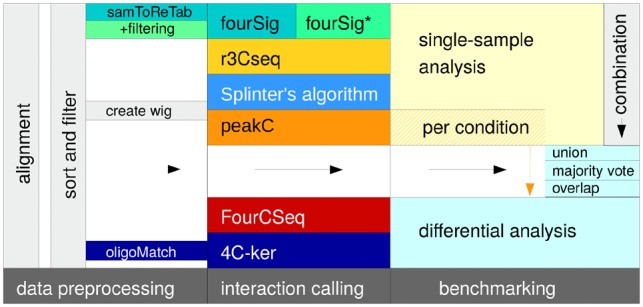
Benchmarking workflow: after a standardized preprocessing, candidate interactions were called for all 4C-seq analysis algorithms, and analyzed. Single-sample-based algorithm results were combined to allow for additional differential analyses
Table 1.
Properties of 4C-seq algorithms chosen for the benchmarking
| Algorithm | Analysis | Region | Input format | Source code | Language |
|---|---|---|---|---|---|
| 4C-ker | Differential | All | Tab-delimited count files | https://github.com/rr1859/R.4Cker | R |
| FourCSeq | Differential | All | Binary alignment/map (.bam) | https://bioconductor.org/packages/release/bioc/ html/FourCSeq.html | R |
| peakC | Single sample/ groups | Near-cis focus | Wiggle track format (.wig) | https://github.com/deWitLab/peakC | R |
| r3Cseq | Single sample | All | Binary alignment/map (.bam) | https://bioconductor.org/packages/release/bioc/html/ r3Cseq.html | R |
| fourSig | Single sample | All | Sequence alignment/map (.sam) | https://sourceforge.net/projects/foursig/ | R, Perl |
| Splinter | Single sample | No near-cis | Wiggle track format (.wig) | Publication supplement (Splinter et al., 2012) | R |
Note: Single-sample exclusive algorithms were combined with the differential expression algorithm DESeq2 to provide differential results.
2.1 4C-seq algorithms
Splinter’s algorithm (Splinter et al., 2012) is an R-based far-cis exclusive single-sample analysis algorithm that complements the graphics-based and near-cis focused 4cseqpipe (van de Werken et al., 2012a). Splinter’s tool includes a permutation approach, in which fragment counts within a smaller central window are compared against the distribution of fragments in a longer background window. Splinter’s algorithm does not consider total read counts per restriction fragment, but binarizes the fragment count data.
The R-package r3Cseq (Thongjuea et al., 2013) is integrated into the Bioconductor environment, and focuses on the analysis of one sample at a time, with optional consideration of a control sample. The algorithm relies on function fitting and background scaling; candidate interactions are identified with the help of windows with customizable length in base pairs (bp). For each candidate interaction, P-values are calculated based on the comparison of residues.
The single-sample-based algorithm fourSig (Williams et al., 2014) is written in R and Perl. The tool uses a similar permutation approach as Splinter’s algorithm, but takes fragment read counts into consideration. Additionally, fourSig offers a heuristic filtering strategy that allows to prioritize candidate interactions more likely to be true positives. The program includes routines to mask the viewpoint region, which is recommended for far-cis analyses.
The R/Bioconductor package FourCSeq (Klein et al., 2015) allows both single-sample and differential analyses and requires groups (n > 1) of samples for each condition; an analysis with one sample per condition is technically possible with previous versions, but not recommended (Love et al., 2014). FourCSeq’s main analysis strategy involves the fitting of curves to fragment read counts, and the analysis of residues.
4C-ker (Raviram et al., 2016) is programmed in R and, similar to FourCSeq, relies on the presence of replicate samples for a full differential analysis due to the utilized DESeq2 functionality. As preparation for its differential interaction calling, the tool utilizes a Hidden Markov Model to partition the genome into low-interacting or high-interacting regions, and regions without interactions. Separate functions are included for near-cis, far-cis and trans 4C-seq analyses.
peakC (Geeven et al., 2018) is a non-parametric algorithm, written in R, and based on rank-products. If replicates are present for a dataset, peakC offers a combined analysis, which uses information from all samples to improve precision.
2.2 Datasets and simulation strategy
We used simulated and published 4C-seq datasets as a basis for the benchmarking, and considered both mouse and human data, and different restriction enzyme combinations used in the 4C-seq library preparation.
For the single-sample-based algorithm benchmarking, 6 × 2 replicate samples and 6 pairs of samples with the same viewpoint, but different biological conditions were selected from 12 datasets or subsets in total. The number of selected viewpoints and samples was limited to two and four per study, respectively, in order to reduce possible biases and increase variety. We chose another eight datasets with two or more different conditions per study and at least two replicates per condition to allow for differential analysis and benchmarking. For the differential benchmarking, all available replicates were used to increase statistical power. Details regarding datasets and samples are provided in Supplementary Note S3.1.
Most studies with the same restriction enzyme length setup showed similar proportions of aligned reads, reads on the viewpoint chromosome or viewpoint region reads (Fig. 2A), with a high degree of similarity for replicates of the same dataset. The majority of chosen datasets fulfilled van de Werken’s basic quality parameters (Fig. 2B).
Fig. 2.
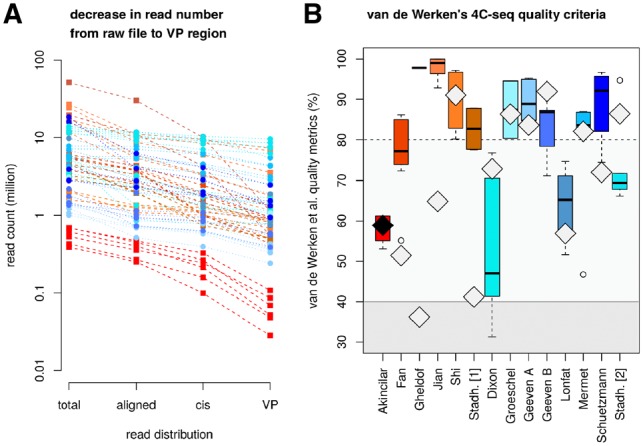
Data quality of published datasets (square/dashed line: 6 + 4 bp restriction enzyme combination, circle/dotted line: 4+ 4 bp setup). (A) Read count per sample before and after alignment, on the viewpoint chromosome and in the viewpoint region. (B) Quality criteria of van de Werken et al.: boxplots show fragment coverage in the viewpoint region (ideally >80%), additional diamonds indicate remaining quality statistics. Positions of the diamonds represent the cis/trans ratio (ideally >40%), and the diamonds’ brightness indicate the number of aligned reads (samples with <1 million reads depicted in black, samples with the recommended >1 million reads in light grey)
All simulations were conducted with the novel 4C-seq simulation tool Basic4CSim, which is based on basic structural attributes deduced from a set of 33 published 4C-seq samples (Supplementary Table S3). Briefly, we extracted information regarding background noise, near-cis read distribution, and interaction structure from the datasets, and created simulated data with predefined noise levels, viewpoint regions and interacting regions (Supplementary Note S2 and Table S4). Data quality, e.g. noise and signal strength, was varied between sets of simulated data. Different settings with regard to maximum background noise per fragment, percentage of noise fragments, average length and strength of simulated interactions were included. All simulated datasets consisted of two different simulated conditions, with five replicates each. The second condition displayed a subset of the first condition’s interactions, therefore acting as a control for the first group. In total, 18 sets of cis data with 12 subsets each and 6 sets of near-cis data with 32 subsets in total were simulated (Supplementary Table S5). Each set consisted of two conditions with five replicates. Since no sufficient data on different properties between far-cis and trans interactions were available, we approximated trans interactions with simulated low-density far-cis interactions.
2.3 Standardized data preprocessing and algorithm settings
All datasets were subjected to a standardized data preprocessing. Parameter choices depended on the specifics of the respective test scenario, with default choices otherwise. Window sizes of algorithms were varied wherever possible, and the resulting algorithm variants were evaluated separately. Details are provided in Supplementary Note S3.2.
2.4 Algorithm performance analysis
For the experimental data we assessed the algorithms’ precision, recall and F1 score, though this approach was limited due to the lack of fully characterized viewpoint datasets with validated positive as well as negative interaction sites. We decided to use a base pair level resolution for the majority of analyses, intending to differentiate between programs that solely identified the highest interacting fragments of an interacting region (‘summits’), and tools which output the majority of a whole interaction (‘peaks’). Results per interaction interval with a minimum overlap of 1 bp were provided as comparison for chosen datasets. Information regarding the position of true interaction intervals was either provided directly in the reference papers, or approximated from the associated publication figures. Further details are provided in Supplementary Note S3.3, definitions and examples for precision, recall and F1 score are given in Supplementary Note S3.4.
3 Results
Since real and simulated 4C-seq data are prone to differ in both known and previously unconsidered features and statistics, we evaluated both groups of datasets separately. Furthermore, a number of tools offered specific settings for use in near-cis or far-cis analyses due to the inherent differences in signal strength between these regions in 4C-seq samples. Since algorithm performance may vary between near-cis and far-cis, benchmarking was split by setting. Splinter’s algorithm is far-cis exclusive, and was therefore excluded from the near-cis benchmarking. Default window sizes for 4C-ker change in 4C-seq experiments with different restriction enzyme lengths; furthermore, there are general differences in fragment lengths and structure for these experimental setups. We therefore evaluated the algorithm performance separately on 6 and 4 bp primary restriction enzyme sets before combining the results.
3.1 Comparison between real and simulated 4C-seq data
While simulating data is a powerful tool in performance evaluations due to an implicit knowledge of the underlying ground truth, its usefulness depends on the similarity between simulated and real data. We therefore tested our simulated 4C-seq samples for adequate resemblance with published 4C-seq datasets.
Violin plots (https://CRAN.R-project.org/package=vioplot; Adler, 2005) indicated that the distribution of reads and thus the chosen signal strength and background noise of the viewpoint region and viewpoint chromosome for the simulated 4C-seq data were within the expected range of real-world 4C-seq samples. Near-cis fragment distributions were varied for the Dixon, Groeschel and Lonfat datasets, and ranged from samples with low median read counts and triangular shape of the corresponding probability density to samples with a higher median read count and curved violin plot; similar changes in the general shape of read distributions were achieved for near-cis simulation data by varying the number, signal strength and length of the simulated 4C-seq interactions (Fig. 3A). For all far-cis samples, the majority of fragments had no or few reads, with a limited number of high-signal fragments (Fig. 3B).
Fig. 3.
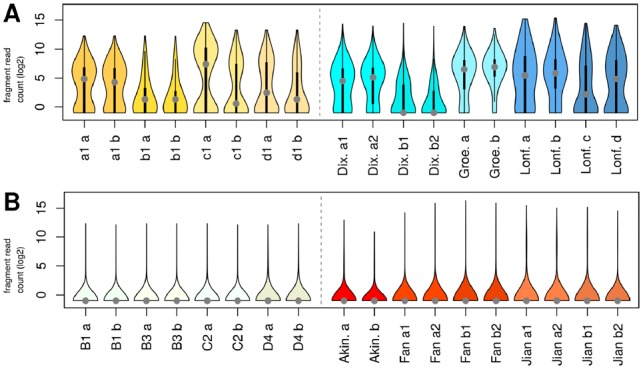
Violin plots for log2-transformed fragment read counts. (A) Near-cis simulation data for sample 1 of the condition and control group from datasets a1, b1, c1 and d1 (left), and published data samples with comparable number of near-cis fragments (right). The central part of each ‘violin’ corresponds to a standard boxplot, with a grey dot as marker for the median; symmetric curves at the sides depict the probability density. (B) Far-cis simulation data B1, B3, C2 and D4 (left), and published datasets with comparable number of cis fragments (right)
The ratio of near-cis to cis reads varied from 0.11 to 0.84 in the real-world samples; the simulated data showed ratios of 0.26–0.81 depending on the simulation settings. Median near-cis fragment coverage between both data types was comparable, with 77.01% for the real-world samples and 70%–95% for the simulated datasets. The range of total read numbers in cis of 0.5–10.1 million reads (excluding knockout samples) was matched between real-world and simulation data.
Details regarding the workflow and results of the simulation are provided in Supplementary Note S2.
3.2 Benchmarking: published data
3.2.1 Precision, recall and F1 score
For the chosen real 4C-seq samples with a 6 + 4bp restriction enzyme setup (n = 28), both fourSig and its heuristic filter version fourSig* showed a consistent median recall of 1.0 in near-cis for any tested window size between 3 and 101 fragments, and a median recall of 0.84 for fourSig-1 (Fig. 4A). The corresponding median precision and F1 scores did not exceed 0.05, with smaller values for higher window sizes. Results for r3Cseq were more varied, with increased median precision, lower median recall and generally higher median F1 scores than fourSig or fourSig*. r3Cseq’s precision and F1 score were maximal for a window size of one fragment on the chosen datasets (0.17 precision, 0.24 F1). Fixed window lengths of 2–100 kb yielded increasing recall with a local maximum in precision and F1 score for a window length of 10 kb. peakC’s general performance was comparable to r3Cseq-2k and r3Cseq-5k, but showed higher variance between the datasets and window sizes. FourCSeq’s F1 score varied notably, with values between 0.01, 0.49 and no results at all for three datasets, while 4C-ker presented a median recall level of 0.5 for the smaller window choices, matched with a low precision and F1 score for the test datasets.
Fig. 4.
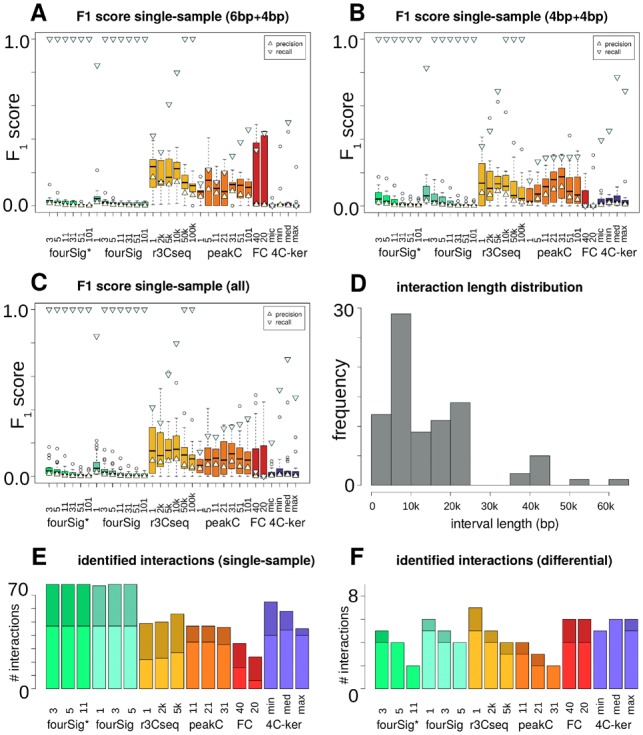
Benchmarking results for published data in near-cis. (A) Boxplots of single-sample-based F1 scores for 4C-seq algorithm variants, including markers for precision and recall, restricted to 6 + 4 bp data only. (B) Similar to (A), but restricted to 4 + 4bp data only. (C) Similar to (A), with all interactions and samples included. (D) Approximated lengths of the actual 4C-seq interaction intervals. (E) Number of identified single-sample interactions per algorithm (78 total). Upper/dark: 6 + 4bp, lower/bright: 4 + 4bp. (F) Similar to (E), but with number of identified differential interactions per algorithm (9 total)
We observed similar trends for the 4 + 4 bp samples (n = 38), namely high median recall and low median precision for fourSig and fourSig*, increased recall and decreased precision with growing window sizes, and generally low F1 scores (Fig. 4B). r3Cseq’s precision and F1 score were highest for a window size of 5 kb (precision P = 0.09, F1=0.13), while peakC-31’s median F1 score was maximal for the 4 + 4bp subset (F1 = 0.18). FourCSeq’s did not identify interactions for the majority of the samples, and 4C-ker’s F1 score did not exceed a median of 0.04. Consequently, r3Cseq-5kb and r3Cseq-10kb attained the highest overall median F1 scores for the whole group of samples (), with the highest median precision for all algorithms, combined with medium recall (Fig. 4C). These window sizes matched the prevailing interaction length of 5–10 kb found in the samples (Fig. 4D). peakC’s precision and F1 score were slightly lower than those of the r3Cseq variants ( for peakC-31). An overview of identified interactions per sample and algorithm is shown in Supplementary Table S4.
3.2.2 Further analyses
Given the strikingly low general precision in the base pair level analysis due to lack of fully characterized near-cis regions in real datasets, excess candidate interactions for algorithms with longer window sizes, or partly missed interactions for algorithms with shorter windows (Supplementary Figs S13 and 14), we asked how many interactions were identified by the chosen tools in total. Results were generally proportional to the algorithms’ recall, with more false-negatives for r3Cseq and FourCSeq, and a full set of identified single-sample interactions by fourSig variants (Fig. 4E and F). Furthermore, we found patterns for candidate interaction structures, with r3Cseq and FourCSeq usually identifying the central part of interacting regions (‘summits’), and fourSig’s and 4C-ker’s interactions overlapping the whole intervals (‘peaks’). peakC calls fragment-based intervals and tended to cover peak regions for window sizes close to its default value. Accordance between replicate results varied between algorithms and datasets (Supplementary Note S4.1).
3.3 Benchmarking: near-cis simulation
The setup for the near-cis simulation data analysis was kept similar to the benchmarking for real-world data. Notable differences included a larger proportion of available differential interactions, fully characterized high-signal regions, and an increased number of replicates per condition (n = 5). Consequently, more options for combining single-sample candidate interval sets were available; we chose to focus on a base pair union (≥1 parallel candidate interactions in five replicates), majority vote (≥3 in five) and overlap strategy (all five samples with candidate interaction intervals) as base for the differential DESeq2 pipeline approach.
3.3.1 Strong-signal, high-noise data
For the high noise dataset c6 with strong interactions of 1500–3000 maximum reads per peak fragment, the resulting precision and recall for most algorithms was comparable to the real-world datasets. Interactions for fourSig and fourSig* were scattered throughout the viewpoint area, and showed maximum recall for single-sample analyses and window sizes fragments (Fig. 5; Supplementary Fig. S17A); fourSig’s single-sample precision was highest for fragment-based fourSig. Corresponding absolute values for precision and F1 score were notably higher than in the published datasets, however, the increase were proportional to the increase in length of the characterized near-cis interactions. r3Cseq’s interactions were mainly located at the local maxima of interactions, with increasing coverage of the interacting intervals for longer window lengths. The program’s precision reached its maximum of P = 0.91 for a window size of 2 kb for single samples, while its recall generally increased for longer windows; for the chosen dataset, r3Cseq-10k had the highest overall F1 score (median ). peakC-1 had the highest overall precision of P = 0.91 in group-mode, but a lower F1 score than r3Cseq due to lower recall, and reduced precision for single-sample analyses. While FourCSeq did identify single-sample interactions for test data with <5 replicates per condition only, 4C-ker’s high-interacting regions were characterized by a recall of r = 0.71 for the default median window length, combined with a precision P = 0.37, and increasing precision and recall for our tested window sizes.
Fig. 5.
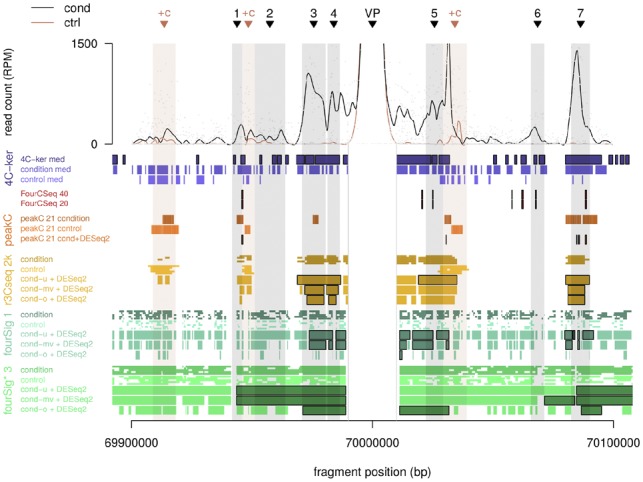
Viewpoint overview for simulated data with strong signal: near-cis overview plot with locally weighted scatterplot smoothing (LOESS) for fragment counts in pooled condition (cond) and control samples. Interactions and the viewpoint position are marked with black triangles and a grey bar throughout the plot, ‘+c’ denotes regions with added control signal. Candidate interactions are depicted per chosen algorithm variant: default values (‘4C-ker med’) for 4C-ker, default values (‘FourCSeq-40’) and reduced minimum reads per fragments (‘FourCSeq-20’) for FourCSeq, default values and default aggregation per condition for peakC, window sizes of 2000 (‘2k’) base pairs for r3Cseq, window sizes of 1 fragment for fourSig, and 3 fragments for fourSig*. Intervals with black borders indicate differential candidate interactions. cond-u: union of all condition replicate results, cond-mv: majority vote, cond-o: overlap
Regarding differential interactions, the DESeq2 pipeline for union r3Cseq-2kb had the highest F1 score of all tested algorithm variants (Supplementary Fig. S17D). In general, r3Cseq’s precision dropped for longer window sizes, while its recall increased; candidate interactions were located at interaction summits for fragment-based windows. fourSig and fourSig* usually had higher recall with decreased precision for window lengths between 3 and 11 fragments, and did not identify any differential interactions for larger window sizes. While peakC’s differential pipeline versions retained their high precision, maximum recall dropped to r = 0.05 for peakC-11 and the test dataset. Similarly, FourCSeq identified the summits of a subset of the simulated interactions (Fig. 5), resulting in low recall. In contrast, 4C-ker’s candidate interactions enveloped most simulated interactions, but also included added noise intervals. As a consequence, FourCSeq’s F1 score was 0.04 for a bp-based analysis, while 4C-ker’s default values resulted in an F1 score of 0.37.
A structural comparison based on the Jaccard index between candidate interactions for the simulated data yielded similar results to the corresponding analysis for the published 4C-seq samples. In general, variants of the same program with small differences in window size had similar candidate interactions, indicating a certain degree of stability for the algorithm results. Differential results were more heterogeneous between algorithm variants. Details are provided in Supplementary Note S4.2.
3.3.2 Interaction length
We assessed the algorithms’ performance on simulated datasets with different interaction lengths, and confirmed general trends from the published datasets and the first set of near-cis simulations (Supplementary Note S4.2).
3.3.3 Level of significance
Default levels of significance α were defined for all 4C-seq algorithms, but the influence of variations in α was considerable. We therefore chose algorithm variants with overall good performance in the near-cis benchmarking, and tested their precision and recall for progressively lower significance levels.
The recall of most 4C-seq programs decreased for lower values of α, while their precision increased or remained stable (Fig. 6). This general trend was true for simulated datasets with 6 and 4 bp primary restriction enzymes, varying peak lengths and changing levels of background noise. 4C-ker’s precision increased constantly for all chosen near-cis datasets up to , with small decreases in recall.
Fig. 6.
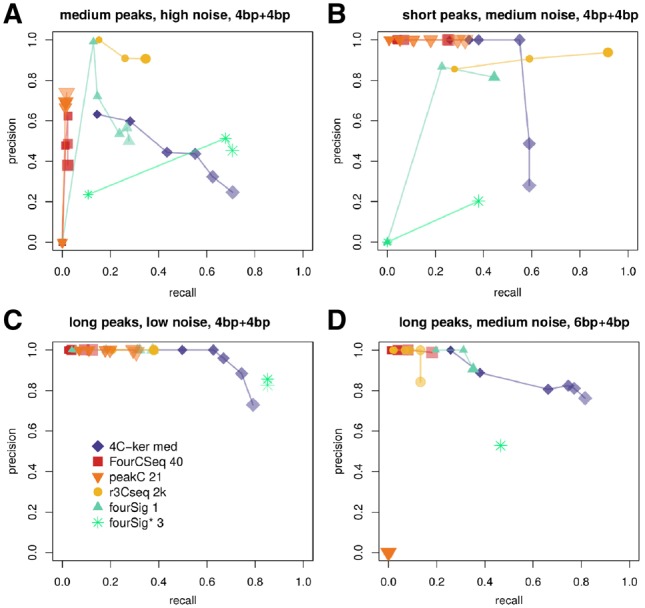
Precision-recall curves for differential near-cis settings and varying levels of significance α, with and . Smaller and more opaque symbols depict results for more stringent levels of α. (A) Dataset c6, medium-length peaks, high noise, 4 + 4bp. (B) Dataset a6, short peaks, medium noise levels, 4 + 4bp. (C) Dataset d1, long peaks, low noise, 4 + 4bp. (D) Dataset g6, long peaks, medium noise, 6 + 4bp
3.3.4 Influence of control samples
Since the comparison of different conditions can be relevant in biology and medicine, we simulated a series of samples with constant signal strength as a control sample group, but increased the interaction strength for the corresponding condition samples progressively over six datasets. This setup was used to assess the precision and recall of the chosen differential algorithm variants for increasingly divergent signal strengths between conditions. Maximum peak height for the condition samples was adapted, with scaling factor s = 0.5, 1.0,, 3.0. Condition samples were simulated with a fixed set of 10 interactions; a subset of 5 interactions was also included in the control samples, while the background noise varied (Supplementary Fig. S20A and B). We then determined the extent of identified differential control peaks in base pairs. Of all algorithms, only 4C-ker identified more than 10% of the control peaks, with recall r = 0.46 for scaling factor s = 2.0, and r = 0.59 for s = 3.0 (Supplementary Fig. S20C).
3.4 Benchmarking: far-cis simulation
While some algorithm variants performed similarly with regard to their F1 score in near-cis and far-cis, other programs’ precision and recall changed considerably. FourCSeq and r3Cseq continued to show high precision, with reduced recall for r3Cseq in case of longer interactions. fourSig variants retained their high recall, but gained higher precision, while 4C-ker and single-sample peakC lost precision in a number of far-cis datasets. However, peakC’s differential pipeline version showed high precision for most window sizes and simulation settings (Supplementary Note S4.3). Far-cis exclusive Splinter’s algorithm had similar precision and recall as fourSig variants with matching window sizes (Fig. 7).
Fig. 7.
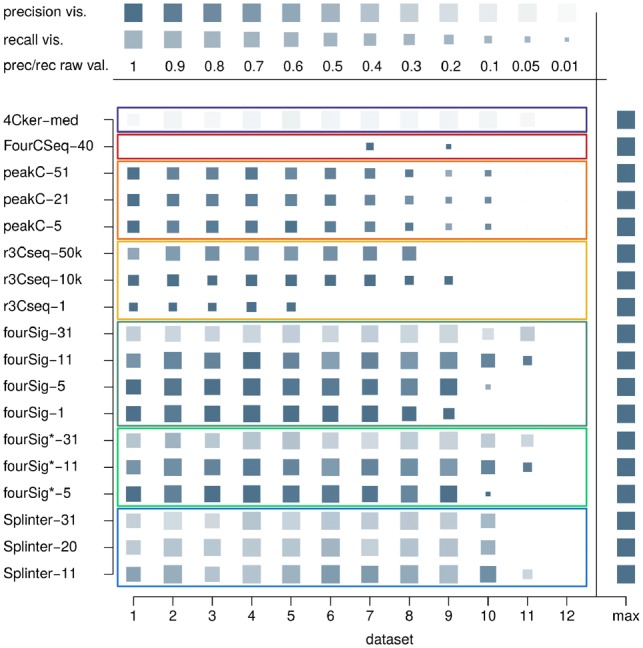
Far-cis benchmarking overview for dataset B1: precision and recall for a subset of the chosen benchmarking algorithm variants in differential settings on a low-noise dataset with strong interaction signal; the full algorithm variant set is presented in Supplementary Figure S21. Size of symbol glyphs depict recall, the precision is mapped to saturation (color intensity). Maximal values are shown on the right side of the plots for comparison (‘max’), different levels for precision and recall are visualized at the top of the plot. A union of single-sample results was used in the pipeline approach for single-sample 4C-seq algorithms fourSig, fourSig*, r3Cseq and Splinter. Datasets 1–12 are sorted by the simulated interactions’ fragment coverage rate (100, 90, , 10, 5, 1%)
General trends for algorithm precision and recall were quite stable regarding different background noise levels, interaction lengths, interaction forms, signal strengths and enzyme choices (Supplementary Note S4.3). The run time of most programs was low (Supplementary Note S4.4); usability depended on the algorithm and the chosen type of analysis (Supplementary Note S4.5).
4 Discussion
Currently there is a lack of gold standard validation datasets with a sufficient number of validated 4C-seq interactions in near-cis and far-cis, while different algorithms for candidate interaction identification are available. We therefore simulated 4C-seq data based on parameters extracted from published and novel 4C-seq experimental data, and compared the 4C-seq programs with regard to their precision, recall, F1 score, interaction length, pairwise overlap and general candidate interaction structure for a number of real datasets, and simulated samples with varying interaction strengths and interaction forms. Given the sparse data on predominant 4C-seq noise patterns, we simulated a variety of interferences in the form of background noise and interaction fragments without signal.
4.1 General results
Taking together the results of the different simulation settings and published data, we conclude that currently there is no algorithm that performs optimally for all possible conditions and interaction structures of a 4C-seq experiment. While each algorithm identified most simulated interactions in low-noise, strong-signal simulations with a focus close to the experiment’s viewpoint, false-positive and false-negative calls increased with rising noise levels and degrading signal strength. Algorithm-specific patterns emerged, including specifics regarding the general number, length or location of most candidate interactions. Such patterns were mostly independent from specific simulation settings, and also robust between replicates. Despite this, we observed noticeable differences in a subset of the chosen published biological replicate samples, indicating possible variation in the underlying cells, or technical artifacts during the creation of those 4C-seq samples.
We found a certain degree of stability for most programs’ results in simulated cis datasets with high interaction fragment coverage rates. Reductions of the fragment coverage rate from 100% down to 30% did not lead to proportional losses of precision or recall for most algorithms and variants or combination strategies, as long as the background rate was significantly lower, and the simulated interactions were still characterized by a certain length and read coverage per fragment. However, most algorithms could not reliably identify simulated interactions with fragment coverage rates close to the background coverage rate, even if the interaction strength per fragment was higher than the background noise. With Splinter’s binarization approach, this behavior was expected, but fourSig and fourSig* also suffered from decreased precision and recall.
Despite their inherent specialization, benchmarking results do not suggest that the currently available differential 4C-seq algorithms’ performance is superior to single-sample-based algorithms when combined with a differential DESeq2 setup. For the algorithms with customizable window sizes, optimum performance in terms of the F1 score was generally achieved when the size of the simulated interactions corresponded to the chosen window size. This behavior was partly caused by the chosen evaluation strategy, which focused on base pair interactions, and therefore penalized both additional overhangs in candidate peaks and restrictions to summit regions. However, large windows generally have a higher chance to miss smaller regions of high interaction signals by diluting the total signal regardless of the chosen analysis strategy, while small windows often cause an algorithm to ignore larger segments of a chromosome with lower, but consistent signal enrichment. Consequently, comparisons of results for different window lengths usually showed a more pronounced maximum for the F1 score at the matching interaction size for both simulated and real-world 4C-seq data. Since the median interaction size per sample is not inherently known for real-world 4C-seq samples, however, recommended approximations are dependent on the respective algorithm.
Splinter’s algorithm and fourSig offer a form of adaptive window sizes, and merge resulting intervals for smaller window sizes if the signal strength is appropriate. This approach allows for a certain flexibility, and usually leads to high precision and recall for smaller windows sizes up to the matching window length that corresponds to the expected interactions, unless the high-interacting viewpoint region is close by. Given the benchmarking results, we recommend window lengths of 5–11 fragments for fourSig*, 1–11 fragments for fourSig, 11–20 fragments for Splinter’s algorithm in cis and fragment-based fourSig for differential near-cis analyses. If possible with regard to expected points of interest in near-cis, the viewpoint region should be masked out for fourSig analyses. r3Cseq’s maximum window size is 100 kb, with less frequent overlaps and merges between bp-based interacting regions in contrast to the fragment-based techniques; fragment-based r3Cseq reports interaction lengths depending on the actual fragment sizes. With the high number of shorter fragments in a 4 + 4bp experiment, fixed windows of 2–5 kb with union or majority vote combination were found most promising for r3Cseq in near-cis, while fragment-based r3Cseq’s greater adaptability for candidate unions was beneficial for 6 bp primary restriction enzyme samples and cis analyses. 4C-ker’s default window sizes appeared to be sufficient for near-cis analyses, but the program benefited from lower significance levels α up to on datasets with medium noise levels. Similar to the other tools, peakC’s performance varies with its chosen window size; window sizes between 11 and 31 yielded high precision and F1 scores for most datasets.
Absolute values for precision and recall are noticeably low for a majority of algorithm variants in the presented datasets. While this is partly expected due to the chosen bp-based analysis strategy (Supplementary Note S3.4), 4C-seq data analysis is non-trivial in general, and issues with data quality may facilitate concerns regarding algorithm performance. Thorough validation of candidate interactions, as well as use of replicate data, are therefore required for reliable analyses. This is furthermore indicated by the variance between biological replicate samples, and also emphasized by Geeven et al. (2018). Additionally, replicates are a technical requirement for any DESeq2-based tool, which makes multiple samples a necessity if FourCSeq, 4C-ker or one of the presented pipeline versions of single-sample algorithms is chosen to analyze an experiment.
Given the overall fast run times and adequate usability of all considered 4C-seq algorithms, computational 4C-seq analyses are generally not complicated by technical concerns once the overall installation process of the chosen programs has been successfully completed. Due to the comparably low read number of 4C-seq experiments, physical disc space is not an issue either. However, the actual 4C-seq program and associated parameters have to be chosen with respect to the experimental settings and questions of interest, as indicated by the presented benchmarking, and reasonable care should be exercised during the interpretation of the provided results. Algorithm recommendations based on key results for typical 4C-seq analysis use cases are provided in Supplementary Table S7.
4.2 Limitations
With a limited number of validated 4C-seq interactions in near-cis and far-cis, the presented simulations and benchmarking do rely on transfer and interpolation of available near-cis interaction structure information to areas more distant from the viewpoints. In general, simulated data does not carry the same inherent authenticity as real-world 4C-seq data, and may include simulation-specific biases. While examples of real-world interactions in near-cis and far-cis indicate that assumptions of similarity are plausible, additional comparisons against validated cis and trans interacting regions would allow for further tests with simulations outside the actual viewpoint chromosome.
The standardized data preprocessing and alignment does not allow for optimizations regarding single datasets. We therefore assume that all algorithms might show a certain degree of improvement when more specialized algorithms or adapted parameters are used. However, with similar general results throughout both real and simulated datasets, and good alignment statistics and van de Werken quality metric results for the majority of real-world datasets and all simulated datasets, we expect those improvements to be minor in most cases.
Technical issues with FourCSeq and 4C-ker for some datasets prompted us to search for problems with the related workflows. For the differential 4C-seq algorithm FourCSeq, a number of datasets did not yield any results at all, and the number of exceptions on published datasets was notable. Single-sample analysis for our simulation datasets with five replicates did not yield significant candidate interactions; since FourCSeq reported results if lower numbers of replicates were analyzed in parallel, the amount of variance between all simulated replicates was likely problematic. However, the program showed high precision on summits for differential interactions on the simulated data, published datasets generally varied more with regard to data quality, and comparable errors were reported by the authors of 4C-ker when evaluating FourCSeq against their own algorithm. Therefore, we believe that the main issue in this case is related to the input data’s signal properties, e.g. high variance between replicates, and not caused by the data analysis workflow. The second differential analysis program, 4C-ker, generally demonstrated a high recall, albeit with lower precision than r3Cseq and FourCSeq in near-cis settings. Given the statements in the authors’ paper, this is to be expected, since 4C-ker aims to identify longer domains of medium to high interaction rates. For far-cis simulation data, 4C-ker’s precision was generally low.
5 Conclusion
Benchmarking results indicate that none of the currently available 4C-seq algorithms is optimally suited for all evaluated tasks. Consequently, different algorithms should be used for an optimized 4C-seq analysis, including differential pipeline versions of single-sample algorithms. We recommend r3Cseq for single-sample near-cis settings and the identification of summits in far-cis, peakC for near-cis group analyses when replicates are present, and the DESeq2-r3Cseq pipeline and FourCSeq for differential near-cis analyses. 4C-ker is more suited for the identification of broader peaks and domains in near-cis; it is also the most sensitive algorithm for the detection of different signal strengths between conditions. For most far-cis analyses, Splinter’s algorithm, fourSig* and their respective differential pipeline versions provide candidate interactions with high precision and recall. Given fourSig’s susceptibility to noise in near-cis, the use of replicates and overlaps between candidate intervals are recommended.
With reduced sequencing costs and rising amounts of data, new 4C-seq algorithms that address sensitive and precise single-sample and differential analyses for the whole genome are highly desirable.
Funding
This work was supported by the University of Muenster Medical Faculty [IZKF project Ros2/007/15 to F.R.].
Conflict of Interest: none declared.
Supplementary Material
References
- Adler D. (2005) vioplot: Violin plot, R package version 0.2. http://wsopuppenkiste.wiso.uni–goettingen.de/∼dadler.
- Geeven G. et al. (2018) peakC: a flexible, non-parametric peak calling package for 4C and Capture-C data. Nucleic Acids Res., 46, e91.. [DOI] [PMC free article] [PubMed] [Google Scholar]
- Gheldof N. et al. (2012) Detecting long-range chromatin interactions using the chromosome conformation capture sequencing (4C-seq) method. Methods Mol. Biol., 786, 212–225. [DOI] [PubMed] [Google Scholar]
- Klein F.A. et al. (2015) FourCSeq: analysis of 4C sequencing data. Bioinformatics, 31, 3085–3091. [DOI] [PMC free article] [PubMed] [Google Scholar]
- Love M.I. et al. (2014) Moderated estimation of fold change and dispersion for RNA-seq data with DESeq2. Genome Biol., 15, 550.. [DOI] [PMC free article] [PubMed] [Google Scholar]
- R Core Team (2018) R: A Language and Environment for Statistical Computing.
- Raviram R. et al. (2016) 4C-ker: a method to reproducibly identify genome-wide interactions captured by 4C-seq experiments. PLoS Comput. Biol., 12, e1004780.. [DOI] [PMC free article] [PubMed] [Google Scholar]
- Splinter E. et al. (2012) Determining long-range chromatin interactions for selected genomic sites using 4C-seq technology: from fixation to computation. Methods, 58, 221–230. [DOI] [PubMed] [Google Scholar]
- Thongjuea S. et al. (2013) r3Cseq: an R/Bioconductor package for the discovery of long-range genomic interactions from chromosome conformation capture and next-generation sequencing data. Nucleic Acids Res., 41, e132.. [DOI] [PMC free article] [PubMed] [Google Scholar]
- van de Werken H. et al. (2012a) Robust 4C-seq data analysis to screen for regulatory DNA interactions. Nat. Methods, 9, 969–971. [DOI] [PubMed] [Google Scholar]
- van de Werken H. et al. (2012b) 4C technology: protocols and data analysis. Methods Enzymol., 513, 89–112. [DOI] [PubMed] [Google Scholar]
- Williams R.L. et al. (2014) fourSig: a method for determining chromosomal interactions in 4C-Seq data. Nucleic Acids Res., 42, e68.. [DOI] [PMC free article] [PubMed] [Google Scholar]
Associated Data
This section collects any data citations, data availability statements, or supplementary materials included in this article.


