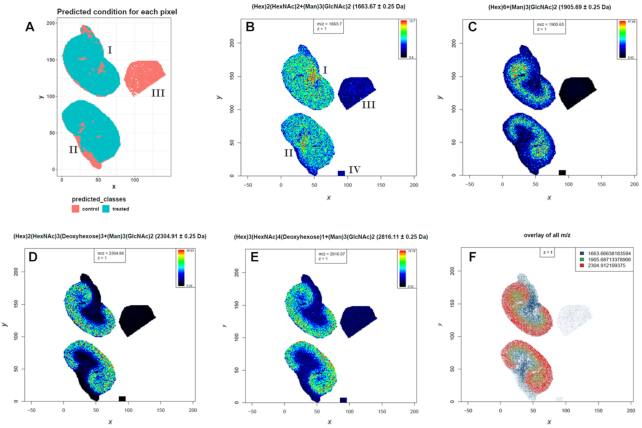
Figure 6:
Results from the supervised statistical analysis of N-linked glycans in murine kidney tissues. The supervised spatial shrunken centroids method was used to determine m/z features that are more abundant in the treated than in the control tissue specimen. A, Spatial shrunken centroids class prediction for all spectra. B–E, Intensity distribution images for 4 identified N-linked glycans (Hex)2(HexNAc)2(deoxyhexose)1+(Man)3(GlcNAc)2 (m/z 1,663.6), (Hex)6+(Man)3(GlcNAc)2 (m/z 1,905.7), (Hex)2(HexNAc)3(deoxyhexose)3+(Man)3(GlcNAc)2 (m/z 2,304.9), and (Hex)3(HexNAc)4(deoxyhexose)1+(Man)3(GlcNAc)2 (m/z 2,816.0). F, Overlay of 3 N-linked glycans with different distribution in the kidney. The ion distribution images and the overlay image were generated with contrast enhancement by suppression on TIC-normalized data. I = treated kidney1, II = treated kidney2, III = control kidney, IV = calibrants.

