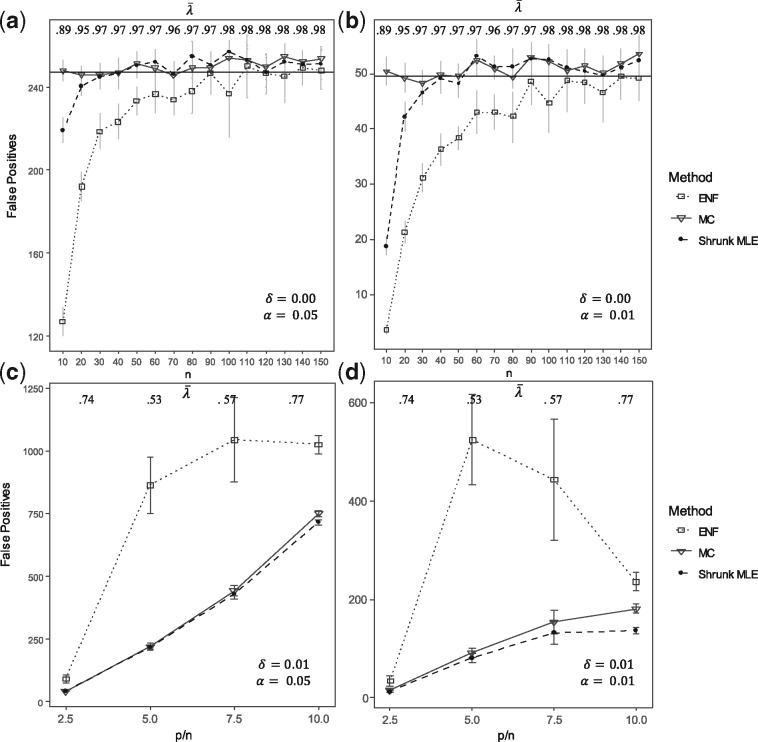
Fig. 3.
False positives. This figure shows the number of FPs obtained with different sample size . The number of FPs are shown in Panels (a) and (b) under : no partial correlation (i.e. the percentages of true correlations is zero). Inference is carried out from simulated data for = 100 and ranging from 10 to 150 in steps of size 10. The black horizontal line represents the expected number of FPs under, tested at = 0.05 and respectively (i.e. 247.5 for = 0.05 and 49.5 for =0.01). Panels (c) and (d) show the number of FPs for different proportions when the percentages of non-zero correlations is = 0.01. Here = 50, 100, 150, 200 and = 20. Three approaches are compared: ENF (dot with dashed line), Shrunk MLE (square with dotted line), and MC with 15 iterations (triangle with continuous line). Symbols (and bars) represent the average (±2 SE) over 25 repeated simulations. The upper horizontal axis shows the average shrinkage intensity rounded to two digits

