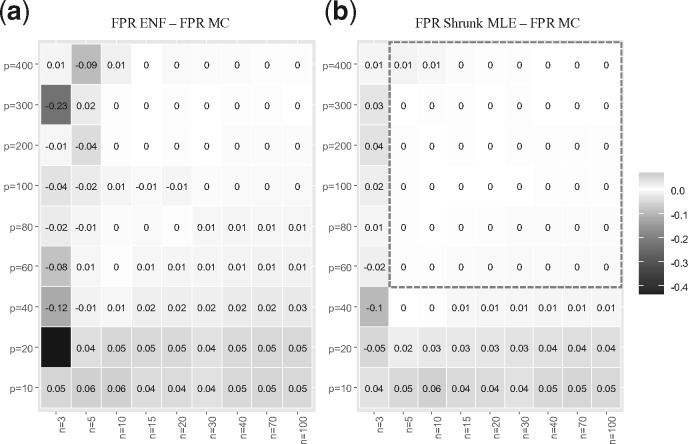
Fig. 4.
FPR cross-comparison. This figure shows a heatmap for the difference in FPR under : no partial correlation with respect to the gold standard (MC). The number of variables range from 10 to 400, and the sample size from 3 to 100. Panel (a) shows the heatmap for the FPR for ENF minus the FPR for MC, averaged over 10 simulations (rounded to two decimals). Panel (b) show the respective results for Shrunk MLE. The test is carried out at = 0.05 with a shrinkage value fixed to = 0.3. The color scale represents the FPR differences in the – grid, where the larger the FPR difference the darker is the corresponding grid cell. In general, Shrunk MLE outperforms ENF, and it is in close agreement with MC for and

