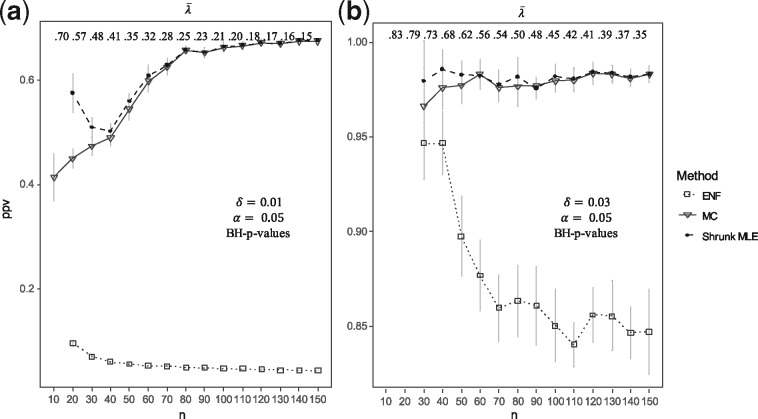
Fig. 5.
Positive predictive value. This figure shows the PPV () obtained with different sample sizes. The inference is carried out from simulated data for =100 with ranging from 10 to 150 in steps of size 10, tested at = 0.05. The Panels (a) and (b) show the PPV using Benjamini-Hochberg (BH)-adjusted P-values for multiple testing with = 0.01 (or 49 correlations) and = 0.03 (or 148 correlations). Three approaches are compared: ENF (dot with dashed line), Shrunk MLE (square with dotted line), and MC with 15 iterations (triangle with continuous line). Symbols (and bars) represent the average (±2 SEs) over 25 repeated simulations. The upper horizontal axis shows the average shrinkage intensity rounded to two digits

