Abstract
The kinase TBK1 responds to microbial stimuli and mediates type I interferon (IFN-I) induction. We show that TBK1 is also a central mediator of growth factor signaling; this function relies on a specific adaptor, TBK-binding protein 1 (TBKBP1). TBKBP1 recruits TBK1 to PKCθ via a scaffold protein, Card10, which allows PKCθ to phosphorylate TBK1 at serine-716, a crucial step for TBK1 activation by growth factors but not by innate immune stimuli. While the TBK1/TBKBP1 signaling axis is dispensable for IFN-I induction, it mediates mTORC1 activation and oncogenesis. Lung epithelial cell-conditional deletion of either TBK1 or TBKBP1 inhibits tumorigenesis in a mouse model of lung cancer. In addition to promoting tumor growth, the TBK1/TBKBP1 axis facilitates tumor-mediated immunosuppression by a mechanism involving induction of the checkpoint molecule PD-L1 and stimulation of glycolysis. These findings suggest a PKCθ-TBKBP1-TBK1 growth factor signaling axis mediating both tumor growth and immunosuppression.
Keywords: TBK1, TBKBP1, PKCθ, tumorigenesis, tumor-mediated immunosuppression, cancer metabolism
Introduction
TANK-binding kinase 1 (TBK1) and its homolog IKKε are serine/threonine kinases mediating type I interferon (IFN-I) induction and antiviral innate immunity1. Activation of TBK1 and IKKε in the immune system is typically mediated by signals from pattern-recognition receptors (PRRs), which detect various pathogen-associated molecular patterns (PAMPs). Upon activation, TBK1 and IKKε phosphorylate and activate interferon-responsive factor 3 (IRF3) and IRF7, key transcription factors mediating IFN-I gene induction1. Emerging evidence suggests that TBK1 possesses additional functions in the immune system, including regulation of immune tolerance and adaptive immune responses2. Moreover, studies based on human cancer cell lines suggest a role for TBK1 in mediating the survival and proliferation of Kras-dependent cancer cells3–5. TBK1 activates AKT and its downstream kinase, mammalian target of rapamycin complex 1 (mTORC1)5–8, although the role of TBK1 in AKT activation may be stimulus-dependent, since TBK1 is required for AKT activation by exocyst-dependent mechanisms and dispensable for AKT activation by the growth factor insulin5. Furthermore, TBK1 deficiency in T lymphocytes does not inhibit, but rather promotes, AKT activation under both homeostatic and T cell receptor-stimulated conditions9. Thus, the effector function of TBK1, particularly in cancer cells, warrant additional studies. Whether TBK1 is involved in oncogenesis in vivo is also unknown.
TBK1 activation by PRR ligands involves members of the TNF receptor-associated factors (TRAFs)10–13, but how TBK1 is activated in the oncogenic pathway is enigmatic. The RalB GTPase activates TBK1 under overexpression conditions, which appears to involve recruitment of TBK1 to the exocyst protein Sec53. RalB and Sec5 are important for PRR-stimulated IFN-I induction, and RalB is also an effector of the oncogenic Ras pathway3. Whether RalB is a major mediator of TBK1 activation in cancer cells or there are additional mechanisms is yet to be investigated.
TBK1 is known to interact with several adaptor proteins that contain a conserved TBK-binding domain; these include TANK, NAP1 (also called AZI2), and TBK-binding protein 1 (TBKBP1, also called SINTBAD)14. These adaptors bind to the same domain in TBK1 in a mutually exclusive manner, suggesting formation of separate complexes15. Although an initial gene knockdown study indicates a role for these adaptors in regulating virus-induced IFN-I expression14, subsequent gene targeting studies demonstrate that they are dispensable for TBK1 activation and IFN-I induction by innate immune stimuli16, 17. Thus, the role of TBK1 adaptor proteins in regulating the function of TBK1 in physiological or pathological processes is unclear.
In the present study, we demonstrate that TBK1 is activated by various growth factors via a mechanism that is dependent on the TBK1 adaptor TBKBP1. In response to growth factor stimulation, TBKBP1 recruits TBK1 to PKCθ via the scaffold protein Card10, thereby allowing PKCθ to phosphorylate and activate TBK1. Interestingly, the TBKBP1-dependent TBK1 activation is dispensable for IFN-I induction but required for mediating tumorigenesis, which is consistent with the important role of growth factor signaling in promoting oncogenesis18–20. We obtained genetic evidence that TBK1-mediated signaling is important for both tumor growth and tumor-mediated immunosuppression.
Results
TBK1 is required for lung tumorigenesis in vivo
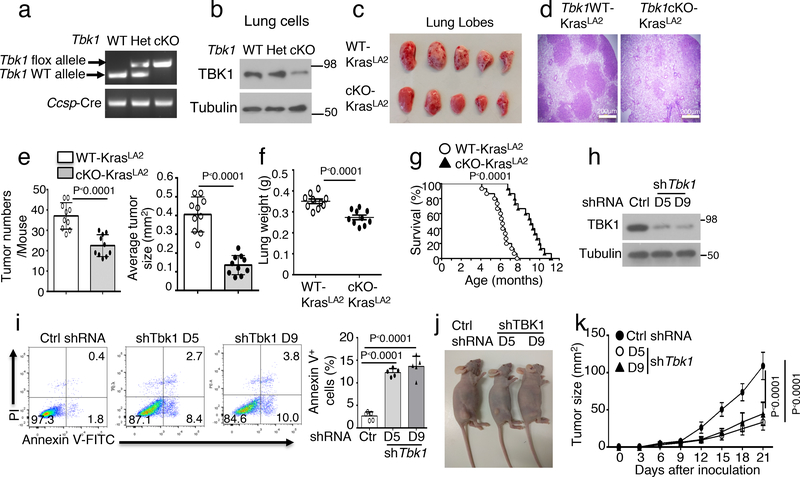
To examine the in vivo function of TBK1 in regulating tumorigenesis, we generated lung epithelial cell-conditional Tbk1 knockout mice (here after named Tbk1 cKO mice) (Fig. 1a,b). We then crossed them with transgenic mice expressing an oncogenic form of Kras (KrasLA2). As expected21, KrasLA2 mice spontaneously developed multiple lung tumor nodules at the age of 4 months (Fig. 1c,d). Remarkably, lung epithelial cell-specific deletion of TBK1 profoundly reduced the number and size of the tumors in the KrasLA2 mice (Fig. 1c–e). The reduced tumor burden in Tbk1cKO-KrasLA2 mice was also reflected by their lower lung weight than the age-matched control (Tbk1WT-KrasLA2) mice (Fig. 1f). The Tbk1cKO-KrasLA2 mice also displayed significantly higher survival rate than the Tbk1WT-KrasLA2 mice (Fig. 1g). Consistently, TBK1 knockdown in a human lung cancer cell line, A549, promoted apoptosis and suppressed tumor growth in a xenograft model (Fig. 1h–k). These results provide genetic evidence for a crucial role of TBK1 in mediating lung tumorigenesis.
Figure 1.
Lung epithelial cell-specific deletion of TBK1 inhibits Kras-induced lung tumorigenesis. a, Genotyping PCR analysis of Tbk1+/+Ccsp-Cre (WT), Tbk1+/flCcsp-Cre (Het), and Tbk1fl/flCcsp-Cre (cKO) mice, showing the detected flox and WT Tbk1 alleles and Ccsp-Cre. b, Immunoblotting analysis of TBK1 in lung cells of Tbk1 cKO mice. The residual TBK1 expression in Tbk1 cKO mice is due to the use of total lung cells, since Tbk1 is only deleted in lung epithelial cells. c-f, A representative picture of lung lobes (c), H&E staining of lung tissue (d, scale bar, 200 μm), summary of tumor numbers and average size (e), and summary of lung weight (f) of 4-month old Tbk1WT-KrasLA2 and Tbk1cKO-KrasLA2 mice. n=10 per genotype. g, Survival curve of WT-KrasLA2 and Tbk1cKO-KrasLA2 mice at indicated ages. n=15 per genotype. h, Immunoblot analysis of TBK1 expression in A549 lung adenocarcinoma cells transduced with a non-silencing control shRNA (Ctrl) or two different Tbk1-specific shRNAs. i, Flow cytometry analysis of apoptotic cells (based on AnnexinV and PI staining) in control or two different Tbk1-knockdown A549 cells (n=5 per group). Data are presented as a representative plot (left) and summary graph (right). j,k, A representative picture of tumor-bearing mice (j) and tumor growth curve (k) of nude mice inoculated (s.c.) with control and Tbk1-knockdown A549 cells (n = 8 nude mice per group). Data are representative of three independent experiments, and bar graphs are presented as mean±s.d. Two-sided unpaired Student’s t-test (e, f, i), Two-sided log-rank Mantel-Cox test (g), Two-way ANOVA with Bonferroni correction (k). Source data for graphs are provided in Statistical Source Data Fig. 1 and unprocessed blots are shown Unprocessed Blots Fig. 1.
TBK1 responds to growth factors in a TBKBP1-dependent manner
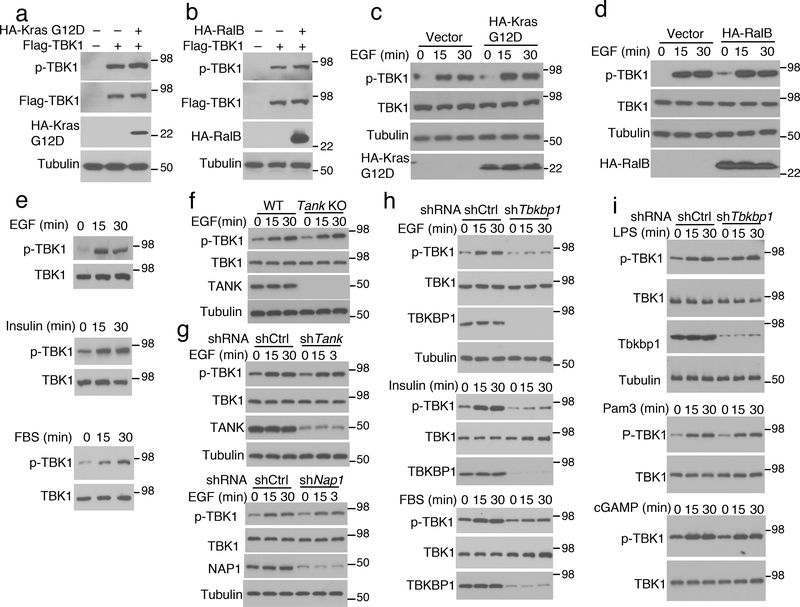
RalB activates TBK1 when overexpressed along with the exocyst protein Sec5 and has been implicated as an oncogenic mediator of Kras3. However, in the absence of Sec5, overexpressed RalB or the oncogenic Kras (G12D) had little effect on TBK1 activation (Fig. 2a,b). Since growth factors are crucial participants in oncogenesis, including Kras-induced tumorigenesis18–20, we were wondering whether TBK1 might respond to growth factor receptors. Indeed, EGF potently stimulated TBK1 activation in A549 cells, regardless of Kras G12D or RalB overexpression, and TBK1 was also activated by insulin and fetal bovine serum (FBS) (Fig. 2c–e).
Figure 2.
Growth factors activate TBK1 in a TBKBP1-dependent manner. a,b, Immunoblot analysis of S172-phosphorylated (p-) and total TBK1 in the lysates of HEK293T cells transfected with TBK1 along with KrasG12D (a) or RalB (b). c,d, Immunoblot analysis of TBK1 S172 phosphorylation in EGF-induced A549 cells stably transduced with vector control or KrasG12D (c) and RalB (d). e, Immunoblot analysis of S172-phosphorylated (p-) and total TBK1 in whole-cell lysates of A549 cells stimulated by EGF, Insulin or FBS. f,g, Immunoblot analysis of S172-phosphorylated (p-) and total TBK1 in whole-cell lysates of EGF-stimulated lung cells from WT or Tank KO mice (f) or EGF-stimulated A549 cells stably transduced with a control shRNA (shCtrl) or shRNAs for Tank (g, upper panel) and Nap1 (g, lower panel). h,i, Immunoblot analysis of S172-phosphorylated TBK1 (p-TBK1) and the indicated other proteins in whole-cell lysates of control or Tbkbp1-knockdown A549 cells stimulated with the indicated growth factors (h) or PRR ligands (i). Data are representative of three independent experiments. Unprocessed blots are shown in Unprocessed Blots Fig. 2.
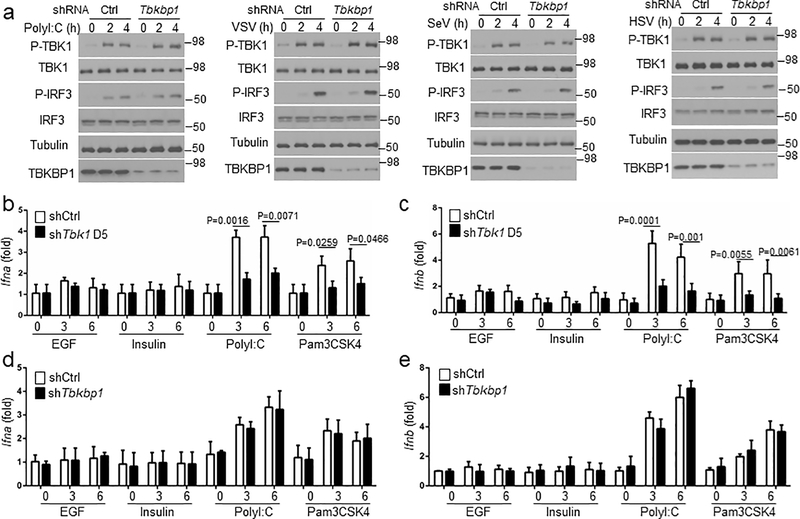
To elucidate the mechanism of growth factor-stimulated TBK1 activation, we examined the role of TBK1 adaptor proteins. TANK deficiency in mouse lung cells or human A549 lung cancer cells did not affect EGF-stimulated TBK1 activation, and NAP1 was also dispensable for TBK1 activation (Fig. 2f,g). In contrast, knockdown of TBKBP1 largely blocked TBK1 activation by EGF as well as by insulin and FBS (Fig. 2h). On the other hand, TBKBP1 was dispensable for TBK1 activation by various PRR ligands as well as DNA and RNA viruses (Fig. 2i and Extended Data Fig. 1a). Unlike TLR ligands, which stimulated Ifna and Ifnb gene expression in a TBK1-dependent manner, growth factors (EGF and Insulin) failed to stimulate Ifna and Ifnb expression (Extended Data Fig. 1b,c), despite strong TBK1 activation (Fig. 2e). TBKBP1 was also dispensable IFN-I induction by TLR ligands (Extended Data Fig. 1d,e), suggesting that the TBK1/TBKBP1 axis mediates growth factor signaling but is dispensable for IFN-I induction.
TBK1 is required for mTORC1 activation by growth factors
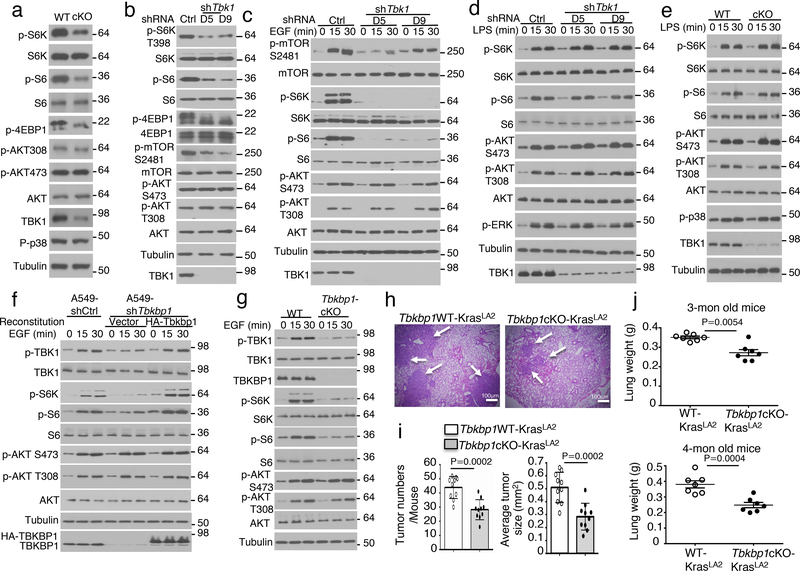
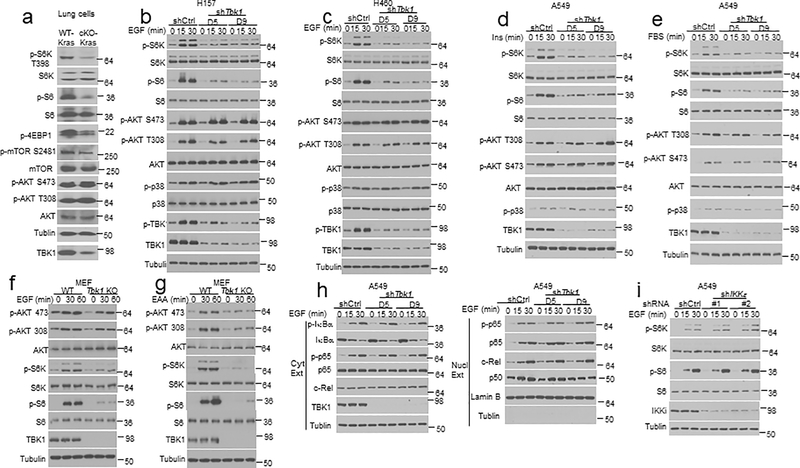
We next examined the role of TBK1 in regulating growth factor receptor signaling using primary lung cells. Freshly isolated lung cells displayed constitutive phosphorylation of AKT and mTORC1 target proteins (Fig. 3a). Importantly, the TBK1-deficient lung cells had impaired phosphorylation of mTORC1 target proteins, S6 kinase (S6K), ribosomal S6, and 4EBP1 (Fig. 3a). In contrast, TBK1 was dispensable for AKT activation, as detected based on phosphorylation at serine (S) 473 and threonine (T) 308 (Fig. 3a). The defective mTORC1 signaling was also detected in lung cells isolated from the Tbk1cKO-KrasLA2 mice (Extended Data Fig. 2a). Furthermore, TBK1 knockdown in human A549 lung cancer cells also caused profound inhibition of mTORC1 activity, as shown by the diminished phosphorylation of S6, S6K, and 4EBP1, and mTOR autophosphorylation at S2481 (Fig. 3b). Once again, TBK1 was dispensable for the basal activation of AKT (Fig. 3b). Under serum-starvation conditions, the growth factor EGF potently stimulated the activation mTORC1 and AKT, and TBK1 knockdown severely attenuated the activation of mTORC1, but not AKT (Fig. 3c). Similar results were obtained with two other lung cancer cell lines, H157 and H460 (Extended Data Fig. 2b,c). The TBK1 knockdown also impaired mTORC1 activation by insulin and FBS (Extended Data Fig. 2d,e).
Figure 3.
TBKBP1 and TBK1 form a growth factor signaling axis mediating mTORC1 activation and lung tumorigenesis. a-d, Immunoblot analysis of the indicated phosphorylated (P-) and total proteins in the lysates of freshly isolated lung cells from WT or Tbk1 cKO mice (a) and control or two different Tbk1-knockdown A549 cells cultured in FBS-containing medium (b) or starved in serum-free medium and restimulated with EGF (c) or LPS (d). e, Immunoblot analysis of the indicated phosphorylated (P-) and total proteins in the lysates of lung cells from WT or Tbk1 cKO mice stimulated with LPS. f, Immunoblot analysis of the indicated phosphorylated (P-) or total proteins in whole-cell lysates of control or Tbkbp1-knockdown A549 cells reconstituted with an empty vector or murine Tbkbp1 expression vector, stimulated as indicated. g, Immunoblot analysis of the indicated phosphorylated (P-) and total proteins in the lysates of lung cells from WT and Tbkbp1 cKO mice stimulated with EGF. h-j, H&E staining of lung tissue (h, scale bar, 100 μm), tumor numbers and average size (i), and lung weight (j) from 4-mon old (h,i) or the indicated ages (j) of Tbkbp1WT-KrasLA2 and Tbkbp1cKO-KrasLA2 mice (h,I, n=10 per genotype; j, n=7 per genotype). Data are representative of three independent experiments, and bar graphs are presented as mean±s.d. Two-sided unpaired Student’s t-test (i,j). Source data for graphs are provided in Statistical Source Data Fig. 3 and unprocessed blots are shown in Unprocessed Blots Fig. 3.
Consistent with prior studies5, 6, EGF-stimulated AKT activation was reduced in TBK1-deficient primary MEFs (Extended Data Fig. 2f). A more striking defect in AKT activation was detected in TBK1-deficient MEFs stimulated with essential amino acids (EAAs) (Extended Data Fig. 2g), which was in line with a previous report7. Furthermore, as seen in lung cancer cells, TBK1 deficiency in MEFs severely impaired phosphorylation of the mTORC1 target proteins, S6K and S6, induced by both EGF and EAAs (Extended Data Fig. 2f,g). TBK1 was dispensable for EGF-stimulated activation of the NF-κB signaling pathway, determined based on phosphorylation and degradation of the NF-κB inhibitor IκBα, phosphorylation and/or nuclear translocation of the NF-κB members p65, c-Rel, and p50 (Extended Data Fig. 2h). Furthermore, knockdown of the TBK1 homolog IKKε did not inhibit EGF-stimulated mTORC1 activation, highlighting the differences between these two kinases (Extended Data Fig. 2i). These results suggest a crucial role for TBK1 in mediating growth factor-stimulated mTORC1 activation and a cell type- and stimulus-dependent role for TBK1 in regulating AKT activation.
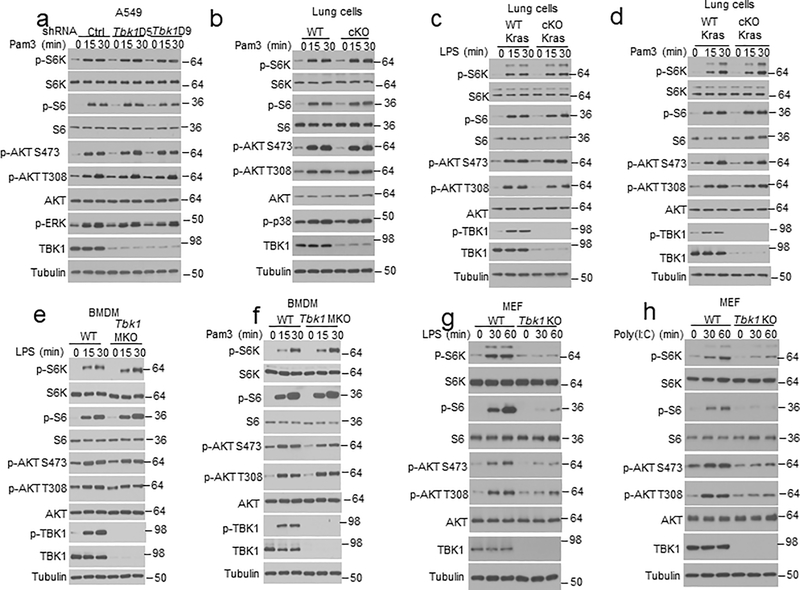
In contrast to its essential role in mediating growth factor-stimulated mTORC1 activation, TBK1 was dispensable for PRR-stimulated activation of mTORC1 or AKT in A549 human lung cancer cell line and murine primary lung cells (Fig. 3d,e and Extended Data Fig. 3a–d) or bone marrow-derived macrophages (BMDMs) (Extended Data Fig. 3e,f). On the other hand, consistent with previous reports8,22, TBK1 deficiency in MEFs impaired PRR-stimulated activation of AKT and mTORC1 (Extended Data Fig. 3g,h), suggesting a cell type-specific function of TBK1 in regulating PRR-stimulated activation of AKT and mTORC1.
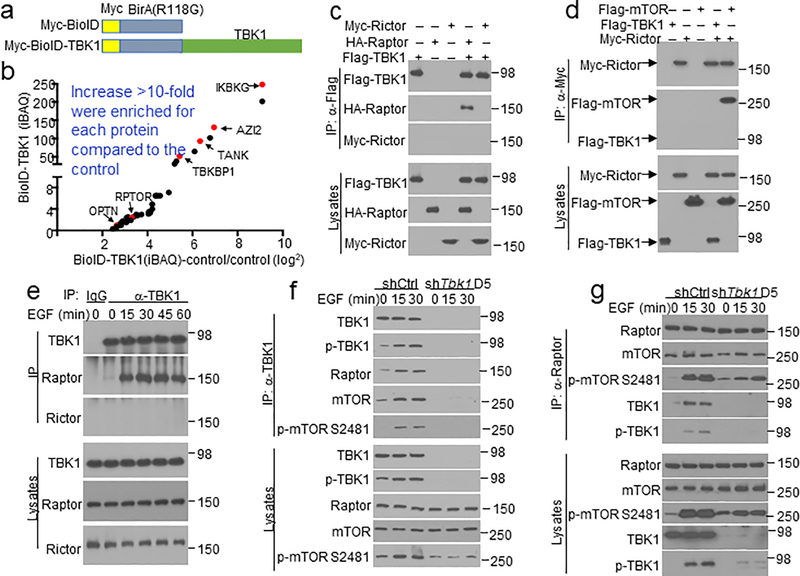
To assess the molecular mechanism of TBK1 function, we screened for TBK1-binding proteins using proximity-dependent biotin identification (BioID)23 (Extended Data Fig. 4a). Among the top-ranked proteins identified in this screening were several known TBK1 interactors, including TANK, TBKBP1, AZI2, OPTN, and IKKγ (IKBKG) (Extended Data Fig. 4b, Supplementary Table 1). In addition, we identified the mTORC1 component Raptor (RPTOR) as a new TBK1-binding protein (Extended Data Fig. 4b). Coimmunoprecipitation (coIP) assays confirmed that TBK1 formed a complex with Raptor, but not with the mTORC2 component Rictor (Extended Data Fig. 4c,d). Under endogenous conditions, EGF stimulated the binding of TBK1 to Raptor but not to Rictor (Extended Data Fig. 4e). Since TBK1 IP pulled down both Raptor and mTOR, it suggested association of TBK1 with mTORC1 complex (Extended Data Fig. 4f). The TBK1-associated mTOR was catalytically active, as determined based on its autophosphorylation at S2481(Extended Data Fig. 4f). In a reverse IP, TBK1 was pulled down by the Raptor antibody along with mTOR in EGF-stimulated cells (Extended Data Fig. 4g). These results suggest that TBK1 directly targets the mTORC1 but not mTORC2.
TBKBP1 mediates TBK1/mTORC1 signaling axis and tumorigenesis
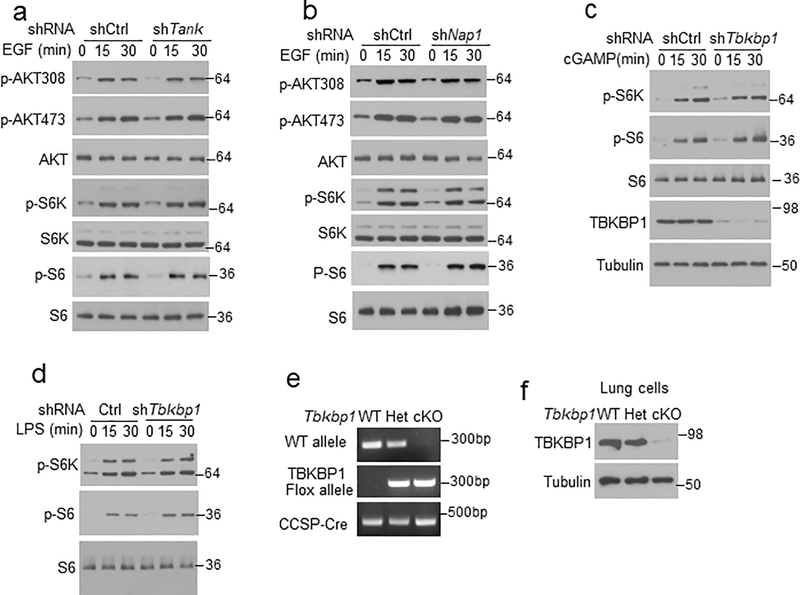
We next examined the role of TBKBP1 in mTORC1 activation. As expected, TBKBP1 knockdown impaired EGF-stimulated TBK1 activation, which was rescued by reconstitution of the TBK1-knockdown cells with TBKBP1 expression vector (Fig. 3f). Importantly, TBKBP1 knockdown severely impaired EGF-stimulated phosphorylation of mTORC1 target proteins, S6K and S6, without affecting the phosphorylation of AKT, and the mTORC1 signaling defect could be rescued by reconstituting the Tbkbp1-knockdown cells with TBKBP1 (Fig. 3f). In contrast, the other TBK1 adaptors, TANK and NAP1, were dispensable for EGF-stimulated mTORC1 activation (Extended Data Fig. 5a,b). Furthermore, TBKBP1 was not required for mTORC1 activation by PRR ligands (Extended Data Fig. 5c,d). These results suggest that TBK1 and TBKBP1 serve as essential signaling components of growth factor-stimulated mTORC1 activation, but they are not required for mTORC1 activation by innate immune stimuli.
To study the in vivo function of TBKBP1, we generated Tbkbp1 lung epithelial cell-conditional knockout (Tbkbp1fl/flCcsp-Cre, hereafter called Tbkbp1 cKO) mice (Extended Data Fig. 5e,f). Lung epithelial cells derived from the Tbkbp1 cKO mice had impaired activation of TBK1, confirming the requirement of TBKBP1 for TBK1 activation (Fig. 3g). Furthermore, the TBKBP1-deficient lung epithelial cells had a defect in EGF-stimulated mTORC1 activation, as demonstrated by the defective phosphorylation of mTORC1 target proteins, S6K and S6 (Fig. 3g). The TBKBP1 deficiency did not influence EGF-stimulated AKT activation, which was in line with the dispensable role of TBK1 in AKT activation (Fig. 3g). To test whether TBKBP1 played a role in regulating tumorigenesis, we crossed the Tbkbp1 cKO mice with KrasLA2 mice to generate Tbkbp1cKO-KrasLA2 and control WT-KrasLA2 mice. While the control mice spontaneously developed multiple large tumor nodules in the lung at the ages of 3–4 months, the Tbkbp1cKO-KrasLA2 mice had profoundly reduced tumor numbers and tumor size (Fig. 3h,i). The Tbkbp1cKO-KrasLA2 mice also had reduced lung weight due to reduced tumor burden (Fig. 3j). Thus, like TBK1, TBKBP1 is a critical mediator of mTORC1 signaling and lung tumorigenesis.
Growth factors activate TBK1 via a PKCθ-dependent mechanism
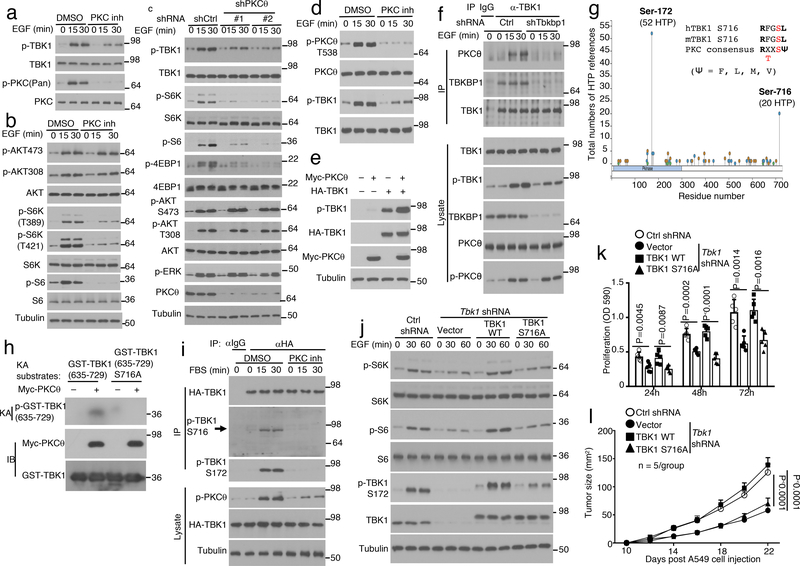
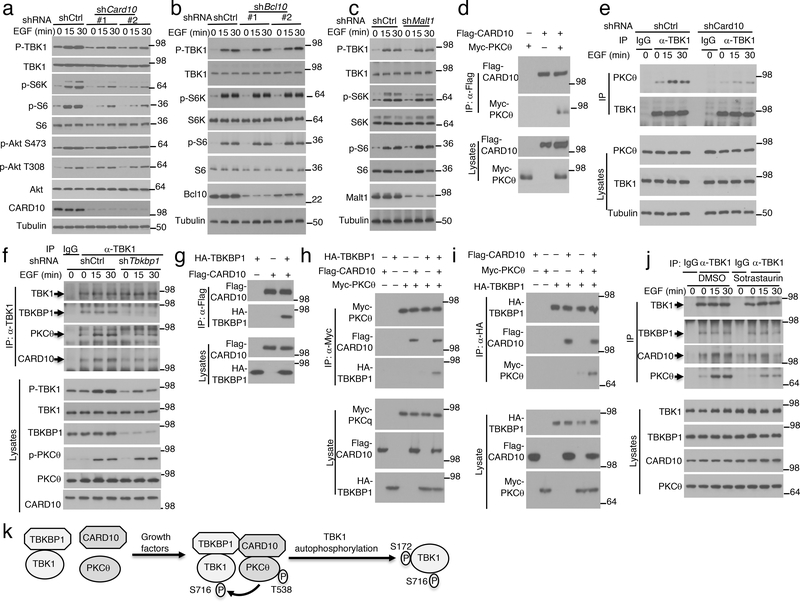
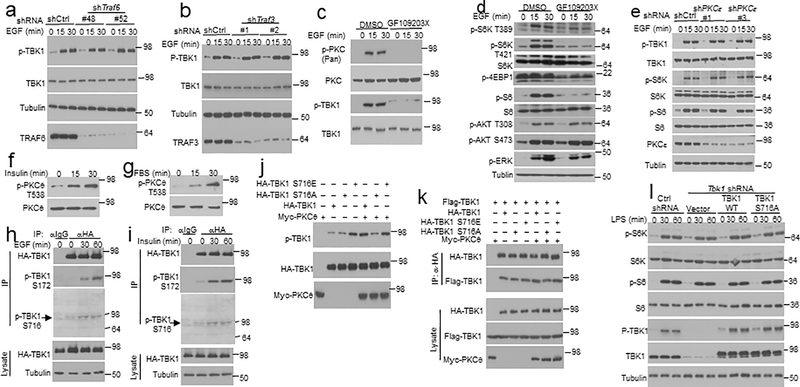
TBK1 activation by PRR ligands is typically mediated by members of the TNF receptor-associated factors (TRAFs)10–13. Interestingly, knockdown of TRAF6 or TRAF3 did not affect EGF-induced TBK1 activation (Extended Data Fig. 6a,b). Since protein kinase C (PKC) forms a family of serine/threonine kinases activated by growth factors24, we tested the role of PKC using pharmacological inhibitors. PKC inhibition by a selective inhibitor, Sotrastaurin, severely attenuated EGF-stimulated phosphorylation of TBK1 as well as mTORC1 target proteins, S6K and S6 (Fig. 4a,b). However, the PKC inhibitor had no appreciable effect on EGF-stimulated phosphorylation of AKT (Fig. 4b). Similar results were obtained with another PKC inhibitor, GF109203X (Extended Data Fig. 6c,d). Among the PKC isoforms, PKCε has been shown to mediate EGF-stimulated NF-κB activation25. However, PKCε knockdown did not affect EGF-stimulated activation of TBK1 or mTORC1 (Extended Data Fig. 6e). Knockdown of PKCθ potently inhibited EGF-stimulated phosphorylation of TBK1 as well as the mTORC1 target proteins, although PKCθ was dispensable for activation of AKT or ERK (Fig. 4c). In agreement with these findings, PKCθ was activated by EGF, insulin, and FBS, and the PKC inhibitor Sotrastaurin impaired the activation of PKCθ and TBK1 (Fig. 4d and Extended Data Fig. 6f,g). Moreover, overexpressed PKCθ induced the autophosphorylation of TBK1 in transfected cells (Fig. 4e). CoIP assays revealed that PKCθ physically associated with TBK1 in response to EGF stimulation, which was blocked in TBKBP1-knockdown cells (Fig. 4f). TBKBP1 knockdown did not affect the activation of PKCθ, suggesting that TBKBP1 served as an adaptor for recruiting TBK1 to the PKCθ signaling complex (Fig. 4f). These results suggest that PKCθ serves as an upstream regulator of TBK1 and relies on TBKBP1 for access of TBK1 in EGF-stimulated cells.
Figure 4.
PKCθ mediates growth factor-stimulated TBK1 activation through phosphorylating TBK1 at serine 716. a,b, Immunoblot analysis of the indicated phosphorylated (p-) and total proteins in whole-cell lysates of A549 cells stimulated by EGF along with a PKC inhibitor, Sotrastaurin, or solvent control DMSO. c, Immunoblot analysis of the indicated phosphorylated (p-) and total proteins in whole-cell lysates of control or PKCθ-knockdown (with two different shRNAs) A549 cells stimulated with EGF. d,e, Immunoblot analysis of the indicated phosphorylated (p-) and total proteins in whole-cell lysates of A549 cells stimulated with EGF along with the PKC inhibitor Sotrastaurin or solvent control DMSO (d) or of HEK293T cells transfected with TBK1 in the presence (+) or absence (–) of PKCθ (e). f, Co-IP analysis of PKCθ-TBK1 interaction using whole-cell lysates of EGF-stimulated control or Tbkbp1-knockdown A549 cells. IgG was used as a negative control for IP. g, Schematic of TBK1 phosphorylation sites (from PhosphoSite Plus). h, PKCθ in vitro kinase assays using Myc-PKCθ isolated by IP from transfected 293T cells and GST-TBK1 (635–729) or GST-TBK1 (635–729) S716A substrate. Protein expression level was analyzed by immunoblot. i, Immunoblot analysis of TBK1 and S172- or S716-phosphorylated (p-) TBK1 following TBK1 IP from A549 cells stably transduced with HA-TBK1 and stimulated with FBS along with a PKC inhibitor, sotrastaurin, or solvent control DMSO. j, Immunoblot analysis of the indicated phosphorylation (p-) and total proteins in lysates of EGF-stimulated control A549 cells (transduced with a control shRNA) or Tbk1-knockdown A549 cells reconstituted with an empty vector, HA-tagged wildtype TBK1 (TBK1 WT) or TBK1S716A mutant. k, In vitro proliferation of the indicated A549 lung cancer cells cultured in growth medium (with 10% FBS) and measured by MTT assay (n=5 per group). l, Tumor growth in nude mice implanted with the indicated A549 lung cancer cells (n = 5 nude mice per group). Data are representative of three independent experiments, and the graphs in k and l are presented as mean±s.d. Two-sided unpaired Student’s t-test (k), Two-way ANOVA with Bonferroni correction (l). Source data for graphs are provided in Statistical Source Data Fig. 4 and unprocessed blots are shown in Unprocessed Blots Fig. 4.
PKCθ-mediated TBK1 S716 phosphorylation stimulates TBK1 autophosphorylation
TBK1 activation is mediated via its autophosphorylation, although how signals stimulate TBK1 autophosphorylation is unclear26, 27. By searching the PhosphoSitePlus database (https://www.phosphosite.org, ref.28), we found that TBK1 have two predominant phosphorylation sites, S172 and S716, with 52 and 20 high-throughput (HTP) references, respectively (Fig. 4g). S172 is the well-defined activation loop phosphorylation site known to be autophosphorylated by TBK126, 27, whereas S716 has not been previously characterized. Interestingly, the sequence of S716 (RFGSL), which is identical in murine and human TBK1, fits the consensus sequence of PKC phosphorylation sites (RxxS/TΨ, Ψ=F, L, M, V). Indeed, PKCθ directly phosphorylated the C-terminal region of TBK1, which was abolished by S716 mutation (Fig. 4h). Immunoblot analysis using a phospho-TBK1 S716 antibody detected TBK1 S716 phosphorylation in cells stimulated with FBS, EGF, and Insulin (Fig. 4i and Extended Data Fig. 6h,i), which was dependent on PKC (Fig. 4i). S716A mutation of TBK1 abolished PKCθ-induced, although not basal, TBK1 autophosphorylation at S172 (Extended Data Fig. 6j). Conversely, a phospho-mimetic TBK1 mutant, S716E, displayed maximal autophosphorylation even in the absence of PKCθ (Extended Data Fig. 6j). The TBK1 S716A or S716E substitution did not affect the dimerization of TBK1, although it remains to be examined whether this phosphorylation site is required for formation of TBK1 oligomers (Extended Data Fig. 6k). Notwithstanding, these results suggest that PKCθ activates TBK1 through phosphorylation of S716.
We next examined the role of TBK1 S716 phosphorylation in mediating the signaling function and oncogenic activity of TBK1. As expected, reconstitution of the Tbk1-knockdown A549 cells with wildtype TBK1 fully rescued EGF-stimulated phosphorylation of the mTORC1 target proteins S6K and S6 (Fig. 4j). In contrast, reconstitution of the A549 cells with TBK1 S716A failed to rescue EGF-stimulated mTORC1 activation, consistent with impaired activation (autophosphorylation at S172) of this TBK1 mutant (Fig. 4j). Furthermore, wildtype TBK1, but not TBK1 S716A, rescued the defect of the Tbk1-knockdown A549 cells in proliferation and xenograft tumor growth (Fig. 4k,l). On the other hand, the S716A mutation did not affect LPS-stimulated activation of TBK1 or mTORC1 (Extended Data Fig. 6l). These findings emphasized the role of TBK1 S716 phosphorylation in mediating TBK1 activation and signaling functions in the growth factor pathway.
Scaffold protein Card10 recruits TBK1 to PKCθ for activation
EGF-stimulated activation of canonical IKK in the NF-κB pathway is dependent on a scaffold complex composed of CARD10 (also called CARMA3), BCL10, and MALT129. Interestingly, CARD10 knockdown potently inhibited EGF-stimulated activation of TBK1 as well as mTORC1, although it did not affect the activation of AKT (Fig. 5a). To our surprise, neither BCL10 nor MALT1 was required for EGF-stimulated activation of TBK1 or mTORC1 (Fig. 5b,c), suggesting the involvement of different mechanisms in EGF-stimulated activation of IKK and TBK1. Since CARD10 is a scaffold protein, we tested its physical interaction with PKCθ and TBK1/TBKBP1 complex. CARD10 physically associated with PKCθ in transfected cells, and Card10 knockdown impaired signal-induced PKCθ-TBK1 association, suggesting that the PKCθ-TBK1 binding required the scaffold protein CARD10 (Fig. 5d,e). Furthermore, Tbkbp1 knockdown inhibited the association of TBK1 with both PKCθ and CARD10, although TBKBP1 was dispensable for PKCθ activation (Fig. 5f). CARD10 interacted with TBKBP1 and promoted the binding of TBKBP1 to PKCθ (Fig. 5g–i). Interestingly, the PKC inhibitor Sotrastaurin inhibited EGF-stimulated association of TBK1 with CARD10 and PKCθ, although it did not affect the constitutive TBK1-TBKBP1 binding (Fig. 5j). Collectively, these findings suggest that TBK1 activation by growth factors involves PKCθ activation and the assembly of a signaling complex, composed of TBK1, TBKBP1, PKCθ, and CARD10, in which PKCθ phosphorylates TBK1 at S716 to trigger its autophosphorylation at S172 and full activation (Fig. 5k).
Figure 5.
EGF-stimulated TBK1 activation involves assembly of a signaling complex composed of PKCθ, CARD10, TBKBP1, and TBK1. a-c, Immunoblot analysis of the indicated phosphorylated (p-) and total proteins in whole-cell lysates of EGF-stimulated A549 cells stably infected with control or gene-specific shRNAs for CARD10 (a), BCL10 (b), or MALT1 (c). Two different shRNAs were used for CARD10 and BCL10 knockdown. d, Co-IP analysis of CARD10-PKCθ interaction (upper) and direct immunoblot assays (lower) using lysates of HEK293 cells transfected with the indicated expression vectors. e, Co-IP analysis of TBK1-PKCθ interactions (upper) and direct immunoblot analyses of the indicated proteins (lower) in control or Card10-knockdown A549 cells stimulated as indicated. IgG was used as a negative control for IP. f, Co-IP analysis of TBK1 interaction with TBKBP1, PKCθ and CARD10 using lysates of EGF-stimulated control and Tbkbp1-knockdown A549 cells. g-i, CoIP assays to detect the interactions between CARD10 and TBKBP1 (g, upper) and CARD10-dependent interactions between PKCθ and TBKBP1 (h,i, upper), with protein expression analyzed by direct immunoblot assays (lower). j, Co-IP analysis of TBK1 interaction with TBKBP1, PKCθ and CARD10 using lysates of A549 cells stimulated with EGF in the presence of the PKC inhibitor Sotrastaurin or solvent control DMSO. k, A model of TBK1 activation by growth factors. Growth factors stimulate PKCθ activation, thereby facilitating the assembly of a signaling complex. Within this complex, activated PKCθ phosphorylates TBK1 at S716, triggering TBK1 autophosphorylation at S172 and full activation. Data are representative of three independent experiments. Unprocessed blots are shown in Unprocessed Blots Fig. 5.
Pharmacological inhibition of TBK1 suppresses tumor growth and promotes antitumor immunity
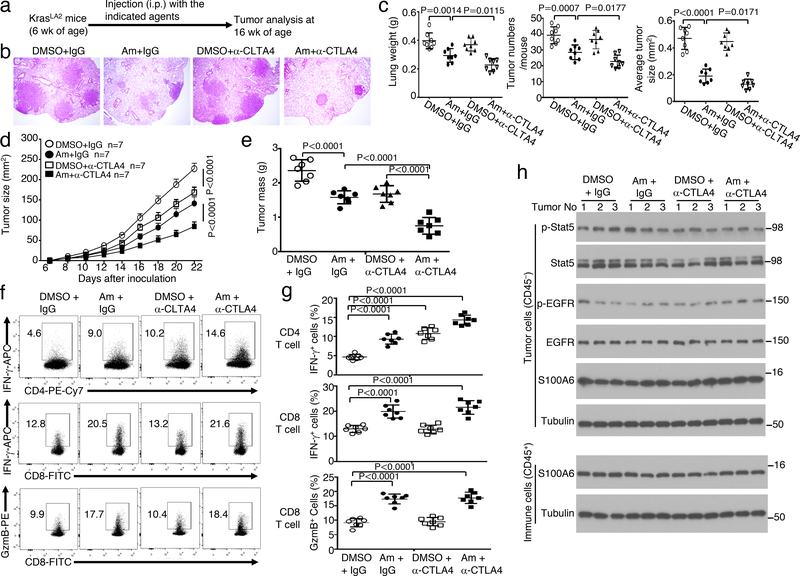
To assess the therapeutic potential of targeting TBK1, we treated the KrasLA2 mice with an FDA-approved drug, amlexanox, recently discovered to be a selective inhibitor of TBK130 (Fig. 6a). Amlexanox profoundly inhibited lung tumorigenesis in KrasLA2 mice, as revealed by reduction in the number and size of lung tumors as well as lung weight (Fig. 6b,c). Previous studies suggest that the KrasLA2 tumor model is insensitive to immune checkpoint inhibitors, likely due to limited somatic mutations for generating neoantigens for immune activation31–33. Consistent with these previous reports, anti-CTLA4 did not induce significant reduction in tumor burden (Fig. 6b,c). Interestingly, when administered together with amlexanox, the CTLA4 antibody significantly reduced tumor burden in the KrasLA2 mice (Fig. 6b,c). Thus, pharmacological inhibition of TBK1 attenuates lung tumorigenesis in the KrasLA2 model and sensitize tumors to anti-CTLA4 treatment.
Figure 6.
A small molecule inhibitor of TBK1 inhibits lung tumorigenesis and promotes antitumor T cell responses. a-c, Schematic of experimental design (a), a representative image of H&E staining of lung tissue (b, scale bar, 100 μm), and summary graphs of lung weights, tumor numbers, and average tumor size (c) of KrasLA2 mice treated with the TBK1 inhibitor amlaxanox (Am, 25 mg/kg body weight), anti-CTLA4, amlexanox + anti-CTLA4, or vehicle (DMSO) and IgG isotype controls (n=8 per genotype). d-g, Tumor growth curves (d), summary of day 22 tumor mass (e), and flow cytometric analysis of IFNγ- and granzyme B (GzmB)-producing tumor-infiltrating CD4 and CD8 T cells presented as representative plots (f) and summary graphs (g) of LLC-injected wildtype B6 mice treated with anti-CTLA4 or an IgG isotype control (i.p., on day 3, 6, and 9), amlexanox or DMSO solvent control (at tumor site or intratumorally, from day 1 to 22). n = 7 mice per group. h, Immunoblot analysis of the indicated phosphorylated (p-) or total proteins in whole-cell lysates of tumor cells (CD45–) or tumor-infiltrating immune cells (CD45+) isolated from day 22 tumor of the LLC-implanted mice treated with as indicated. Data are representative of three independent experiments, and bar graphs are presented as mean±s.d. Two-sided unpaired Student’s t-test (c), One-way ANOVA with Bonferroni correction (e,g), Two-way ANOVA with Bonferroni correction (d). Source data for graphs are provided in Statistical Source Data Fig. 6 and unprocessed blots are shown in Unprocessed Blots Fig. 6.
We next employed a syngeneic mouse lung cancer model based on implantation of Lewis lung carcinoma (LLC) cells. Treatment of the tumor-bearing mice with either amlexanox or anti-CTLA4 caused significant suppression of LLC tumor growth (Fig. 6d,e). Furthermore, amlexanox synergized with anti-CTLA4 in the induction of tumor rejection (Fig. 6d,e). Both amlexanox and anti-CTLA4 increased the frequency of IFN-γ-producing CD4 effector T cells, and these two agents also synergized in the induction of CD4 effector cells (Fig. 6f,g). Notably, amlexanox was more potent than anti-CTLA4 for the induction of CD8 effector T cells producing IFNγ and Granzyme B (Fig. 6f,g). Previous studies suggest that amlexanox binds to certain S100 proteins and inhibits EGFR phosphorylation34, 35,36. We found that when administered in vivo, neither amlexanox nor amlexanox plus anti-CTLA4 had an appreciable effect on tyrosine phosphorylation of EGFR or its downstream target STAT5 in tumor cells (Fig. 6h). Amlexanox is also known to downregulate the expression of S100A6 in KMT2A/AFF1-positive acute lymphoblastic leukemia (ALL) cells37; however, amlexanox-mediated in vivo LLC tumor inhibition did not involve alteration of S1006 expression level in tumor cells or tumor-infiltrating immune cells (Fig. 6h). These results suggest that the TBK1 pharmacological inhibitor amlexanox suppresses tumor growth and also promotes antitumor immunity.
TBK1/TBKBP1 signaling axis is involved in tumor-mediated immunosuppression
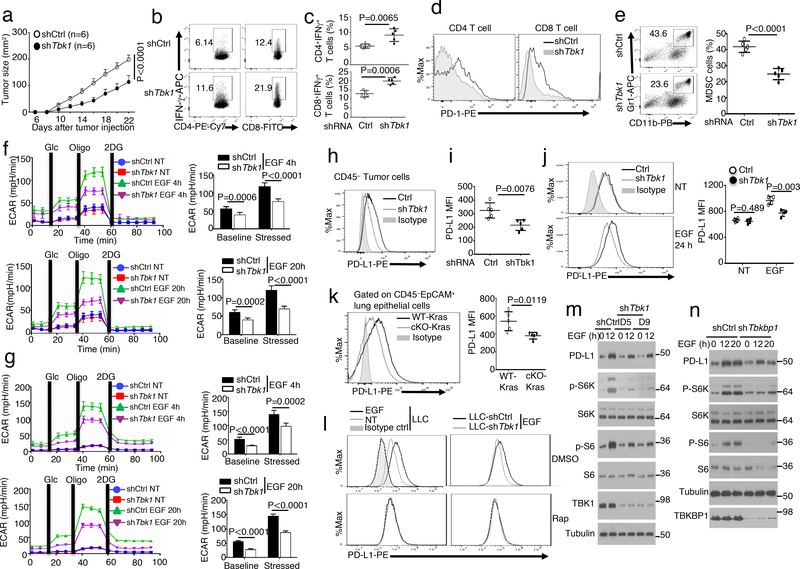
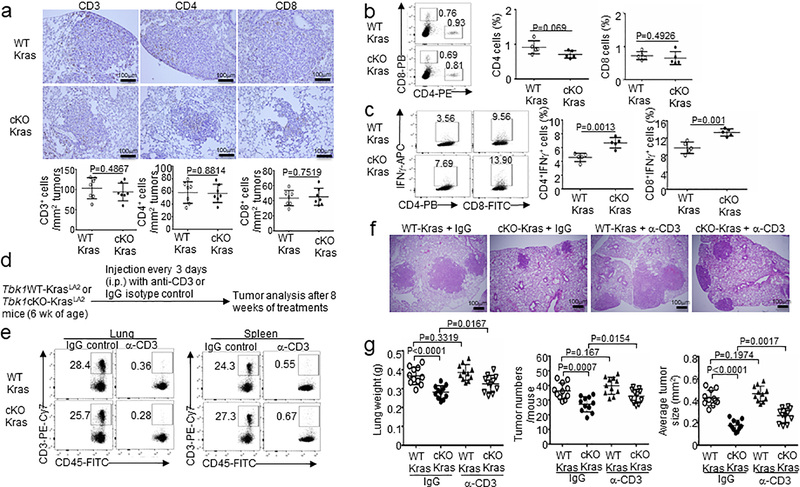
Oncogenic growth factor receptors contribute to tumor-mediated immunosuppressive function, although the downstream signaling factors are still poorly defined32, 38–40. We found that although Tbk1WT-KrasLA2 and Tbk1cKO-KrasLA2 mice had similar frequencies of T cells in lung tissues, T cells derived from the Tbk1cKO-KrasLA2 mouse lung contained a profoundly higher frequency of IFNγ-producing CD4 and CD8 effector T cells, suggesting a role of TBK1 in immunosuppression (Extended Data Fig. 7a–c). Antibody-mediated T cell depletion in Tbk1WT-KrasLA2 mice did not significantly affect tumor load (Extended Data Fig. 7f,g), probably due to the poor immunogenicity of the Kras tumor model31–33. However, T cell depletion in Tbk1cKO-KrasLA2 mice caused a significant increase in tumor number and size (Extended Data Fig. 7f,g), which was in line with the stronger effector T cell response in these mutant animals (Extended Data Fig. 7c). Tbk1 knockdown in LLC cells also profoundly suppressed tumor growth when implanted into the immunocompetent B6 mice (Fig. 7a). The tumors of Tbk1-knockdown LLCs contained significantly higher frequencies of IFNγ-producing CD4 and CD8 effector T cells than the tumors derived from control shRNA-transduced LLC cells, further emphasizing a tumor-specific role of TBK1 in regulating immunosuppression (Fig. 7b,c). Interestingly, T cells infiltrating the Tbk1-knockdown LLC tumor expressed reduced levels of the checkpoint receptor PD1, indicative of reduced exhaustion (Fig. 7d). Moreover, the tumors derived from Tbk1-knockdown LLC cells also contained reduced frequencies of myeloid derived suppressor cells (MDSCs) (Fig. 7e). These results suggest that Tbk1 knockdown in tumor cells reduces the level of immunosuppression in tumor microenvironment, resulting in stronger antitumor immunity.
Figure 7.
TBK1 and TBKBP1 regulate tumor-mediated immunosuppression by facilitating EGF-induced PD-L1 expression. a, Tumor growth curves of WT C57BL/6 mice injected with control or Tbk1-knockdown LLC (Lewis lung carcinoma) cells (n = 6 mice per group). b,c, Flow cytometric analysis of the frequency of IFNγ-producing CD4 and CD8 effector T cells in the tumors of WT C57BL/6 mice injected with control or Tbk1-knockdown LLC cells (day 22 after injection), presented as representative plots (b) and summary graphs (c). n = 5 mice per group. d,e, Flow cytometric analysis of cell surface expression of PD-1 in CD4 and CD8 T cells (d) or Gr-1+CD11b+ MDSCs (e) from the tumors of WT C57BL/6 mice injected with control or Tbk1-knockdown LLC cells (n = 5 mice per group). f,g, Seahorse analysis of extracellular acidification rate (ECAR) under baseline (glucose injection) and stressed (oligomycin injection) conditions in serum-starved LLC (f) or A549 (g) cells that were either not treated (NT) or stimulated with EGF for 4 h or 20 h. Data are presented as a representative plot (left) and summary graphs (right). n = 6 per group. h,i, Flow cytometric analysis of cell surface expression of PD-L1 in tumor cells from the tumors of WT C57BL/6 mice injected with control or Tbk1-knockdown LLC cells. n = 5(h) or 4(i) per group. j-k, Flow cytometric analysis of PD-L1 expression in control or Tbk1-knockdown LLC cells either not treated (NT) or stimulated with EGF for 24 h (j) and in lung epithelial cells derived from Tbk1WT-KrasLA2 and Tbk1cKO-KrasLA2 mice (k). n = 5 mice per group. Data are presented as a representative plots (left) and summary graphs (right). l, Flow cytometric analysis of PD-L1 expression in LLC cells that were either not treated (NT) or stimulated for 24 h with EGF in the presence of the mTORC1 inhibitor rapamycin (Rap) or solvent control DMSO. m,n, Immunoblot analysis of the indicated phosphorylated (p-) and total proteins in whole-cell lysates of A549 cells stably infected with a control shRNA or Tbk1-specific shRNAs (m) and Tbkbp1 (n), stimulated with EGF. Data are representative of three independent experiments, and bar graphs are presented as mean±s.d. Two-way ANOVA with Bonferroni correction (a), Two-sided unpaired Student’s t-test (c,e,f,g,i-k). Source data for graphs are provided in Statistical Source Data Fig. 7 and unprocessed blots are shown in Unprocessed Blots Fig. 7.
Cancer cell glycolysis is an important mechanism of immunosuppression, which stimulates tumor-infiltrating MDSCs and inhibits antitumor effector T cell function and also contributes to PD1 induction in tumor-infiltrating T cells41, 42,43. Seahorse Extracellular Flux analysis revealed that while serum-starved LLC cells had minimal extracellular acidification rate (ECAR), a reliable indicator of glycolysis44, they displayed strong ECAR when stimulated with EGF (Fig. 7f). Moreover, TBK1 knockdown in LLC cells significantly reduced both baseline ECAR and stressed ECAR (maximum glycolytic capacity) (Fig. 7f). Similar results were obtained with the human A549 lung cancer cells (Fig. 7g). These results demonstrate TBK1 as a crucial regulator of glycolytic metabolism in cancer cells and provide insight into the mechanism by which TBK1 facilitates tumor-mediated immunosuppression.
Tumor-mediated immunosuppression also involves expression of PD1 ligand 1 (PD-L1), which binds to PD1 on effector T cells to induce T cell exhaustion45. While the Tbk1-competent LLC tumor cells displayed surface expression of PD-L1, the Tbk1-knockdown LLC tumor cells had much lower levels of PD-L1 (Fig. 7h,i). PD-L1 expression in tumor cells can be stimulated by the cytokine IFNγ and oncogene expression or tumor suppressor loss32, 46–48. We found that TBK1 knockdown largely blocked the induction of PD-L1 expression in EGF-treated LLC cells (Fig. 7j). Furthermore, flow cytometry detected surface expression of PD-L1 in lung epithelial cells from Tbk1WT-KrasLA2 mice, which was markedly reduced in the lung epithelial cells of Tbk1cKO-KrasLA2 mice (Fig. 7k). Consistent with the role of TBK1 in mediating mTORC1 activation, an mTORC1 inhibitor, rapamycin, inhibited EGF-stimulated surface expression of PD-L1 in WT LLC cells and erased the differences in PD-L1 expression between WT and Tbk1-knockdown LLC cells (Fig. 7l). Immunoblot assays also revealed that knockdown of either TBK1 or TBKBP1 severely attenuated the induction of total cellular PD-L1 by EGF (Fig. 7m,n). Taken together, these results suggest that TBK1-TBKBP1 signaling axis is involved in tumor-mediated immunosuppression.
Discussion
In this study, we identified TBK1 and its adaptor TBKBP1 as central components of growth factor receptor signaling. TBKBP1 enables TBK1 responses to growth factors by connecting TBK1 to upstream regulators, including PKCθ and the scaffold protein CARD10. We obtained in vivo evidence that the TBK1/TBKBP1 signaling axis plays a crucial role in mediating mTORC1 activation and tumorigenesis but is dispensable for IFN-I induction. Since growth factor signaling plays a crucial role in oncogenesis, including Kras-induced tumorigenesis18–20,49, our data suggest that growth factor-induced TBK1-mTORC1 pathway may synergize with oncogenic Kras in the induction of lung tumorigenesis.
A recent study suggests that TBK1 mediates mTORC1 activation in immortalized MEFs stimulated by EGF, but not by insulin8. Interestingly, we found that in human lung cancer cell lines and murine primary lung epithelial cells, TBK1 was required for mTORC1 activation by several growth factors, including EGF, insulin, and FBS, suggesting a general role of TBK1 in regulating growth factor-stimulated mTORC1 activation. In line with the previous study8, we found that TBK1 was also required for TLR-stimulated mTORC1 activation in MEFs. However, we found that TBK1 was dispensable for TLR-stimulated mTORC1 activation in lung cancer cell lines, primary lung epithelial cells, and BMDMs. These findings suggest that the function of TBK1 in mTORC1 regulation is cell type- and stimulus-dependent. Our data demonstrated that the TBK1 physically associates with mTORC1 in response to EGF stimulation. Using an unbiased protein-protein interaction screening approach, BioID, we identified Raptor as one of the major TBK1-binding proteins. TBK1 interacted with Raptor but not Rictor, thus providing mechanistic insight into the selective interaction of TBK1 with mTORC1.
TBK1 has also been shown to target the activation of AKT, which may in turn contribute to the activation of mTORC15, 6, 22. Our data suggest that the role of TBK1 in mediating AKT activation is cell type-specific. Although TBK1 deficiency partially inhibited EGF-stimulated AKT activation in MEFs, it did not affect AKT activation in human lung cancer cell lines and murine primary lung epithelial cells. Similarly, TBK1 was dispensable for LPS-stimulated AKT activation in lung cancer cell lines, primary lung epithelial cells, and BMDMs, but was required for LPS-stimulated AKT activation in MEFs. Notably, TBK1 was required for growth factor-stimulated mTORC1 activation in all cell types analyzed, suggesting that TBK1 may regulate mTORC1 via both AKT-dependent and independent mechanisms.
PRR-stimulated TBK1 activation is dependent on TRAFs, particularly TRAF310, 11, but how TBK1 is activated by growth factors has remained elusive. We obtained biochemical and genetic evidence that growth factor-stimulated TBK1 activation relied on a specific member of the PKC family, PKCθ, which phosphorylates TBK1 at S716, thereby promoting TBK1 autophosphorylation at S172. TBK1 is known to interact with several adaptor proteins, TANK, NAP1, and TBKBP1, via a specific TBK-binding motif14. We found that TBKBP1, but not TANK or NAP1, served as a specific adaptor of TBK1 mediating growth factor-stimulated TBK1 activation and function. TBKBP1 deficiency had no effect on TBK1 activation or IFN-I induction by PRR ligands but attenuated TBK1 activation stimulated by EGF, insulin, and FBS. The specificity of TBKBP1 function appears to rely on its interaction with the scaffold protein CARD10. While TBKBP1 was constitutively associated with TBK1, TBKBP1 interacted with CARD10 inducibly in response to grow factor stimulation and recruits TBK1 to CARD10. CARD10 in turn was required for growth factor-induced binding of TBK1 to an upstream kinase, PKCθ. Since CARD10 also interacted with PKCθ, it is logical to propose that growth factor-stimulated TBK1 activation involves TBKBP1- and CARD10-dependent recruitment of TBK1 to PKCθ.
PD-L1 expression on tumor cells critically contributes to immunosuppression. In addition to the cytokine IFNγ, growth factors are strong inducers of PD-L1 expression in tumor cells32, 40, 50. Our data suggest that the TBK1-TBKBP1 axis mediates PD-L1 induction by growth factors, which involves the mTORC1 pathway. This function of TBK1 likely contributes to tumor-mediated immunosuppression. We found that T cells infiltrating the TBK1-deficient tumors also had reduced PD1 expression compared to those infiltrating TBK1-competent tumors, suggesting a role for tumor-specific TBK1 in regulating T cell exhaustion. Moreover, the TBK1-deficient tumors had reduced infiltration of MDSCs. Consistent with these phenotypes, we found that TBK1 was crucial for cancer cell glycolysis, another important mechanism of immunosuppression. Cancer cell glycolysis is known to impair effector T cell functions and stimulate tumor-infiltrating myeloid-derived suppressor cells (MDSCs) in tumor microenvironment and also contribute to the induction of PD1 expression and functional exhaustion of tumor-infiltrating T cells41–43. Collectively, these results emphasize the role of TBK1 in mediating both tumor growth and tumor-mediated immunosuppression, highlighting the importance of TBKBP1/TBK1 axis in cancer immunotherapy.
Methods
Mice
Tbk1-flox mice were generated in B6 × 129 mixed genetic background51 and further backcrossed to B6 background for 4 generations. These mice were were crossed with mice expressing Cre recombinase driven by the Clara cell secretory protein (Ccsp-Cre)52 (in B6 × 129 mixed genetic background, provided by Francesco J DeMayo, Baylor College of Medicine) to generate lung epithelial cell conditional Tbk1 knockout (Tbk1 cKO, Tbk1fl/flCcsp-Cre) and WT control (Tbk1+/+Ccsp-Cre) mice. The Tbk1 cKO mice were then crossed with transgenic mice expressing an oncogenic form of Kras (KrasLA2, in B6 × 129 genetic background)21. Heterozygous (Tbk1+/flCcsp-Cre-KrasLA2) mice were bred to generate age matched Tbk1fl/fl Ccsp-Cre-KrasLA2 and Tbk1+/+ Ccsp-Cre-KrasLA2 mice for experiments. Tbkbp1-flox mice (in B6 genetic background), described previously53, were crossed with Ccsp-Cre to generate Tbkbp1 lung epithelial cell-conditional KO (Tbkbp1 cKO; Tbkbp1fl/flCcsp-Cre) mice. KrasLA2 mice were crossed with Tbkbp1fl/flCcsp-Cre mice to generate Tbkbp1+/flCcsp-Cre-KrasLA2 heterozygous mice, which were further bred to generate age-matched Tbkbp1fl/flCcsp-Cre-KrasLA2 and Tbkbp1+/+Ccsp-Cre-KrasLA2 mice. Tank KO mice (in B6 × 129 mixed genetic background) were provided by Shizuo Akira (Osaka University)16. Genotyping PCR primers are listed in Supplementary Table 2. Mice were maintained in a specific pathogen–free facility, and all animal experiments were conducted in accordance with protocols approved by the Institutional Animal Care and Use Committee of the University of Texas MD Anderson Cancer Center. The study is compliant with all relevant ethical regulations regarding animal research.
Plasmids
The retroviral vector pCLXSN(GFP) was created by replacing the neomycin-resistant gene with the green fluorescence protein (GFP) gene in pCLXSN54. pCLXSN(GFP)-HA-Tbkbp1 was generated by inserting the mouse Tbkbp1 cDNA, along with an N-terminal HA tag, into the pCLXSN(GFP) retroviral vector. The HA-TBK1 plasmid was generously provided by Dr. Fanxiu Zhu (Florida State University). The TBK1 point mutants S716A and S716E were created by site-directed mutagenesis. The wildtype HA-TBK1 as well as the point mutants were cloned into the pCLXSN(GFP) vector. pCLXSN(GFP)-Myc-BioID-TBK1 was generated by inserting human TBK1 cDNA into the pCLXSN(GFP)-Myc-BioID vector55. pGEX-4T-TBK1(635–729) and pGEX-4T-TBK1 (635–729) S716A were generated by inserting a cDNA fragment encoding amino acids 635–729 of WT TBK1 and TBK1 S716A, respectively, into the pGEX-4T vector. Flag-tagged TBK1 were provided by Dr. Chen Wang (Shanghai Institutes for Biological Sciences). pBabe-HA-Kras-G12D, pLA CMV-HA RALB, pRK5-HA-Raptor and pRK-5-Myc-Rictor were purchased from Addgene. FLAG-tagged human CARD10 (CARMA3) was provided by Dr Xin Lin (Tsinghua University). pGIPZ lentiviral vectors encoding shRNAs silencing TBKBP1, TANK, NAP1, CARD10, BCL10, MALT1, PKCε, PKCθ, TRAF6 and a nonsilencing control shRNA were purchased from Thermo Fisher Scientific. pLKO.1 lentiviral vectors encoding shRNAs silencing hTBK1, mTBK1, and a nonsilencing control shRNA were purchased from Sigma-Aldrich.
Antibodies and reagents
Polyclonal antibody for phospho-TBK1 S716 was custom made by Pacific Immunology Corp. using a synthetic peptide, ILERFG(pS)LTMDGG (pS indicates phosphorylated S716), covering amino acids 710–722 of TBK1 (identical in human, mouse, and rat TBK1). Antibodies for phospho-TBK1 S172 (5483), TBK1 (3013), phospho-AKT S473 (9271), phospho-AKT T308 (13038), AKT (9272), α-Tubulin (2144), mTOR (2972), and TBKBP1 (8605), Phospho-p70 S6K T389 (9206), Phospho-p70 S6K T421/S424 (9204), p70 S6K (9202), S6 (2317), Phospho-S6 S235/236 (3945), phospho-mTOR S2448 (2971), phospho-mTOR S24481 (2974), phospho-4E-BP1T37/46 (2855), 4E-BP1(9644), phospho-ERK T202/Y204 (4370), Phospho-PKC (pan) βII S660 (9371), Phospho-PKCθ T538 (9377), PKCθ (13643), Rictor (2114), Raptor (2280), Myc (2276), TANK (2141), TRAF6 (8028), IκBα (4814), Phospho-IκBα S32/36 (9246), NF-κB p65 (8242), Phospho-NF-κB p65 S536 (3033), c-Rel (12707) and p105/p50 (13586), S100A6 (13162), Stat5 (94205) and Phospho-Stat5 (9359) were from Cell Signaling Technology. PKC (sc-10800), BCL10 (sc-9560), MALT1 (sc-28246), EGFR (sc-03), Phospho-EGFR (sc-12351), and Lamin B (sc-6216) were from Santa Cruz Biotechnology. Nap1 (ab192253) and CARD10 (ab137383) were from Abcam. Horseradish peroxidase–conjugated anti-HA antibody (3F10) and anti-HA antibody (12CA5) was purchased from Roche. Horseradish peroxidase–conjugated anti-Flag antibody (M2) were purchased from Sigma-Aldrich. Horseradish peroxidase–conjugated anti-c-Myc (MCA2200P) was from Bio-Rad. Horseradish Peroxidase-conjugated Donkey anti-mouse IgG (715–035-151), Horseradish Peroxidase-conjugated Goat anti-mouse IgG light chain (115–035-174), Horseradish Peroxidase-conjugated Donkey anti-rabbit IgG (711–035-152) and Horseradish Peroxidase-conjugated Mouse anti-rabbit IgG light chain(211–032-171) were purchased from Jackson ImmunoResearch.
Antibodies used for IHC, including anti-CD3ε (99940), anti-CD4 (25229), and anti-CD8α (98941), were from Cell Signaling Technology. Fluorescence-labeled antibodies for murine (m) CD4 (GK1.5), mCD8 (53–6.7), mCD45.2 (104), CD11b (M1/70), Gr1 (RB6–8C5), PD-1 (J43), PD-L1 (MIH5), Granzyme B (NGZB) and IFN-γ (XMG1.2) were purchased from eBioscience. FITC Annexin-V Apoptosis Detection Kit (556547) was from BD Bioscience, Monensin was from eBioscience (00–4505–51). Rapamycin (37094), PMA (P1585) and Ionomycin (I0634) were from Sigma-Aldrich. Recombinant Human EGF Protein or Recombinant Mouse EGF Protein were from R&D systems. PKC inhibitor Sotrastaurin was from Selleck, and the TBK1 inhibitor amlexanox was from Cayman. Detailed information of antibodies is provided in Supplementary Table 3.
Assessment of Lung Tumor development in KrasLA2 tumor model
Tbk1cKO-KrasLA2 and Tbk1WT-KrasLA2 mice were maintained in a specific pathogen-free facility and monitored every week for the indicated time period to calculate survival rate. For histological analysis, lungs from aged-matched Tbk1cKO-KrasLA2 and WT-KrasLA2 mice (4 mon old) were fixed in 10% neutral buffered formalin, embedded in paraffin, and sectioned for hematoxylin-eosin (H&E) staining or IHC assays. H&E-stained lung tissue slides were analyzed for tumor numbers and size. IHC assays were performed with antibodies against CD3ε (1:150 dilution), CD4 (1:200 dilution) and CD8α (1: 800 dilution). The slides were evaluated independently using microscopy. Whole-cell lysates from the lung were also prepared and subjected to immunoblot analysis.
For T cell depletion experiments, 6-week-old Tbk1cKO-KrasLA2 and Tbk1WT-KrasLA2 mice were administered i.p. with anti-mouse CD3ε (BP0001–1, BioXcell) or isotype control (BP0091, BioXcell) at the dose of 150 μg per mouse every 3 days. After 8 weeks of treatment (or at the age of 14 weeks), the mice were sacrificed for flow cytometric analysis of T cell depletion in lung and spleen and for histological analysis of tumor load by H&E staining. In some experiments, the Tbk1WT-KrasLA2 mice were administered i.p. with 100 μg anti-CTLA4 (clone 9H10, BioXcell) or isotype control (BE0087, BioXcell) twice weekly for 10 weeks. The mice were also injected i.p. with a TBK1 inhibitor, amlexanox (25 mg per kg), or solvent control DMSO daily from 6 weeks to 16 weeks.
Isolation of mouse lung cells
Following perfusion with PBS, the lung lobes were removed, diced, and digested with collagenase/dispase at 37°C for 45 minutes. The digests were washed and resuspended in medium. The cell suspension was filtered and collected by centrifugation at 130 g for 8 min. The cells were incubated with anti-CD45 MicroBeads (Miltenyl) to deplete leukocytes.
Cell stimulation, immunoblot and coIP assays
Purified mouse primary lung cells and human lung cancer cell lines were stimulated with the indicated inducers. Whole-cell lysates were prepared and subjected to immunoblot and coIP assays as described previously56. For cell stimulation in the presence of kinase inhibitors, the cells were preincubated for 30 min with the inhibitors before the addition of stimulators.
In vitro kinase assay
293T cells were transfected with Myc-PKCθ, After 48 h, cells were lysed in a lysis buffer, containing 20mM Hepes (pH 7.6), 250 mM NaCl, 0.5% Nonidet P-40, 20 mM β-glycerophosphate,1 mM EDTA, 20 mM p-nitrophenyl phosphate, 0.1 mM Na3VO4, 1 mM dithiothreitol, 1 mM phenylmethylsulfonyl fluoride, and protease inhibitor cocktail (P8340, Sigma-Aldrich). Myc-PKCθ was isolated by IP using anti-Myc antibody. The IP samples were washed three times with lysis buffer, once with lysis buffer supplemented with 1 M urea, and twice with a kinase buffer (20 mM Hepes, pH 7.6, 20 mM MgCl2, 20 mM β-glycerophosphate, 1 mM EDTA, 2 mM p-nitrophenyl phosphate, and 2 mM dithiothreitol). GST-TBK1(635–729) and the mutant GST-TBK1(635–729) S716A, expressed and purified from E. coli, were used as substrates. Kinase activity was assayed in 20 μM ATP, (1–10 μCi) [γ−32P]ATP, 2 mM DTT, 1μg GST kinase substrate and kinase buffer at 30 °C for 30 min. The kinase reaction was stopped by adding SDS loading buffer.
Screening of TBK1-interacting proteins by BioID
HEK293 cells were transduced with pCLXSN(GFP)-Myc-BioID-TBK1 or the control vector pCLXSN-Myc-BioID. The cells were cultured in biotin-supplemented medium for 12 h and then subjected to BioID screening, as described55. TBK1-interacting proteins were identified by mass spectrometry at the Mass Spectrometry Proteomics Core of Baylor College of Medicine.
Flow cytometry and Intracellular cytokine staining
Suspensions of tumor cells were prepared as described previously57. The cells were stained with the indicated fluorescence-conjugated antibodies and subjected to flow cytometry analysis as described using LSR II (BD). Mononuclear cells were isolated from tumor tissues of the indicated mice, stimulated in vitro with PMA plus ionomycin in the presence of monensin, and then subjected to intracellular cytokine staining to detect T cells producing IFNγ and Granzyme B.
Cell culture, viral transduction, and overexpression
For gene silencing, lentiviral particles were prepared by transfecting HEK293 cells with pLKO.1 or pGIPZ lentiviral vectors encoding specific shRNAs or control shRNAs along with packaging plasmids. The packaged viruses were then used to infect the indicated cells, followed by selection of the infected cells by puromycin (1 μg/ml) for 7 d (for the pLKO.1 vector) or by sorting GFP+ cells (for the pGIPZ vector, which carries the GFP gene). For overexpression studies, the cells were infected with retroviral vectors for the indicated cDNAs.
Real-time quantitative RT-PCR
RNA was extracted with TRIzol reagent from the indicated cells and subjected to real-time quantitative RT-PCR assays using the SYBR regent (Bio-Rad). The relative expression of the indicated genes was calculated using a standard curve method and was normalized to the expression of Actb. Gene-specific primer sets were listed in Supplementary Table 2.
MTT assays
Cells were seeded in 96-well plates at a density of 2,000 cells/well in 200 μl Dulbecco’s modified Eagle medium containing 10% FBS, and at the indicated time points, 50 μl of MTT solution (dissolved at 5 mg/mL in sterile PBS), was added to each well. After 3 h of incubation, the media was removed and replaced with MTT solvent, and the plates were placed on a shaking table for 15 min to thoroughly mix the formazan into the solvent. The absorbance was measured at 590 nm.
Xenograft tumor model in nude mice
Human A549 lung cancer cells (5×10⁶ cells/per mice) were injected s.c. into the flank of nude mice, and the challenged mice were monitored for tumor growth for the indicated time periods. Tumor size measured every two days and presented as length x width (mm2).
Syngeneic tumor models
WT C57BL/6 mice (8-week old) were injected s.c. with 5×10⁵ murine LLC cells, and the tumor-bearing mice were injected i.p. with anti-CTLA4 (clone 9H10, BioXcell) or IgG isotype control on days 3, 6, and 9 using doses of 150 μg for the initial injection and 100 μg for subsequent injections. Where indicated, the TBK1 inhibitor amlexanox (25 mg/kg body weight) or solvent control DMSO was injected daily into the tumor site during early days post tumor injection and intratumorally when tumor became visible (around day 6) for a total of 22 days. The treated mice were monitored for tumor growth with tumor size determined by length x width (mm2). Mice with tumor size reaching 225mm2 were sacrificed (considered lethal) based on the protocol approved by the Institutional Animal Care and Use Committee of the University of Texas MD Anderson. To minimize individual variations, age- and sex-matched mice were used. For analysis of tumor cells and tumor-infiltrating immune cells, the LLC tumors were dissected, manually dissociated, and digested enzymatically with collagenase (Roche) and DNase I (Roche) in RPMI-1640 for 30 min at 37°C with intermittent inversion. Single cell suspensions were prepared by filtering the digested tumor tissues and subsequently incubated with anti-mCD45-conjugated magnetic beads (Miltenyi) for isolating CD45+ immune cells and CD45– tumor cells.
In some experiments, the LLC cells were transduced with pGIPZ lentiviral vectors encoding Tbk1-specific shRNAs or a control nonsilencing shRNA. After selection and validation of successful TBK1 knockdown, the cells were used for syngeneic tumor models described above.
Metabolic assays
ECAR was measured with an XF96 extracellular flux analyzer (Agilent Technologies) following the manufacturer’s instructions. Control or Tbk1-knockdown A549 cells were seeded in XF96 microplates at a density of 5×10⁴ cells per well. The cells were either not treated or stimulated with EGF for 4 h or 20 h after starvation in serum-free media for 12h. Cells were resuspended to warn assay medium (Agilent Technologies), and the cell culture microplate was placed into a 37 °C non-CO2 incubator for 30 min. The cells were subjected to glycolysis assays with an XF glycolysis stress test kit (103020–100, Agilent Technologies). Initial measurement of ECAR was done when cells were incubated in a glycolysis stress test medium without glucose to record the baseline. Glucose (10 mM) was then injected to induce ECAR, reflecting glycolysis rate under basal conditions. Subsequently, oligomycin (1 μM) was injected to inhibit mitochondrial ATP production, thereby measuring the maximum glycolytic capacity (also called stressed ECAR). Finally, a glucose analog, 2-deoxyglucose (100 mM), was injected to inhibit glycolysis through targeting glucose hexokinase, resulting in decreased ECAR that served as a measure to confirm the glycolysis dependence of the detected ECAR.
Statistical and reproducibility
Statistical analysis was performed using Prism software (GraphPad Software 6.0). The Kolmogorov–Smirnov test was used to tests for normal distribution of the data. If the samples were normally distributed, unpaired two-tailed Student’s t-test was used to determine the statistical difference between two groups. For comparison of more than two groups, one-way ANOVA followed by Bonferroni multiple comparisons post-test were performed. Two-way ANOVA with Bonferroni multiple comparison test was used for tumor growth. Kaplan-Meier analyses was used and the log-rank Mantel-Cox test was employed to determine any statistical difference between the survival curves of two groups. All data are presented as mean ± SD. A p value less than 0.05 was considered statistically significant. Each experiment was repeated independently with similar results. The number of animals, number of independent experiments, and methods of statistical tests used are indicated for each experiment in the figure legends.
Data availability
The source data for Figs. 1e–g,I,k, 3i,j, 4k,l, 6c–e,g, 7a,c,e–g,i–k and Supplementary Figs. 1b–e, 7a–c,g are provided as Supplementary Table 4, and unprocessed blots are shown in Unprocessed Blots Figs. 1–7 and Extended Data Figs. 1–6. The mass spectrometry data have been deposited to the ProteomeXchange Consortium (http://proteomecentral.proteomexchange.org/cgi/GetDataset) via the MASSIVE repository (MSV000084505) with the dataset identifier PXD016025. All other data supporting the findings of this study are available from the corresponding author on reasonable request.
Extended Data
Extended Data Fig. 1. TBKBP1 is not required for TBK1 activation or type I IFN induction by TLR ligands and viruses.
a, Immunoblot analysis of the indicated phosphorylated (P-) and total proteins in whole-cell lysates of A549 cells stably infected with a control shRNA or a Tbkbp1-specific shRNA, stimulated with the indicated inducers. b-e, qRT-PCR analysis of Ifna and Ifnb mRNA expression in A549 cells stably infected with a control shRNA (shCtrl) or shRNAs for Tbk1 (b,c) or Tbkbp1 (d,e), stimulated with the indicated inducers. Data are representative of three independent experiments. n = 3 (b,d,e) or 5 (c) per group. Two-sided unpaired Student’s t-test (b-e). Source data for graphs are provided in Statistical Source Data Fig. 1 and unprocessed blots are shown in Unprocessed Blots Fig. 1.
Extended Data Fig. 2. TBK1, but not IKKε, mediates growth factor-stimulated mTORC1 activation.
a, Immunoblot analysis of the indicated phosphorylated (p-) and total proteins in whole-cell lysates of freshly isolated lung cells from Tbk1WT-KrasLA2 and Tbk1cKO-KrasLA2 mice. b-e, Immunoblot analysis of the indicated phosphorylated (p-) and total proteins in whole-cell lysates of control or Tbk1-knockdown H157 (b), H460 (c), or A549 (d,e) cells, stimulated with the indicated inducers. f, g, Immunoblot analysis of the indicated phosphorylated (p-) and total proteins in whole-cell lysates of WT or Tbk1-deficient primary MEF cells stimulated by EGF (f) or essential amino acids (EAAs, g). h, Immunoblot analysis of the indicated proteins in the cytoplasmic extracts (Cyt Ext) or nuclear extracts (Nucl Ext) of control or Tbk1-knockdown A549 cells, stimulated with EGF. i, Immunoblot analysis of the indicated phosphorylated (p-) and total proteins in whole-cell lysates of EGF-stimulated A549 cells stably infected with a control shRNA (shCtrl) or two different IKKe-specific shRNAs. Data are representative of three independent experiments. Unprocessed blots are shown in Unprocessed Blots Fig. 2.
Extended Data Fig. 3. TBK1 mediates mTORC1 activation by EGF and has cell type-specific functions in mTORC1 activation by TLR ligands.
a, Immunoblot analysis of the indicated phosphorylated (p-) and total proteins in whole-cell lysates of A549 cells stably infected with a control shRNA (Ctrl) or two different Tbk1-specific shRNAs (D5 and D9), stimulated with Pam3Csk4. b-h, Immunoblot analysis of the indicated phosphorylated (p-) and total proteins in whole-cell lysates of primary lung cells from WT and Tbk1cKO mice (b),Tbk1WT-KrasLA2 (WT-Kras) and Tbk1cKO-KrasLA2 (cKO-Kras) mice (c,d), bone marrow-derived macrophages (BMDM) from WT or Tbk1 myeloid cell-conditional KO (MKO) mice (e,f), or WT and Tbk1 KO primary MEFs (g,h), stimulated with the indicated TLR ligands. Data are representative of three independent experiments. Unprocessed blots are shown in Unprocessed Blots Fig. 3.
Extended Data Fig. 4. TBK1 is associated with mTORC1 via Raptor.
a, Schematic of Myc-BioID (Myc-tagged BirA R118G) and Myc-BioID-TBK1 constructs cloned into the pCLXSN(GFP) retroviral vector. b, Scatter plot showing several known TBK1-binding proteins and a novel TBK1-binding protein, Raptor (also called RPTOR) identified by BioID screening. c,d, Immunoblot analysis of Raptor and Rictor pulled down by TBK1 IP (c, upper) or mTOR and TBK1 pulled down by Rictor IP (d, upper), with protein expression being monitored by direct immunoblot assays (lower), using whole-cell lysates of HEK293 cells transfected with the indicated expression vectors. e, Co-IP analysis of endogenous TBK1-Raptor and TBK1-Rictor interactions in EGF-stimulated A549 cells (upper). IgG was used as a negative control for IP. f,g, Co-IP analysis of TBK1-mTORC1 interactions (upper) and direct immunoblot analyses of the indicated proteins (lower) in control or Tbk1-knockdown A549 cells stimulated with EGF. The Lysates were subjected to IP with antibody against TBK1 (f) or Raptor (g). Data are representative of three independent experiments. Unprocessed blots are shown in Unprocessed Blots Fig. 4.
Extended Data Fig. 5. TANK and NAP1 are dispensable for EGF-induced mTORC1 activation.
a-d, Immunoblot analysis of the indicated phosphorylated (p-) and total proteins in whole-cell lysates of A549 cells stably infected with a control shRNA (shCtrl) or shRNAs specific for Tank (a), Nap1 (b), or Tbkbp1 (c,d), stimulated with the indicated inducers. e,f, Genotyping PCR (e) and immunoblot (f) analyses of Tbkbp1+/+Ccsp-Cre (WT), Tbkbp1+/flCcsp-Cre (Het), and Tbkbp1fl/flCcsp-Cre (cKO) mice, showing the flox and WT Tbk1 alleles and Ccsp-Cre (e) and the TBKBP1 protein expression (f). Data are representative of three independent experiments. Unprocessed blots are shown in Unprocessed Blots Fig 5.
Extended Data Fig. 6. Role of TRAFs and PKC in TBK1 phosphorylation and activation.
a,b, Immunoblot analysis of the indicated phosphorylated (p-) and total proteins in whole-cell lysates of EGF-stimulated A549 cells stably infected with a control shRNA (shCtrl) or two different shRNAs targeting Traf6 (a) or Traf3 (b). c,d, Immunoblot analysis of the indicated phosphorylated (p-) and total proteins in whole-cell lysates of A549 cells stimulated with EGF in the presence of the PKC inhibitor GF109203X or solvent control DMSO. e, Immunoblot analysis of the indicated phosphorylated (p-) and total proteins in whole-cell lysates of control or PKCe-knockdown A549 cells, stimulated with EGF for the indicated time periods. f,g, Immunoblot analysis of T538-phosphorylated (p-) and total PKCq in the lysates of A549 cells stimulated with insulin (f) or FBS (g). h,i, immunoblot analysis of TBK1 and S172- or S716-phosphorylated (p-) TBK1 following HA IP from A549 cells stably transduced with HA-TBK1 and stimulated with either EGF (h) or Insulin (i). j, Immunoblot analysis of S172-phosphorylated (p-) and total TBK1 in whole-cell lysates of HEK293T cells transfected with the indicated expression vectors. k, CoIP assays to detect TBK1 dimerization based interaction of HA-TBK1 with Flag-TBK1 (upper) and immunoblot analysis of protein expression level in lysates (lower). l, Immunoblot analysis of the indicated phosphorylated (p-) and total proteins in LPS-stimulated control shRNA-transduced A549 cells or Tbk1 shRNA (D5)-transduced A549 cells that were reconstituted with and an empty vector or shRNA-resistant expression vectors encoding HA-tagged TBK1 wildtype (WT) or S716A. Data are representative of three independent experiments. Unprocessed blots are shown in Unprocessed Blots Fig. 6.
Extended Data Fig. 7. TBK1 deletion in lung epithelial cells promotes T cell activation.
a, Immunohistochemical staining of T cells using the indicated antibodies in lung sections of Tbk1WT-KrasLA2 (WT-Kras) and Tbk1cKO-KrasLA2 (cKO-Kras) mice. Scale bar, 100 mm. Data are presented as a representative image (upper) or summary graphs (lower, n = 7 mice per group). b,c, Flow cytometric analysis of the frequency of CD4 and CD8 T cells in lung cells (b) or IFNg+ effector T cells within lung CD4 or CD8 T cell populations (c). n = 5 mice per group. d-g, Experimental design (d), efficiency of T cell depletion in the lung and spleen (e), a representative image of lung tumors (f, scale bar, 100 mm), and summary graphs of lung weight, tumor numbers, and tumor size (g) of Tbk1WT-KrasLA2 and Tbk1cKO-KrasLA2 mice treated with anti-CD3 or an IgG isotype control (150 mg/mouse). n = 11 mice per group. Data are representative of three independent experiments, and bar graphs are presented as mean±s.d. values. Two-sided unpaired Student’s t-test (a,b,c,g). Source data for graphs are provided in Statistical Source Data Fig. 7.
Supplementary Material
Acknowledgement
We thank F Zhu, C Wang, and X Lin for plasmid DNAs, S Akira for Tank knockout mice, and FJ DeMayo for the Ccsp-Cre mice. We also thank the personnel from the flow cytometry, DNA analysis, and animal facilities at The MD Anderson Cancer Center and the Mass Spectrometry Proteomics Core at Baylor College of Medicine for for technical assistance. This study was supported by the National Institutes of Health grant AI057555 and partially supported by a seed fund from the Center for Inflammation and Cancer at the MD Anderson Cancer Center. T.G. was a visiting student supported by a scholarship from the China Scholarship Council with the grant number of 201906380080. The MD Anderson core facilities are supported by the NIH/NCI Cancer Center Support Grant (CCSG) P30CA016672, and the Baylor College of Medicine Mass Spectrometry Proteomics Core is supported by a CPRIT Core Facility Award (RP170005) and a P30 Cancer Center Support Grant (NCI-CA125123).
Footnotes
Competing financial interests statement
The authors declare no competing financial interests.
References
- 1.Hiscott J Convergence of the NF-kappaB and IRF pathways in the regulation of the innate antiviral response. Cytokine Growth Factor Rev. 18, 483–490 (2007). [DOI] [PubMed] [Google Scholar]
- 2.Shi JH, Xie X & Sun SC TBK1 as a regulator of autoimmunity and antitumor immunity. Cell Mol Immunol 15, 743–745 (2018). [DOI] [PMC free article] [PubMed] [Google Scholar]
- 3.Chien Y et al. RalB GTPase-mediated activation of the IkappaB family kinase TBK1 couples innate immune signaling to tumor cell survival. Cell 127, 157–170 (2006). [DOI] [PubMed] [Google Scholar]
- 4.Barbie DA et al. Systematic RNA interference reveals that oncogenic KRAS-driven cancers require TBK1. Nature 462, 108–112 (2009). [DOI] [PMC free article] [PubMed] [Google Scholar]
- 5.Ou YH et al. TBK1 directly engages Akt/PKB survival signaling to support oncogenic transformation. Mol. Cell 41, 458–470 (2011). [DOI] [PMC free article] [PubMed] [Google Scholar]
- 6.Xie X et al. I{kappa}B kinase {varepsilon} and TANK-binding kinase 1 activate AKT by direct phosphorylation. Proc. Natl. Acad. Sci. USA 108, 6474–6479 (2011). [DOI] [PMC free article] [PubMed] [Google Scholar]
- 7.Cooper JM et al. TBK1 Provides Context-Selective Support of the Activated AKT/mTOR Pathway in Lung Cancer. Cancer Res 77, 5077–5094 (2017). [DOI] [PMC free article] [PubMed] [Google Scholar]
- 8.Bodur C et al. The IKK-related kinase TBK1 activates mTORC1 directly in response to growth factors and innate immune agonists. EMBO J 37, 19–38 (2018). [DOI] [PMC free article] [PubMed] [Google Scholar]
- 9.Yu J et al. Regulation of T-cell activation and migration by the kinase TBK1 during neuroinflammation. Nat. Commun 6, 6074 (2015). [DOI] [PMC free article] [PubMed] [Google Scholar]
- 10.Häcker H et al. Specificity in Toll-like receptor signalling through distinct effector functions of TRAF3 and TRAF6. Nature 439, 204–207 (2006). [DOI] [PubMed] [Google Scholar]
- 11.Oganesyan G et al. Critical role of TRAF3 in the Toll-like receptor-dependent and -independent antiviral response. Nature 439, 208–211 (2006). [DOI] [PubMed] [Google Scholar]
- 12.Liu S et al. MAVS recruits multiple ubiquitin E3 ligases to activate antiviral signaling cascades. eLife 2, e00785 (2013). [DOI] [PMC free article] [PubMed] [Google Scholar]
- 13.Fang R et al. MAVS activates TBK1 and IKKepsilon through TRAFs in NEMO dependent and independent manner. PLoS Pathog 13, e1006720 (2017). [DOI] [PMC free article] [PubMed] [Google Scholar]
- 14.Ryzhakov G & Randow F SINTBAD, a novel component of innate antiviral immunity, shares a TBK1-binding domain with NAP1 and TANK. EMBO J 26, 3180–3190 (2007). [DOI] [PMC free article] [PubMed] [Google Scholar]
- 15.Goncalves A et al. Functional dissection of the TBK1 molecular network. PLoS One 6, e23971 (2011). [DOI] [PMC free article] [PubMed] [Google Scholar]
- 16.Kawagoe T et al. TANK is a negative regulator of Toll-like receptor signaling and is critical for the prevention of autoimmune nephritis. Nat Immunol 10, 965–972 (2009). [DOI] [PMC free article] [PubMed] [Google Scholar]
- 17.Fukasaka M et al. Critical role of AZI2 in GM-CSF-induced dendritic cell differentiation. J Immunol 190, 5702–5711 (2013). [DOI] [PubMed] [Google Scholar]
- 18.Cross M & Dexter TM Growth factors in development, transformation, and tumorigenesis. Cell 64, 271–280 (1991). [DOI] [PubMed] [Google Scholar]
- 19.Halper J Growth factors as active participants in carcinogenesis: a perspective. Vet Pathol 47, 77–97 (2010). [DOI] [PubMed] [Google Scholar]
- 20.Ardito CM et al. EGF receptor is required for KRAS-induced pancreatic tumorigenesis. Cancer Cell 22, 304–317 (2012). [DOI] [PMC free article] [PubMed] [Google Scholar]
- 21.Johnson L et al. Somatic activation of the K-ras oncogene causes early onset lung cancer in mice. Nature 410, 1111–1116 (2001). [DOI] [PubMed] [Google Scholar]
- 22.Joung SM et al. Akt contributes to activation of the TRIF-dependent signaling pathways of TLRs by interacting with TANK-binding kinase 1. J Immunol 186, 499–507 (2011). [DOI] [PubMed] [Google Scholar]
- 23.Roux KJ, Kim DI & Burke B BioID: a screen for protein-protein interactions. Curr Protoc Protein Sci. 74, Unit 19 23 (2013). [DOI] [PubMed] [Google Scholar]
- 24.Oliva JL, Griner EM & Kazanietz MG PKC isozymes and diacylglycerol-regulated proteins as effectors of growth factor receptors. Growth Factors 23, 245–252 (2005). [DOI] [PubMed] [Google Scholar]
- 25.Yang W et al. EGFR-induced and PKCepsilon monoubiquitylation-dependent NF-kappaB activation upregulates PKM2 expression and promotes tumorigenesis. Mol Cell 48, 771–784 (2012). [DOI] [PMC free article] [PubMed] [Google Scholar]
- 26.Ma X et al. Molecular basis of Tank-binding kinase 1 activation by transautophosphorylation. Proc Natl Acad Sci U S A 109, 9378–9383 (2012). [DOI] [PMC free article] [PubMed] [Google Scholar]
- 27.Shu C et al. Structural insights into the functions of TBK1 in innate antimicrobial immunity. Structure 21, 1137–1148 (2013). [DOI] [PMC free article] [PubMed] [Google Scholar]
- 28.Hornbeck PV, Chabra I, Kornhauser JM, Skrzypek E & Zhang B PhosphoSite: A bioinformatics resource dedicated to physiological protein phosphorylation. Proteomics 4, 1551–1561 (2004). [DOI] [PubMed] [Google Scholar]
- 29.Pan D et al. MALT1 is required for EGFR-induced NF-kappaB activation and contributes to EGFR-driven lung cancer progression. Oncogene 35, 919–928 (2016). [DOI] [PMC free article] [PubMed] [Google Scholar]
- 30.Reilly SM et al. An inhibitor of the protein kinases TBK1 and IKK-varepsilon improves obesity-related metabolic dysfunctions in mice. Nat. Med. 19, 313–321 (2013). [DOI] [PMC free article] [PubMed] [Google Scholar]
- 31.DuPage M et al. Endogenous T cell responses to antigens expressed in lung adenocarcinomas delay malignant tumor progression. Cancer Cell 19, 72–85 (2011). [DOI] [PMC free article] [PubMed] [Google Scholar]
- 32.Akbay EA et al. Activation of the PD-1 pathway contributes to immune escape in EGFR-driven lung tumors. Cancer Discov 3, 1355–1363 (2013). [DOI] [PMC free article] [PubMed] [Google Scholar]
- 33.Lastwika KJ et al. Control of PD-L1 Expression by Oncogenic Activation of the AKT-mTOR Pathway in Non-Small Cell Lung Cancer. Cancer Res 76, 227–238 (2016). [DOI] [PubMed] [Google Scholar]
- 34.Shishibori T et al. Three distinct anti-allergic drugs, amlexanox, cromolyn and tranilast, bind to S100A12 and S100A13 of the S100 protein family. Biochem J 338 ( Pt 3), 583–589 (1999). [PMC free article] [PubMed] [Google Scholar]
- 35.Bresnick AR, Weber DJ & Zimmer DB S100 proteins in cancer. Nat Rev Cancer 15, 96–109 (2015). [DOI] [PMC free article] [PubMed] [Google Scholar]
- 36.Cho CC, Chou RH & Yu C Amlexanox Blocks the Interaction between S100A4 and Epidermal Growth Factor and Inhibits Cell Proliferation. PLoS One 11, e0161663 (2016). [DOI] [PMC free article] [PubMed] [Google Scholar]
- 37.Tamai H et al. Amlexanox Downregulates S100A6 to Sensitize KMT2A/AFF1-Positive Acute Lymphoblastic Leukemia to TNFalpha Treatment. Cancer Res 77, 4426–4433 (2017). [DOI] [PubMed] [Google Scholar]
- 38.Concha-Benavente F & Ferris RL Oncogenic growth factor signaling mediating tumor escape from cellular immunity. Curr Opin Immunol 45, 52–59 (2017). [DOI] [PMC free article] [PubMed] [Google Scholar]
- 39.Murillo MM et al. RAS interaction with PI3K p110alpha is required for tumor-induced angiogenesis. J Clin Invest 124, 3601–3611 (2014). [DOI] [PMC free article] [PubMed] [Google Scholar]
- 40.Chen N et al. Upregulation of PD-L1 by EGFR Activation Mediates the Immune Escape in EGFR-Driven NSCLC: Implication for Optional Immune Targeted Therapy for NSCLC Patients with EGFR Mutation. J Thorac Oncol 10, 910–923 (2015). [DOI] [PubMed] [Google Scholar]
- 41.Li W et al. Aerobic Glycolysis Controls Myeloid-Derived Suppressor Cells and Tumor Immunity via a Specific CEBPB Isoform in Triple-Negative Breast Cancer. Cell Metab 28, 87–103 e106 (2018). [DOI] [PMC free article] [PubMed] [Google Scholar]
- 42.Cascone T et al. Increased Tumor Glycolysis Characterizes Immune Resistance to Adoptive T Cell Therapy. Cell Metab 27, 977–987 e974 (2018). [DOI] [PMC free article] [PubMed] [Google Scholar]
- 43.Chang CH et al. Metabolic Competition in the Tumor Microenvironment Is a Driver of Cancer Progression. Cell 162, 1229–1241 (2015). [DOI] [PMC free article] [PubMed] [Google Scholar]
- 44.Pearce EL, Poffenberger MC, Chang CH & Jones RG Fueling immunity: insights into metabolism and lymphocyte function. Science 342, 1242454 (2013). [DOI] [PMC free article] [PubMed] [Google Scholar]
- 45.Galluzzi L, Chan TA, Kroemer G, Wolchok JD & Lopez-Soto A The hallmarks of successful anticancer immunotherapy. Sci Transl Med 10 (2018). [DOI] [PubMed] [Google Scholar]
- 46.Parsa AT et al. Loss of tumor suppressor PTEN function increases B7-H1 expression and immunoresistance in glioma. Nat Med 13, 84–88 (2007). [DOI] [PubMed] [Google Scholar]
- 47.Marzec M et al. Oncogenic kinase NPM/ALK induces through STAT3 expression of immunosuppressive protein CD274 (PD-L1, B7-H1). Proc Natl Acad Sci U S A 105, 20852–20857 (2008). [DOI] [PMC free article] [PubMed] [Google Scholar]
- 48.Xu C et al. Loss of Lkb1 and Pten leads to lung squamous cell carcinoma with elevated PD-L1 expression. Cancer Cell 25, 590–604 (2014). [DOI] [PMC free article] [PubMed] [Google Scholar]
- 49.Wang B et al. TRAF2 and OTUD7B govern a ubiquitin-dependent switch that regulates mTORC2 signalling. Nature (2017). [DOI] [PMC free article] [PubMed] [Google Scholar]
- 50.Zhang W et al. Induction of PD-L1 expression by epidermal growth factor receptor-mediated signaling in esophageal squamous cell carcinoma. Onco Targets Ther 10, 763–771 (2017). [DOI] [PMC free article] [PubMed] [Google Scholar]
- 51.Jin J et al. The kinase TBK1 controls IgA class switching by negatively regulating noncanonical NF-kappaB signaling. Nat Immunol. 13, 1101–1109 (2012). [DOI] [PMC free article] [PubMed] [Google Scholar]
- 52.Li H et al. Cre-mediated recombination in mouse Clara cells. Genesis 46, 300–307 (2008). [DOI] [PMC free article] [PubMed] [Google Scholar]
- 53.Zhu L et al. TBK-binding protein 1 regulates IL-15-induced autophagy and NKT cell survival. Nat Commun 9, 2812 (2018). [DOI] [PMC free article] [PubMed] [Google Scholar]
- 54.Reiley W, Zhang M, Wu X, Graner E & Sun S-C Regulation of the deubiquitinating enzyme CYLD by IkappaB kinase gamma-dependent phosphorylation. Mol. Cell. Biol. 25, 3886–3895 (2005). [DOI] [PMC free article] [PubMed] [Google Scholar]
- 55.Li Y et al. Preventing abnormal NF-kappaB activation and autoimmunity by Otub1-mediated p100 stabilization. Cell Res 29, 474–485 (2019). [DOI] [PMC free article] [PubMed] [Google Scholar]
- 56.Chang M, Jin W & Sun SC Peli1 facilitates TRIF-dependent Toll-like receptor signaling and proinflammatory cytokine production. Nat. Immunol. 10, 1089–1095 (2009). [DOI] [PMC free article] [PubMed] [Google Scholar]
- 57.Reiley WW et al. Regulation of T cell development by the deubiquitinating enzyme CYLD. Nat. Immunol. 7, 411–417 (2006). [DOI] [PubMed] [Google Scholar]
Associated Data
This section collects any data citations, data availability statements, or supplementary materials included in this article.
Supplementary Materials
Data Availability Statement
The source data for Figs. 1e–g,I,k, 3i,j, 4k,l, 6c–e,g, 7a,c,e–g,i–k and Supplementary Figs. 1b–e, 7a–c,g are provided as Supplementary Table 4, and unprocessed blots are shown in Unprocessed Blots Figs. 1–7 and Extended Data Figs. 1–6. The mass spectrometry data have been deposited to the ProteomeXchange Consortium (http://proteomecentral.proteomexchange.org/cgi/GetDataset) via the MASSIVE repository (MSV000084505) with the dataset identifier PXD016025. All other data supporting the findings of this study are available from the corresponding author on reasonable request.


