

Abstract
Recent studies demonstrated that Gaussian accelerated molecular dynamics (GaMD) is a robust computational technique, which provides simultaneous unconstrained enhanced sampling and free energy calculations of biomolecules. However, the exact acceleration of biomolecular dynamics or speedup of kinetic rates in GaMD simulations and, more broadly, in enhanced sampling methods, remains a challenging task to be determined. Here, the GaMD acceleration is examined using alanine dipeptide in explicit solvent as a biomolecular model system. Relative to long conventional molecular dynamics (cMD) simulation, GaMD simulations exhibited ~36–67 times speedup for sampling of the backbone dihedral transitions. The acceleration depended on level of the GaMD boost potential. Furthermore, Kramers’ rate theory was applied to estimate GaMD acceleration using simulation-derived diffusion coefficients, curvatures and barriers of free energy profiles. In most cases, the calculations also showed significant speedup of dihedral transitions in GaMD, although the GaMD acceleration factors tended to be underestimated by ~3–96 fold. Because greater boost potential can be applied in GaMD simulations of systems with increased sizes, which potentially leads to higher acceleration, it is subject to future studies on accelerating the dynamics and recovering kinetic rates of larger biomolecules such as proteins and protein-protein/nucleic acid complexes.
Keywords: Biomolecules, Kinetic rates, Kramers’ theory, Gaussian accelerated molecular dynamics
Introduction
It is important to determine kinetic rates of biomolecular dynamics, such as protein folding, ligand binding and unbinding of target receptors and protein-protein/nucleic acid interactions, in order to understand life processes1 and guide drug design2. However, transitions of biomolecular conformations often take place over “mesoscales” of hundreds of nanoseconds to milliseconds in time and nanometers to micrometers in length3. They can be difficult to probe in both chemical and biophysical experiments (e.g., nuclear magnetic resonance4 and neutron scattering5, 6) and computer simulations3.
With recent remarkable advances in supercomputers and GPU computing, molecular dynamics (MD) simulations provide a powerful approach to investigate biomolecular dynamics at an atomic level7–9. MD simulations performed over tens to hundreds of microseconds have been successfully applied to capture folding of native proteins with ~10–100 amino acid residues10, spontaneous binding of drug molecules to target receptors11, 12, and repeated binding and unbinding of millimolar drug fragments13. However, due to the limited simulation timescales, conventional MD (cMD) suffers from insufficient sampling of biomolecular processes that take place over longer timescales, e.g., unbinding of potent drug molecules from target receptors, protein-protein binding, gene editing, etc.
Many enhanced simulation techniques have been actively developed over the past several decades to address the sampling issue of biomolecules14–19. These techniques include the umbrella sampling20, 21, metadynamics22, 23, adaptive biasing force24–26, replica-exchange MD27, 28, conformational flooding29, accelerated MD (aMD)30, 31, potential scaled MD32, 33, and so on. Enhanced sampling has proven useful for improved simulation convergence and free energy calculations of various biomolecular systems14, 15, 34. Despite remarkable developments and successful applications in a number of biological systems23, 26, “constrained” enhanced sampling requiring the use of predefined collective variables can limit the applicability of these methods15, 16, 35. On the other hand, “unconstrained” enhanced sampling can suffer from large statistical noise during reweighting to recover the original free energy landscapes36, leading to limitations for certain biomolecular systems16, 34.
To achieve both unconstrained enhanced sampling and proper energetic reweighting for biomolecular simulations, Gaussian accelerated MD (GaMD) has been recently developed by applying a harmonic boost potential to smooth the potential energy surface37. Similar to aMD30, 37, 38, GaMD greatly reduces the energy barriers and enhances biomolecular conformational sampling without the need of predefined collective variables39–41. Moreover, because the boost potential follows a Gaussian distribution, the original free energy profiles of biomolecules can be recovered through a cumulant expansion to the second order37. GaMD solves the energetic reweighting problem encountered in the previous aMD method36. It allows us to characterize structural dynamics of complex biomolecules, including the fast-folding proteins37, 42, GPCRs40, 43, HIV protease44 and CRISPR-Cas9 (clustered regularly interspaced short palindromic repeats-CRISPR associated protein 9)41.
Although recent studies demonstrated the applications of GaMD for efficient enhanced sampling and free energy calculations of biomolecules37, 39–42, the usage of GaMD simulations for extracting biomolecular kinetic rates has yet to be explored. In this context, there have been studies using several other enhanced sampling techniques to obtain biomolecular kinetics. In particular, Parrinello and co-workers have applied metadynamics to determine unbinding kinetics of inhibitors of trypsin45 and the p38 MAP Kinase46. De Oliveira et al.47 and Hamelberg and co-workers48–50 were able to extract kinetic rates of peptide conformational transitions from the aMD simulations using Kramers’ rate theory. Frank and Andricioaei applied Kramers’ rate theory to recover biomolecular kinetics from potential-scaled MD simulations33. Here, GaMD is combined with Kramers’ rate theory with the aim of both enhancing biomolecular simulations and recovering the kinetic rates, as well as elucidating the exact acceleration of biomolecular kinetics in GaMD simulations.
As demonstrated on the alanine dipeptide biomolecular model system, GaMD simulations exhibited ~36–67 times speedup relative to long-timescale cMD for sampling transitions of the peptide backbone dihedrals. The acceleration depended on level of the GaMD boost potential. We also derived diffusion coefficients of the alanine dipeptide, curvatures and barriers of the dihedral free energy profiles from cMD and GaMD simulations. Application of Kramers’ rate equation showed mostly significant speedup of GaMD compared with cMD, although the acceleration factors tended to be underestimated. This study will provide important guidance for future applications of GaMD in studying kinetics of larger biomolecular systems.
Methods
Kramers’ Rate Theory
In 1940, Kramers pioneered the research on the rate of chemical reactions. For a particle climbing over potential energy barriers, he showed that the reaction rate depends on temperature and viscosity of the host medium51. He derived reaction rates for both limiting cases of small and large viscosity. In the context of biomolecular simulations in aqueous medium, it is relevant for us to focus on the large viscosity limiting case. Biomolecules move in the high friction (“overdamping”) regime and energy barriers are much greater than kBT (kB is the Boltzmann’s constant and T is temperature). In this case, the reaction rate is calculated as:
| (1) |
where wm and wb are frequencies of the approximated harmonic oscillators (also referred to as curvatures of free energy surface33, 50) near the energy minimum and barrier, respectively, ξ is the apparent friction coefficient and ΔF is the free energy barrier of transition.
Without the loss of generality, we consider a 1D free energy profile or potential of mean force (PMF) of a reaction coordinate F(A). Near minimum at Am, the free energy can be approximated by a harmonic oscillator51 of frequency wm, i.e., . Near barrier at Ab, the free energy is approximated as , where Fb is the free energy at Ab and wb is the frequency of the approximated harmonic oscillator. Then we can calculate wm and wb as:
| (2) |
Where is the second-order derivative of the PMF profile.
The apparent friction coefficient ξ or diffusion coefficient D with ξ = kBT / D can be estimated as follows. First, we calculate a survival function S(t) as the probability that the system remains in an energy well longer than time t. In a direct approach48, we count the events that the system visits the energy well throughout a simulation. We record and measure the time intervals of each visiting event until the system escapes over an energy barrier. Then we have a time series Ti, where i=1, 2, …, N, and N is the total number barrier transitions observed in the simulation. The time series is subsequently ordered such that . With that, the survival function is estimated as , which is the probability that the system is trapped in the energy well for time longer than . Alternatively, we can numerically calculate the time-dependent probability density of reaction coordinate A, ρ(A, t) by solving the Smoluchowski equation along 1D PMF profile of the reaction coordinate:
| (3) |
Then the survival function is calculated as , where Ab1 and Ab2 are two boundaries of the energy well. The initial condition is often set as the Boltzmann distribution of reaction coordinate A in the energy well, i.e., .
Second, using the above survival functions, we estimate the effective kinetic rates as the negative of the slopes in linear fitting of the ln[S(t)] versus t, i.e., . This is based on the assumption that the survival function exhibits exponential decay as observed in earlier studies48, 49. Finally, the apparent diffusion coefficient D is obtained by dividing the kinetic rate calculated directly using the transition time series collected from the simulation by that using the probability density solution of the Smoluchowski equation48.
Gaussian Accelerated Molecular Dynamics
Gaussian accelerated molecular dynamics (GaMD) is an enhanced sampling technique that works by adding a harmonic boost potential to reduce the system energy barriers. Details of the method have been described in previous studies37, 42. A brief summary is provided here. Consider a system with N atoms at positions . When the system potential is lower than a reference energy E, the modified potential of the system is calculated as:
| (4) |
where k is the harmonic force constant. The two adjustable parameters E and k are automatically determined based on three enhanced sampling principles37. The reference energy needs to be set in the following range:
| (5) |
where Vmax and Vmin are the system minimum and maximum potential energies. To ensure that Eqn. (5) is valid, k has to satisfy: Let us define , then 0 < k0 ≤ 1. The standard deviation of ∆V needs to be small enough (i.e., narrow distribution) to ensure proper energetic reweighting52: where Vavg and σV are the average and standard deviation of the system potential energies, σ∆V is the standard deviation of ∆V with σ0 as a user-specified upper limit (e.g., 10kBT) for proper reweighting. When E is set to the lower bound E=Vmax, k0 can be calculated as:
| (6) |
Alternatively, when the threshold energy E is set to its upper bound is set to:
| (7) |
if is found to be between 0 and 1. Otherwise, k0 is calculated using Eqn. (6).
For energetic reweighting of GaMD simulations, the probability distribution along a reaction coordinate is written as p* (A). Given the boost potential of each frame, p* (A) can be reweighted to recover the canonical ensemble distribution, p(A), as:
| (8) |
where M is the number of bins, and is the ensemble-averaged Boltzmann factor of for simulation frames found in the jth bin. The ensemble-averaged reweighting factor can be approximated using cumulant expansion:
| (9) |
where the first two cumulants are given by:
| (10) |
The boost potential obtained from GaMD simulations usually follows near-Gaussian distribution39. Cumulant expansion to the second order thus provides a good approximation for computing the reweighting factor37, 52. The reweighted free energy is calculated as:
| (11) |
Where is the modified free energy obtained from GaMD simulation and Fc is a constant. Finally, curvatures and energy barriers of the reweighted and modified free energy profiles will be used in Kramers’ rate equation to determine the GaMD acceleration of biomolecular dynamics.
Simulations of Alanine Dipeptide
For simulations of alanine dipeptide (Fig. 1A), the AMBER ff99SB force field was used and the system was built using the Xleap module in the AMBER package9, 53–55 as described previously32, 37. The serial GPU version of GaMD implemented in AMBER 1637 was applied for running the simulations. By solvating alanine dipeptide in a TIP3P56 water box that extends 8 to 10 Å from the surface, the system contained 630 water molecules and a total number of 1,912 atoms. Periodic boundary conditions were applied. Bonds containing hydrogen atoms were restrained with the SHAKE algorithm57 and a 2fs timestep was used. Weak coupling to an external temperature and pressure bath was used to control both temperature and pressure (NPT ensemble) using Langevin dynamics58. The electrostatic interactions were calculated using the PME (particle mesh Ewald summation)59 with a cutoff of 8.0 Å for long-range interactions.
Fig. 1.
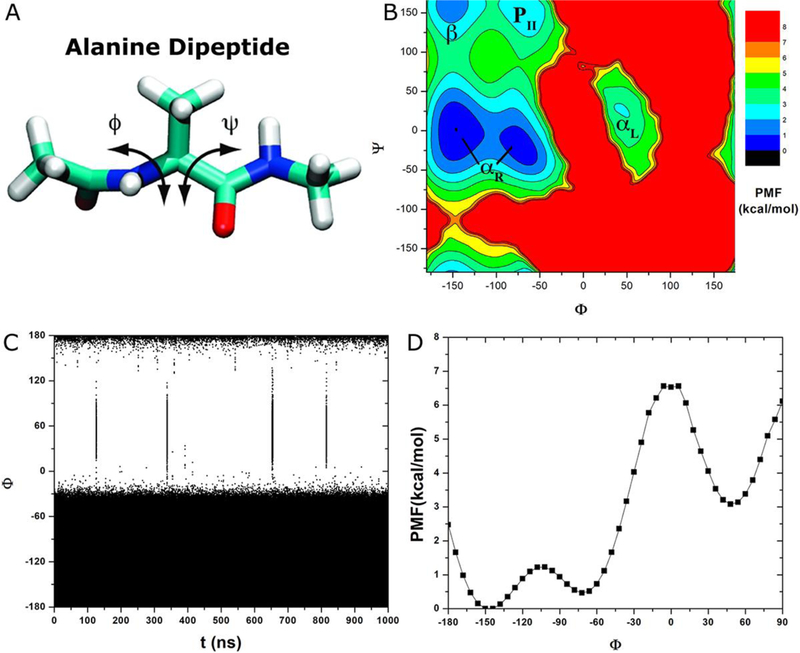
(A) Schematic representation of backbone dihedrals Φ and Ψ in alanine dipeptide. (B) 2D potential of mean force (PMF) of backbone dihedrals (Φ, Ψ) calculated from 1000 ns cMD simulation. Low energy wells are labeled corresponding to the right-handed α helix (αR), left-handed α helix (αL), β-sheet (β) and polyproline II (PII) conformations. (C) Time course and (D) 1D PMF of dihedral Φ obtained from the 1000 ns cMD simulation.
The system was initially minimized for 2,000 steps using the conjugate gradient minimization algorithm and then the solvent was equilibrated for 50 ps with the solute atoms fixed. Another minimization was performed with all atoms free and the system was slowly heated to 300 K over 500 ps. System equilibration was further achieved by a 400 ps NPT run to assure that the water box of simulated system had reached appropriate density. Then the fully equilibrated system was taken as the restarting structure for cMD and GaMD simulations.
Using the NPT ensemble with Langevin dynamics, 1000 ns cMD production simulation was performed as reference. For GaMD simulations, the threshold energy for applying boost potential is set to E=Vmax and the default 6 kcal/mol was used for σ0. The maximum, minimum, average and standard deviation values of the system potential (Vmax, Vmin, Vavg and σV) were obtained from an initial 2 ns cMD simulation with no boost potential. Then two versions of GaMD simulations were performed, one with boost potential applied to the dihedral energy term only (i.e., dihedral GaMD) and the other with boost potential applied to both the dihedral and total potential energy terms (i.e., dual-boost GaMD). Each GaMD simulation proceeded with a 2 ns equilibration run after adding the boost potential, followed by three independent 30 ns production runs with randomized initial atomic velocities. A list of the cMD and GaMD simulations are summarized in Table 1.
Table 1.
The number of forward (“Fwd”) and backward (“Bwd”) transitions of dihedral Φ in alanine dipeptide across the 0º energy barrier observed in 1000 ns cMD, three 30 ns dihedral GaMD and three 30 ns dual-boost GaMD simulations, along with the acceleration obtained in GaMD simulations relative to the cMD.
| Sim | Length (ns) | Ntransitions | kR (x106 s−1) | Acceleration | |||
|---|---|---|---|---|---|---|---|
| Fwd | Bwd | Fwd | Bwd | Fwd | Bwd | ||
| cMD | 1000 | 4 | 3 | 4 | 3 | - | - |
| Dihedral GaMD | 30 × 3 | 6, 4, 3 | 5, 4, 4 | 144±50 | 144±19 | 36.1±12.7 | 48.1±6.4 |
| Dual-boost GaMD | 30 × 3 | 6, 5, 7 | 5, 5, 8 | 200±33 | 200±58 | 50.0±8.3 | 66.7±19.2 |
For simulation analysis, the CPPTRAJ60 in AMBER was applied to calculate backbone dihedrals (Φ, Ψ) in alanine dipeptide. The “PyReweighting” toolkit52 was used to reweight the GaMD simulations for calculating 1D and 2D PMF profiles of dihedrals in alanine dipeptide. A bin size of 6° was selected to balance between reducing the anharmonicity and increasing the bin resolution as discussed earlier52. For the kinetics, the number of forward and backward transitions of dihedral Φ in alanine dipeptide across the 0º energy barrier were counted in the 1000 ns cMD, three 30 ns dihedral GaMD and three 30 ns dual-boost GaMD simulations. The transition rates were calculated as the number of dihedral transitions divided by the length of each simulation. In case of the multiple GaMD simulations, the average and standard deviation of dihedral transition rates were obtained. Finally, the rates were used to estimate acceleration of dihedral transitions obtained in GaMD simulations compared with cMD (Table 1).
Results and Discussion
Free energy landscape and kinetics of alanine dipeptide
Free energy profiles were computed from 1000 ns cMD simulation to quantitatively characterize different conformations of alanine dipeptide (Fig. 1A). Five free energy wells were identified in 2D PMF of backbone dihedrals (Φ, Ψ), which are centered around (−144°, 0°) and (−72°, −18°) for the right-handed α helix (αR), (48°, −6°) for the left-handed α helix (αL), (−150°, 156°) for the β-sheet and (−72°, 162°) for the polyproline II (PII) conformation (Fig. 1B).
Time course of dihedral Φ obtained from the 1000 ns cMD simulation was plotted in Fig. 1C. It visited the αR helix conformation (48° energy well) for a total of five times. Two close but separate visits took place during ~ 652.5–654.8 ns (see Fig. S1). Next, we examined conformational transitions of dihedral Φ across the 0° energy barrier. A transition going from −72° to 48° (αR→ αL) was denoted a “forward transition”, while one from 48° to −72° (αL→ αR) was a “backward transition”. During the 1000 ns cMD simulation, dihedral Φ underwent 4 times of forward transitions and another 3 times of backward transitions across the 0° energy barrier (Fig. 1C and Table 1). Note that three transitions of dihedral Φ also occurred across a 120° energy barrier, one into the 48° energy well near 652.7 ns (Fig. S1A) and another two out of it near 653.7 ns and 815.8 ns (Fig. S1A and Fig. 1C). Therefore, the rates of forward and backward transitions of dihedral Φ across the 0° energy barrier are 4 × 10⁶ s−1 and 3 × 10⁶ s−1, respectively (Table 1).
Fig. 1D shows a 1D PMF profile of dihedral Φ. It exhibits an energy barrier at 0° that separates two energy wells centered at −72° (αR helix) and 48° (αL helix). The energy barrier for forward transition of dihedral Φ from −72° to 48° is 6.07 kcal/mol and 3.45 kcal/mol for the backward transition from 48° to −72°. Curvature of the PMF profile was 2.40 near the −72° energy minimum, 2.95 near the 0° energy maximum and 2.88 near the 48° energy minimum (Table 2).
Table 2.
Energy barriers of forward (“Fwd”) and backward (“Bwd”) transitions of dihedral Φ at 0º, curvatures of free energy profiles calculated near −72º, 0º and 48º, and the apparent friction coefficient (ξ) calculated from cMD, dihedral GaMD and dual-boost GaMD simulations of alanine dipeptide, along with the acceleration of dihedral transitions in GaMD simulations derived using the Kramers’ theory. For GaMD simulations, ∆F and w are the free energy barriers and curvatures calculated from the reweighted PMF profiles, while ∆F* and w* are those calculated from the modified PMF profiles without energetic reweighting.
| Sim | ∆F (kcal/mol) | ∆F* (kcal/mol) | w (x10−2) | w* (x10−2) | D (x1014 deg2·s−1) | Acceleration | ||||||||
|---|---|---|---|---|---|---|---|---|---|---|---|---|---|---|
| Fwd | Bwd | Fwd | Bwd | −72º | 0º | 48º | −72º | 0º | 48º | Fwd | Bwd | Fwd | Bwd | |
| cMD | 6.07 | 3.45 | - | - | 2.40 | 2.95 | 2.88 | - | - | - | 2.21±0.08 | 2.11±0.21 | - | - |
| Dihedral GaMD | 6.07±0.22 | 2.39±0.27 | 4.57±0.34 | 2.20±0.36 | 2.39 | 3.76 | 3.51 | 1.99 | 2.88 | 2.28 | 3.06±0.19 | 1.52±0.10 | 10.95±0.69 | 0.50±0.76 |
| Dual-Boost GaMD | 6.09±1.05 | 3.43±1.11 | 4.40±0.08 | 2.19±0.22 | 2.32 | 4.39 | 2.19 | 1.94 | 3.08 | 2.15 | 1.98±0.12 | 1.30±0.05 | 8.96±1.78 | 3.36±1.91 |
Acceleration obtained through dihedral GaMD simulations
With the three 30 ns dihedral GaMD simulations of alanine dipeptide, energetic reweighting was applied to calculate free energy profiles of backbone dihedrals Φ and Ψ. In comparison, reweighted PMF profiles obtained from the 30 ns dihedral GaMD trajectories agreed quantitatively with the original profiles from the 1000 ns cMD simulation. The reweighted 2D PMF profile showed that same energy wells corresponding to the αR helix, αL helix, β-sheet and PII conformations as depicted in Fig. 2A. The GaMD derived PMF profile of Φ essentially overlapped with the original profile of the 1000 ns cMD simulation (Fig. 2D). This was similar for the dihedral Ψ as shown in Fig. S2A.
Fig. 2.
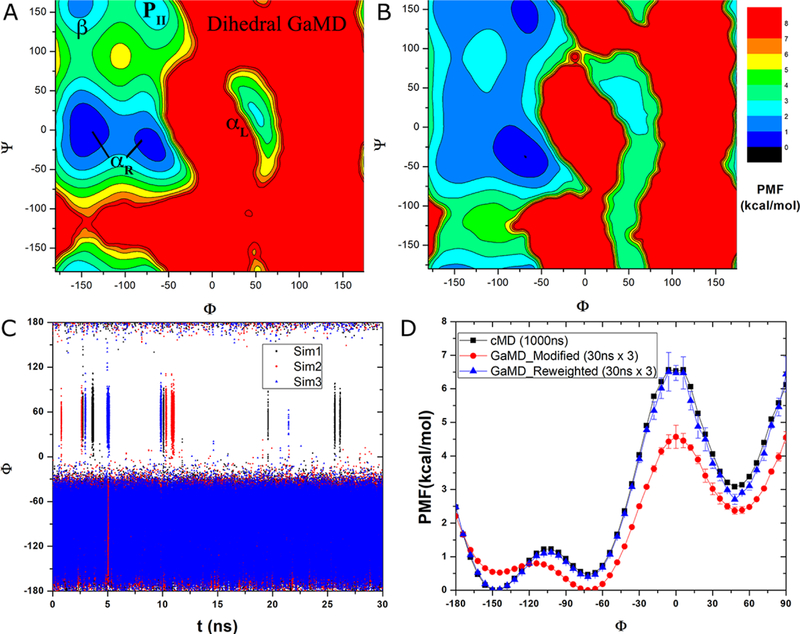
Accelerated conformational sampling of alanine dipeptide in dihedral GaMD simulations: (A) Recovered 2D PMF of backbone dihedrals (Φ, Ψ) calculated from reweighting three 30 ns dihedral GaMD simulations combined using cumulant expansion to the 2nd order. Low energy wells are labeled as in Fig. 1B. (B) 2D PMF of backbone dihedrals (Φ, Ψ) calculated directly from the three 30 ns dihedral GaMD simulations combined without energetic reweighting. (C) Time course of dihedral Φ obtained from the three 30 ns dihedral GaMD simulations. (D) 1D PMF of dihedral Φ obtained from the three 30 ns dihedral GaMD simulations without and with energetic reweighting (denoted “Modified” and “Reweighted”, respectively) compared with that of the 1000 ns cMD simulation. For GaMD, 1D PMF profiles were calculated separately for each simulation, and their average and standard deviation (error bars) were plotted here.
Time course of dihedral Φ obtained from the three 30 ns dihedral GaMD simulations was plotted in Fig. 2C. In the three GaMD simulations, dihedral Φ underwent 6, 4 and 3 (13 in total) forward transitions of αR→ αL and 5, 4 and 4 (13 in total) backward transitions of αL→ αR across the 0° energy barrier, respectively. It also climbed over the 120° energy barrier twice, one into the 48° energy well near 5.0 ns in “Sim3” and the other out of it near 2.75 ns in “Sim1” (Fig. S1B). Thus, the rates of forward and backward transitions of dihedral Φ across the 0° energy barrier were 144±50 × 106 s−1 and 144±19 × 106 s−1, respectively. Relative to cMD, the speedup obtained from dihedral GaMD simulations was 36.1±12.7 for the forward transitions and 48.1±6.4 for the backward transitions of dihedral Φ across the 0° energy barrier (Table 1).
Additionally, PMF profiles were computed without energetic reweighting from the dihedral GaMD simulations. Compared with cMD or GaMD-reweighted free energy profiles, broader energy wells and lower energy barriers were found in the GaMD-modified free energy profiles, such as the 2D PMF shown in Fig. 2B and 1D modified PMF of Φ (Fig. 2D) and Ψ (Fig. S2A).
In the reweighted PMF profile of dihedral Φ, energy barriers of αR→ αL forward transitions and αL→ αR backward transitions were 6.07±0.22 kcal/mol and 2.39±0.27 kcal/mol, respectively. Curvature of the reweighted PMF profile was 2.39 near the −72° energy minimum, 3.76 near the 0° energy maximum and 3.51 near the 48° energy minimum (Table 2). In the modified PMF profile without energetic reweighting, the energy barrier of the forward transitions was decreased to 4.57±0.34 kcal/mol and 2.20±0.36 kcal/mol for the backward transitions. Moreover, modified PMF curvatures were decreased 1.99, 2.88 and 2.28 near the −72° energy minimum, 0° energy maximum and 48° energy minimum, respectively (Table 2).
Higher acceleration in dual-boost GaMD simulations
Similar to the above analysis of dihedral GaMD simulations, we calculated the free energy profiles and kinetic rates of backbone dihedrals Φ and Ψ in alanine dipeptide from the three 30 ns dual-boost GaMD simulations. In comparison, the reweighted PMF profiles obtained from dual-boost GaMD simulations also agreed quantitatively with the original profiles from 1000 ns cMD simulation. The reweighted 2D PMF of dihedrals Φ and Ψ showed that same energy wells corresponding to the αR helix, αL helix, β-sheet and PII conformations (Fig. 3A). The reweighted PMF of Φ overlapped with the original profile from 1000 ns cMD simulation (Fig. 1D), similarly for Ψ (Fig. S2B).
Fig. 3.
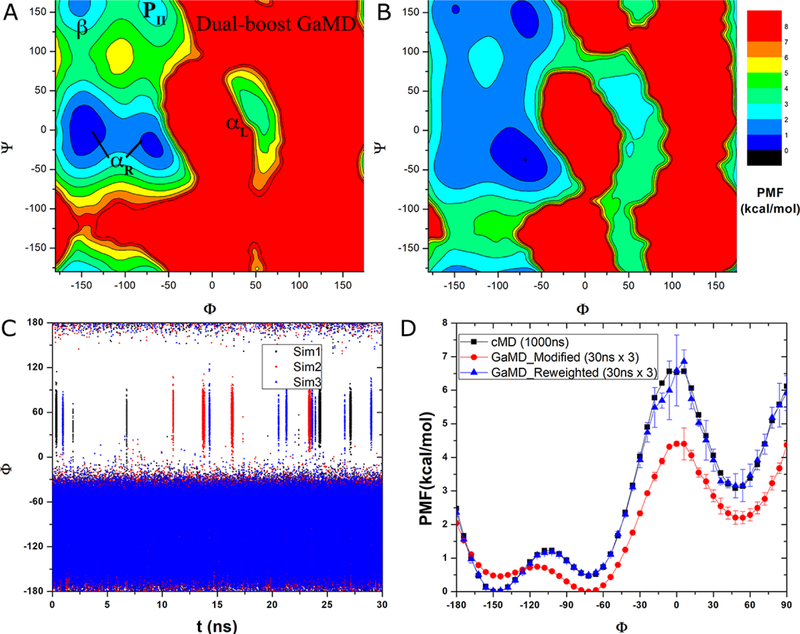
Accelerated conformational sampling of alanine dipeptide in dual-boost GaMD simulations: (A) Recovered 2D PMF of backbone dihedrals (Φ, Ψ) calculated from reweighting three 30 ns dual-boost GaMD simulations combined using cumulant expansion to the 2nd order. Low energy wells are labeled as in Fig. 1B. (B) 2D PMF of backbone dihedrals (Φ, Ψ) calculated directly from the three 30 ns dual-boost GaMD simulations combined without energetic reweighting. (C) Time course of dihedral Φ obtained from the three 30 ns dual-boost GaMD simulations. (D) 1D PMF of dihedral Φ obtained from the three 30 ns dual-boost GaMD simulations without and with energetic reweighting (denoted “Modified” and “Reweighted”, respectively) compared with that of the 1000 ns cMD simulation. For GaMD, 1D PMF profiles were calculated separately for each simulation, and their average and standard deviation (error bars) were plotted here.
Furthermore, PMF profiles were computed without energetic reweighting from the dual-boost GaMD simulations (Figs. 3B, 3D and S2B). Similarly, we observed decreases of free energy barriers and curvatures in the GaMD-modified PMF profiles than in the original cMD or GaMD-reweighted PMF profiles (Table 2). Particularly for dihedral Φ at 0°, reweighted free energy barriers for the αR→ αL forward transitions and αL→ αR backward transitions were 6.09±1.05 kcal/mol and 3.43±1.11 kcal/mol, respectively. Curvature of the reweighted PMF profile was 2.32 near the −72° energy minimum, 4.39 near the 0° energy maximum and 2.19 near the 48° energy minimum. In the GaMD-modified PMF profile, the energy barriers were decreased to 4.40±0.08 kcal/mol for the forward transitions and 2.19±0.22 kcal/mol for the backward transitions. Modified PMF curvatures were decreased to 1.94, 3.08 and 2.15 near −72°, 0° and 48°, respectively (Table 2).
In the three 30 ns dihedral GaMD simulations, dihedral Φ underwent 6, 4 and 7 (18 in total) forward transitions of αR→ αL and 5, 5 and 8 (18 in total) backward transitions of αL→ αR across the 0° energy barrier (Fig. 3C). It climbed over the 120° energy barrier twice, one into the 48° energy well near 23.6 ns in “Sim3” and the other out of it near 24.3 ns in “Sim1” (Fig. S1C). The rates of forward and backward transitions of Φ across the 0° energy barrier were 200±33 × 106 s−1 and 200±58 × 106 s−1, respectively. Higher acceleration was thus achieved in dual-boost GaMD simulations than in dihedral GaMD simulations. Relative to cMD, the speedup in dual-boost GaMD simulations is 50.0±8.3 for the forward transitions and 66.7±19.2 for the backward transitions of dihedral Φ across the 0° energy barrier (Table 1).
Application of Kramers’ rate theory to estimate GaMD acceleration
In addition to the free energy barriers and curvatures, we calculated apparent diffusion coefficients of dihedral Φ in alanine dipeptide from the cMD and GaMD simulations. Survival functions S(t) were computed both directly using the transition time series collected from the simulations and numerically by solving the Smoluchowski equation along the 1D PMF profile of Φ (Methods). Fig. 4A plots the survival functions calculated directly for the forward transition of dihedral Φ across the 0º energy barrier in the cMD and GaMD simulations. The dihedral and dual-boost GaMD simulations exhibited significantly faster decay of the survival functions compared the cMD simulation. The faster decay of survival functions and thus higher kinetic rates resulted from decreased energy barriers in the GaMD enhanced simulations. Similar results were observed in the survival functions calculated by solving the Smoluchowski equation (Fig. 4B). For the Smoluchowski equation, a reflective boundary was set near the left-side barrier of the energy well at −216 º with the dihedral periodicity taken into account and an absorbing boundary was set on top of the right-side barrier at 0º.
Fig. 4.
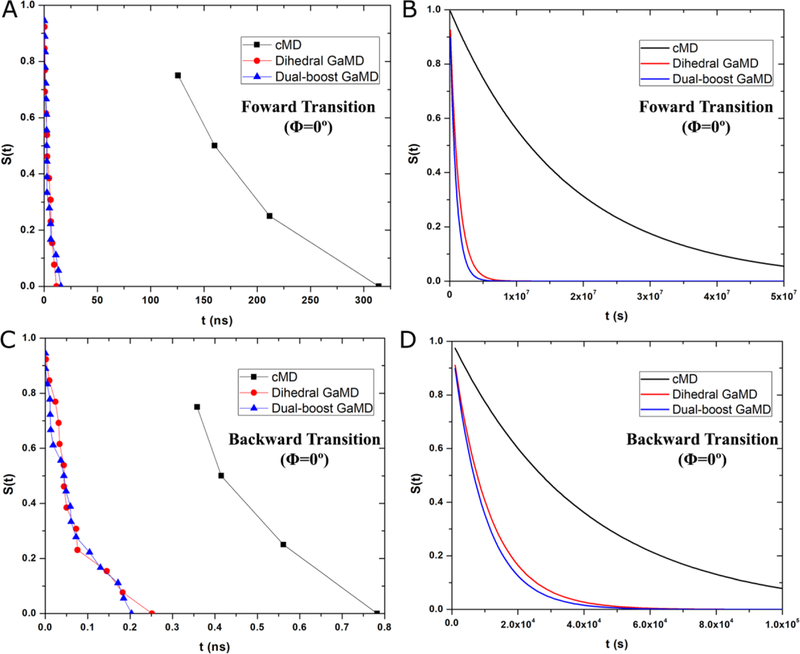
(A-B) Exponential decay of survival functions S(t) for the forward transition of dihedral Φ across the 0º energy barrier obtained from: (A) direct calculation using the transition time series collected from the simulations and (B) numerically solving the Smoluchowski equation along the 1D PMF profile of Φ. (C-D) Exponential decay of the survival functions S(t) for backward transition of dihedral Φ across the 0º energy barrier obtained from: (C) direct calculation using the transition time series collected from the simulations and (D) numerically solving the Smoluchowski equation along the 1D PMF profile of Φ. The survival functions were calculated using the cMD, dihedral GaMD and dual-boost GaMD simulations.
With the survival functions S(t), we estimated the effective dihedral kinetic rates as the negative of the slopes in linear fitting of ln[S(t)] versus t. They were then used to calculate the apparent diffusion coefficients. Results showed that the diffusion coefficients for the forward transition of dihedral Φ across the 0º energy barrier were 2.21±0.08 × 10¹⁴ deg2·s−1 in cMD simulation, 3.06±0.19 × 10¹⁴ deg2·s−1 in dihedral GaMD simulations and 1.98±0.12 × 10¹⁴deg2·s−1 in the dual-boost GaMD simulations.
For the backward transition of dihedral Φ across the 0º energy barrier, survival functions S(t) were calculated as the probability that Φ was trapped in the 48º energy well longer than time t (Fig. 4C). For the Smoluchowski equation, the top of the left-side barrier of the energy well (0º) was set as an absorbing boundary and a reflective boundary was set near the top of the right-side barrier at 96º. Fig. 4D shows exponential decay of the survival functions that are calculated using solutions of the Smoluchowski equation. Next, we also estimated the effective dihedral kinetic rates and then the apparent diffusion coefficients. The final diffusion coefficients for the backward transition of dihedral Φ across the 0º energy barrier were 2.11±0.21 × 10¹⁴ deg2·s−1 in cMD simulation, 1.52±0.10 × 10¹⁴ deg2·s−1 in dihedral GaMD simulations and 1.30±0.05 × 10¹⁴deg2·s−1 in the dual-boost GaMD simulations. Overall, the apparent diffusion coefficients of dihedral Φ obtained in the present study of the alanine dipeptide appeared to be smaller than those of the dihedral ω in cis-trans isomerization of N-methylacetamide (D=1.38±0.02 × 10¹⁵ deg2·s−1), although the N-methylacetamide was simulated in implicit solvent instead49.
Finally, we applied Kramers’ rate theory to estimate acceleration of dihedral transitions in GaMD simulations using changes in the diffusion coefficients and free energy barriers and curvatures of alanine dipeptide. Relative to cMD, the calculated speedup in dihedral GaMD simulations was 10.95±0.69 for sampling forward transitions of dihedral Φ across the 0° energy barrier, while only 0.50±0.76 for backward transitions of dihedral Φ. The latter with large standard deviation likely resulted from insufficient sampling of the backward dihedral transitions in cMD as well as dihedral GaMD simulations. A significantly lower free energy barrier (2.39±0.27 kcal/mol) was obtained from reweighting the dihedral GaMD simulations compared with that of long-timescale cMD simulation (3.45 kcal/mol) or dual-boost GaMD simulation (3.43±1.11 kcal/mol) as shown in Table 2. In the dual-boost GaMD simulations, speedup over cMD estimated by applying Kramers theory was 8.96±1.78 for the forward transitions and 3.36±1.91 for the backward transitions of Φ (Table 2). Therefore, except backward transition of Φ in the dihedral GaMD simulations, application of Kramers’ rate theory also showed significant acceleration of dihedral transitions in the GaMD simulations. Depending on the studied dihedral transition, the acceleration factors tended to be underestimated by ~3–96 fold by applying Kramers’ rate theory. Nevertheless, significant acceleration of the biomolecular kinetics was successfully achieved through GaMD as shown for the dihedral transitions rates in Table 1.
In a previous study, De Oliveira et al. estimated the kinetic transition rates of dihedral Ψ in alanine dipeptide using shorter (20 ns) cMD and aMD simulations47. In the aMD simulations, boost potential was added to only the total potential energetic term (“total-boost” aMD). The transition of Ψ across the 90° energy barrier from the α helix to β strand (Fig. 1B and S2) was examined. Relative to cMD, the transition rate of Ψ was increased by ~2–11 in the aMD simulations47. Although dihedral30 and dual-boost aMD31 may give better performance, the present dihedral and dual-boost GaMD simulations appear to provide higher acceleration (~36–67) of conformational transitions in the same system.
Conclusions
In this study, we have examined acceleration of biomolecular kinetics in the GaMD simulations, using alanine dipeptide in explicit solvent as a model system. The small system allowed us to perform converged cMD simulation lasting 1000 ns for comparison. For transitions of backbone dihedral Φ in alanine dipeptide, dihedral GaMD simulations exhibited ~36–48 times speedup and ~50–67 times speedup in dual-boost GaMD simulations relative to cMD. Furthermore, we applied Kramer’s rate theory to estimate GaMD acceleration using the simulation-derived friction coefficients, curvatures and barriers of free energy profiles. In most cases, we also obtained significant speedup of dihedral transitions in the GaMD simulations, although the acceleration factors were underestimated by ~3–96 fold compared with direct calculations using the available dihedral transition rates. Previous studies showed that greater boost potential can be applied in GaMD simulations of systems with increased sizes and more rugged energy landscapes37, 39–41. Higher acceleration is thus expected in GaMD simulations larger biomolecules. It is subject to future studies on accelerating the dynamics and recovering kinetic rates of the larger biomolecules such as proteins and protein-protein/nucleic acid complexes.
Supplementary Material
Acknowledgements
Computing time was provided on the GPU clusters through the Extreme Science and Engineering Discovery Environment (XSEDE) award allocation TG-MCB170129. Y.M. would like to thank Giulia Palermo and Donald Hamelberg for valuable discussions. This work was supported in part by American Heart Association (award 17SDG33370094) and the startup funding in the College of Liberal Arts and Sciences at the University of Kansas.
Footnotes
Supplementary Material
See the Supplementary Material for two supporting Figures. S1 and S2.
References
- 1.Hlavacek WS, Redondo A, Metzger H, Wofsy C, and Goldstein B, Proc Natl Acad Sci U S A 98 (2001) 7295. [DOI] [PMC free article] [PubMed] [Google Scholar]
- 2.Schuetz DA, de Witte WEA, Wong YC, Knasmueller B, Richter L, Kokh DB, Sadiq SK, Bosma R, Nederpelt I, Heitman LH, Segala E, Amaral M, Guo D, Andres D, Georgi V, Stoddart LA, Hill S, Cooke RM, De Graaf C, Leurs R, Frech M, Wade RC, de Lange ECM, IJzerman AP, Muller-Fahrnow A, and Ecker GF, Drug Discov Today 22 (2017) 896. [DOI] [PubMed] [Google Scholar]
- 3.Henzler-Wildman K, and Kern D, Nature 450 (2007) 964. [DOI] [PubMed] [Google Scholar]
- 4.Yang S, Salmon L, and A-Hashimi HM, Nat Methods 11 (2014) 552. [DOI] [PMC free article] [PubMed] [Google Scholar]
- 5.Vural D, Hu X, Lindner B, Jain N, Miao Y, Cheng X, Liu Z, Hong L, and Smith JC, Biochimica et biophysica acta 1861 (2017) 3638. [DOI] [PubMed] [Google Scholar]
- 6.Miao Y, Yi Z, Cantrell C, Glass Dennis C., Baudry J, Jain N, and Smith Jeremy C., Biophysical Journal 103 (2012) 2167. [DOI] [PMC free article] [PubMed] [Google Scholar]
- 7.Karplus M, and McCammon JA, Nature Structural Biology 9 (2002) 646. [DOI] [PubMed] [Google Scholar]
- 8.Phillips JC, Braun R, Wang W, Gumbart J, Tajkhorshid E, Villa E, Chipot C, Skeel RD, Kale L, and Schulten K, Journal of computational chemistry 26 (2005) 1781. [DOI] [PMC free article] [PubMed] [Google Scholar]
- 9.Salomon-Ferrer R, Case DA, and Walker RC, Wires Comput Mol Sci 3 (2013) 198. [Google Scholar]
- 10.Lindorff-Larsen K, Piana S, Dror RO, and Shaw DE, Science 334 (2011) 517. [DOI] [PubMed] [Google Scholar]
- 11.Shan Y, Kim ET, Eastwood MP, Dror RO, Seeliger MA, and Shaw DE, J Am Chem Soc 133 (2011) 9181. [DOI] [PMC free article] [PubMed] [Google Scholar]
- 12.Dror RO, Pan AC, Arlow DH, Borhani DW, Maragakis P, Shan Y, Xu H, and Shaw DE, Proc Natl Acad Sci U S A 108 (2011) 13118. [DOI] [PMC free article] [PubMed] [Google Scholar]
- 13.Pan AC, Xu HF, Palpant T, and Shaw DE, Journal of Chemical Theory and Computation 13 (2017) 3372. [DOI] [PubMed] [Google Scholar]
- 14.Spiwok V, Sucur Z, and Hosek P, Biotechnology advances 33 (2015) 1130. [DOI] [PubMed] [Google Scholar]
- 15.Abrams C, and Bussi G, Entropy-Switz 16 (2014) 163. [Google Scholar]
- 16.Zuckerman DM, Annu Rev Biophys 40 (2011) 41. [DOI] [PMC free article] [PubMed] [Google Scholar]
- 17.Dellago C, and Bolhuis PG, Adv Polym Sci 221 (2009) 167. [Google Scholar]
- 18.Liwo A, Czaplewski C, Oldziej S, and Scheraga HA, Curr Opin Struct Biol 18 (2008) 134. [DOI] [PMC free article] [PubMed] [Google Scholar]
- 19.Christen M, and van Gunsteren WF, Journal of computational chemistry 29 (2008) 157. [DOI] [PubMed] [Google Scholar]
- 20.Kastner J, Wires Comput Mol Sci 1 (2011) 932. [Google Scholar]
- 21.Torrie GM, and Valleau JP, Journal of Computational Physics 23 (1977) 187. [Google Scholar]
- 22.Laio A, and Parrinello M, P Natl Acad Sci USA 99 (2002) 12562. [DOI] [PMC free article] [PubMed] [Google Scholar]
- 23.Laio A, and Gervasio FL, Rep Prog Phys 71 (2008) 126601. [Google Scholar]
- 24.Darve E, Rodriguez-Gomez D, and Pohorille A, J Chem Phys 128 (2008) 144120. [DOI] [PubMed] [Google Scholar]
- 25.Darve E, and Pohorille A, J Chem Phys 115 (2001) 9169. [Google Scholar]
- 26.Comer J, Gumbart JC, Henin J, Lelievre T, Pohorille A, and Chipot C, J Phys Chem B 119 (2015) 1129. [DOI] [PMC free article] [PubMed] [Google Scholar]
- 27.Sugita Y, and Okamoto Y, Chem Phys Lett 314 (1999) 141. [Google Scholar]
- 28.Okamoto Y, Journal of Molecular Graphics & Modelling 22 (2004) 425. [DOI] [PubMed] [Google Scholar]
- 29.Grubmüller H, Phys Rev E 52 (1995) 2893. [DOI] [PubMed] [Google Scholar]
- 30.Hamelberg D, Mongan J, and McCammon JA, J Chem Phys 120 (2004) 11919. [DOI] [PubMed] [Google Scholar]
- 31.Hamelberg D, de Oliveira CAF, and McCammon JA, J Chem Phys 127 (2007) 155102. [DOI] [PubMed] [Google Scholar]
- 32.Sinko W, Miao Y, de Oliveira CAF, and McCammon JA, Journal of Physical Chemistry B 117 (2013) 12759. [DOI] [PMC free article] [PubMed] [Google Scholar]
- 33.Frank AT, and Andricioaei I, The Journal of Physical Chemistry B 120 (2016) 8600. [DOI] [PubMed] [Google Scholar]
- 34.Miao Y, and McCammon JA, Mol Simulat 42 (2016) 1046. [DOI] [PMC free article] [PubMed] [Google Scholar]
- 35.Palermo G, Campomanes P, Cavalli A, Rothlisberger U, and De Vivo M, J Phys Chem B 119 (2015) 789. [DOI] [PubMed] [Google Scholar]
- 36.Shen TY, and Hamelberg D, J Chem Phys 129 (2008) 034103. [DOI] [PubMed] [Google Scholar]
- 37.Miao Y, Feher VA, and McCammon JA, Journal of Chemical Theory and Computation 11 (2015) 3584. [DOI] [PMC free article] [PubMed] [Google Scholar]
- 38.Voter AF, Phys Rev Lett 78 (1997) 3908. [Google Scholar]
- 39.Miao Y, and McCammon JA, Annual Reports in Computational Chemistry 13 (2017) 231. [DOI] [PMC free article] [PubMed] [Google Scholar]
- 40.Miao Y, and McCammon JA, Proc Natl Acad Sci U S A 113 (2016) 12162. [DOI] [PMC free article] [PubMed] [Google Scholar]
- 41.Palermo G, Miao Y, Walker RC, Jinek M, and McCammon JA, Proceedings of the National Academy of Sciences 114 (2017) 7260. [DOI] [PMC free article] [PubMed] [Google Scholar]
- 42.Pang YT, Miao Y, Wang Y, and McCammon JA, J Chem Theory Comput 13 (2017) 9. [DOI] [PMC free article] [PubMed] [Google Scholar]
- 43.Wang YT, and Chan YH, Scientific Reports 7 (2017) [DOI] [PMC free article] [PubMed]
- 44.Miao Y, Huang YM, Walker RC, McCammon JA, and Chang CA, Biochemistry-Us 57 (2018) 1533. [DOI] [PMC free article] [PubMed] [Google Scholar]
- 45.Tiwary P, Limongelli V, Salvalaglio M, and Parrinello M, P Natl Acad Sci USA 112 (2015) E386. [DOI] [PMC free article] [PubMed] [Google Scholar]
- 46.Casasnovas R, Limongelli V, Tiwary P, Carloni P, and Parrinello M, Journal of the American Chemical Society 139 (2017) 4780. [DOI] [PubMed] [Google Scholar]
- 47.De Oliveira CAF, Hamelberg D, and McCammon JA, J Chem Phys 127 (2007) 175105. [DOI] [PubMed] [Google Scholar]
- 48.Hamelberg D, Shen T, and McCammon JA, J. Chem. Phys 122 (2005) [DOI] [PubMed] [Google Scholar]
- 49.Xin Y, Doshi U, and Hamelberg D, J. Chem. Phys 132 (2010) 224101. [DOI] [PubMed] [Google Scholar]
- 50.Doshi U, and Hamelberg D, Journal of Chemical Theory and Computation 7 (2011) 575. [DOI] [PubMed] [Google Scholar]
- 51.Kramers HA, Physica 7 (1940) 284. [Google Scholar]
- 52.Miao Y, Sinko W, Pierce L, Bucher D, and McCammon JA, Journal of Chemical Theory and Computation 10 (2014) 2677. [DOI] [PMC free article] [PubMed] [Google Scholar]
- 53.Case TADDA, Cheatham TE III, Simmerling CL, Wang J, Duke RE, Luo R, Walker RC, Zhang W, Merz KM, Roberts B, Hayik S, Roitberg A, Seabra G, Swails J, Goetz AW, Kolossváry I, Wong KF, Paesani F, Vanicek J, Wolf RM, Liu J, Wu X, Brozell SR, Steinbrecher T, Gohlke H, Cai Q, Ye X, Wang J, Hsieh M-J, Cui G, Roe DR, Mathews DH, Seetin MG, Salomon-Ferrer R, Sagui C, Babin V, Luchko T, Gusarov S, Kovalenko A, and Kollman PA, University of California, San Francisco: (2012) [Google Scholar]
- 54.Gotz AW, Williamson MJ, Xu D, Poole D, Le Grand S, and Walker RC, Journal of Chemical Theory and Computation 8 (2012) 1542. [DOI] [PMC free article] [PubMed] [Google Scholar]
- 55.Salomon-Ferrer R, Götz AW, Poole D, Le Grand S, and Walker RC, Journal of Chemical Theory and Computation 9 (2013) 3878. [DOI] [PubMed] [Google Scholar]
- 56.Jorgensen WL, Chandrasekhar J, Madura JD, Impey RW, and Klein ML, J Chem Phys 79 (1983) 926. [Google Scholar]
- 57.Ryckaert J-P, Ciccotti G, and Berendsen HJC, Journal of Computational Physics 23 (1977) 327. [Google Scholar]
- 58.Berendsen HJC, Postma JPM, Vangunsteren WF, Dinola A, and Haak JR, J Chem Phys 81 (1984) 3684. [Google Scholar]
- 59.Essmann U, Perera L, Berkowitz ML, Darden T, Lee H, and Pedersen LG, J Chem Phys 103 (1995) 8577. [Google Scholar]
- 60.Roe DR, and Cheatham TE, Journal of Chemical Theory and Computation 9 (2013) 3084. [DOI] [PubMed] [Google Scholar]
Associated Data
This section collects any data citations, data availability statements, or supplementary materials included in this article.