Abstract
Purpose:
Adrenomedullin (ADM) levels are elevated in gestational and type 2 diabetic patients. ADM also stimulates lipolysis in vitro. Disturbed lipid metabolism has been implicated in the pathogenesis of diabetes. Here, we explore whether blockade of ADM is beneficial for metabolic homeostasis in a diabetic mouse model.
Methods:
C57BL/6J female mice were placed on either a control or a high fat high sucrose (HFHS) diet for 8 weeks. At week 4, osmotic mini-pumps were implanted for constant infusion of either saline or ADM antagonist, ADM22–52. Glucose tolerance tests were performed prior to infusion and 4 weeks after infusion began. Animals were then sacrificed and visceral adipose tissue collected for further analysis.
Results:
Mice fed HFHS displayed glucose intolerance, increased mRNA expressions in VAT for Adm and its receptor components, Crlr and Ramp3. HFHS fed mice also had increased basal and isoprenaline-induced glycerol release by VAT explants. ADM22–52 did not significantly affect glucose intolerance. ADM22–52 did suppress basal and isoprenaline-induced glycerol release by VAT explants. This alteration was associated with enhanced mRNA expression of insulin signaling factors Insr and Glut4, and adipogenic factor Pck1.
Conclusions:
HFHS diet induces glucose intolerance and enhances ADM and its receptor expressions in VAT in female mice. ADM22–52 treatment did not affect glucose intolerance in HFHS mice, but reduced both basal and isoprenaline-induced lipolysis, which is associated with enhanced expression of genes involved in adipogenesis. These results warrant further research on the effects of ADM blockade in improving lipid homeostasis in diabetic patients.
Keywords: Adrenomedullin, diabetes, lipid metabolism
Introduction
The regulation of lipid homeostasis by adipose tissue is an important aspect of whole-body metabolism. Dysregulation in lipid metabolism has wide-ranging effects, contributing to multiple disorders including cardiovascular disease, neurodegeneration, cancer, and diabetes (1). Adipocytes are specialized cells that function to store energy in the form of lipids, predominantly triglycerides, and as a regulatory system contributing to metabolic homoeostasis through the production and secretion of adipokines, including adrenomedullin (ADM) (2,3)
ADM is a 52 amino acid peptide ubiquitously expressed in many cells including adipocytes (4), and serves as a modulator of various physiological functions (5). ADM is a member of the calcitonin peptide superfamily, and signals through its receptor components calcitonin receptor-like receptor (CRLR) and receptor activity-modifying protein (RAMP) 2, or RAMP3. ADM22–52 is an antagonist of ADM which block functions of CRLR/RAMP2, the primary ADM receptor system found in adipose tissue (6).
Animal models of obesity and diabetes show that ADM synthesis increases in adipose tissue and is elevated in high-fat diet fed and ob/ob mice (2,7), and circulating ADM is elevated in type 2 diabetic patients (8,9). Furthermore, ADM is known to stimulate adipose tissue lipolysis in an autocrine manner as ADM receptors are found on the surface of normal adipocytes (7). Binding of ADM to its receptor on the adipocyte surface activates extracellular signal regulated (ERK1 and ERK2) and p38 MAPK pathways in addition to the commonly known cAMP/PKA pathway (10,11). These results suggest that overproduction of ADM by adipocytes may play a pathological role in adipose tissues and contribute to the metabolic dysfunction in diabetes. However, the influence of ADM antagonist on glucose metabolism and lipid homeostasis in diabetic disorders remains unclear. Thus, we designed this study to examine if ADM and its receptors in VAT are stimulated by high fat, high sugar (HFHS) diet feeding, if lipid homeostasis in a HFHS diet mouse model of diabetes is improved by the blockade of ADM using ADM antagonist, and if so, whether the genes involved in lipid lipolysis and lipogenesis are affected.
Materials and Methods
Animal Handling and Procedures
All animal procedures were approved by the Baylor College of Medicine institutional animal care and use committee and performed in accordance with NIH Guide for the Care and Use of Laboratory Animals.
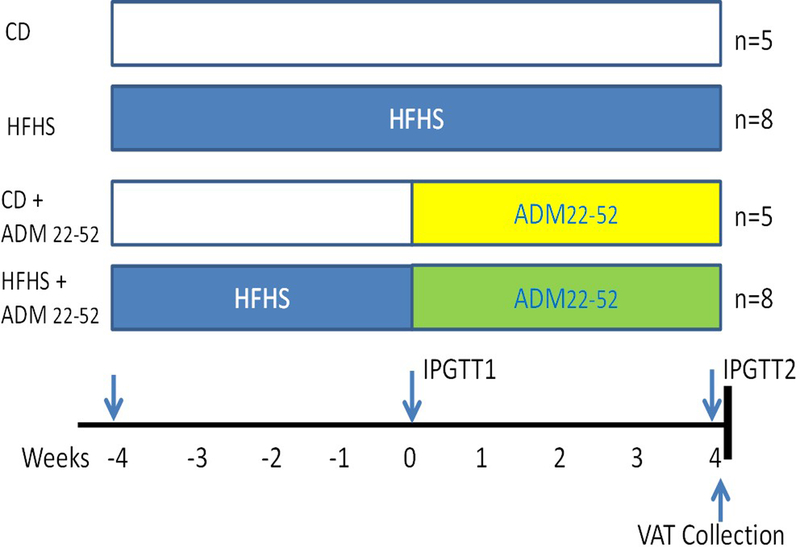
C57BL/6J female mice were obtained from Jackson Laboratory (Bar Harbor, ME, USA). Mice were group housed and at 9 weeks of age were place on either a control (CD; D12450K, 10% kcal fat no sucrose; Research Diets, New Brunswick, NJ, USA) or HFHS diet (D12451, 45% kcal% fat, 18% kcal% sugar; Research Diets) for eight weeks (Figure 1). At 4 weeks of diet, mice were fasted for 6hrs and intraperitoneal glucose tolerance tests (IPGTT) were performed with duplicate measurements using two ReliOn Prime Blood Glucose Monitoring System Meters (Walmart, Bentonville, AR, USA) as previously described (12). Following IPGTT alzet® osmotic mini pumps, model 2004 (Cupertino, CA, USA) were implanted subcutaneously in the back of mice according to manufacturer’s instructions. Pumps were loaded with either saline or ADM22–52 for a total of 4 groups: (1) CD–saline (n=5), (2) CD–ADM22–52 (n=5), (3) HFHS–saline (n=8), and (4) HFHS–ADM22–52 (n=8). ADM22–52 (American Peptide Co., Inc. Sunnyvale, CA) was administered at a rate of 1.2 mg/kg/day. Following 28 days of ADM22–52 treatment, and at 8 weeks of diet, a second IPGTT was performed, animals were sacrificed and serum and visceral adipose tissue (VAT) were collected for further analysis.
Figure 1.
Study design overview. C57BL/6L female mice were placed on either CD (n=10) or HFHS (n=16) for a total 8 weeks. At 4 weeks of diet challenge, (designated week 0 of treatment) mice were subcutaneously implanted with osmotic minipumps infusing saline or ADM22–52 (1.2 mg/kg wt/day). IPGTT performed at weeks as indicated. Animals were sacrificed after treatments and visceral adipose tissue (VAT) collected for explant culture.
Insulin Analysis
Serum insulin values were assessed using a Rat/Mouse insulin ELISA (Millipore™, Billerica, MA, USA) according to manufacturer’s instructions as previously described (12,13). Intra-assay coefficients of variation were 5.66 +/− 0.62% and intra-assay CVs were 5.71 +/− 1.18%.
Quantitative Real-Time PCR
Total RNA was isolated from VAT using TRIzol (Life Technologies, Grand Island, NY) and RT was performed as previously described (14). Quantitative Real-time-PCR was performed using Taq universal SYBR Green Supermix (Bio-Rad). PCR primers used for amplification were purchased from Integrated DNA Technologies (IDT): Adm (Mm.PT.58.11111908), Crlr (Mm.PT.58.10636953), Ramp2 (Mm.PT.58.30553776), Ramp3 (Mm.PT.58.8586280), Insulin receptor (Insr, F: 5’-CCACCAADAACTCGTGAAAGG-3’; R: 5;-TGCACGCAGGAAAGAACCT-3’), Glut4 (F: 5’-GCAGCGAGTGACTGGAACA-3’; R: 5’-CCAGCCACGTTGCATTGTAG-3’), Lpl (Mm.PT.58.46006099), Perilipin (Plin1, Mm.PT.58.10928326), Hsl (Mm.PT.58.30708147), phosphoenolpyruvate carboxykinase C (Pck1; F: 5’-GTGCTGGAGTGGATGTTCGG-3’; R: 5;- CTGGCTGATTCTCTGTTTCAGG-3’), Ppar-γ (Mm.PT.58.31161924). Amplification of three housekeeping genes β-actin (primer F: 5’-AGGTCATCACTATTGGCAACGA-3’; primer R: 5’-CACTTCATGATGGAATTGAATGTAGTT-3’), Hprt (primer F: 5’-TGACACTGGCAAAACAATCGA-3’; primer R: 5’-CGTCCTTTTCACCAGCAAGCT-3’), and Gapdh (primer F: 5’-AGGTCGGTGTGAACGGATTTG-3’; primer R: 5’-TGTAGACCATGTAGTTGAGGTCA-3’) served as an endogenous control. PCR conditions for SYBR Green gene expression were 10 min at 95°C for 1 cycle, then 15 sec at 94°C, 30 sec at 60°C and 15 sec at 72°C for 39 cycles. All experiments were performed in triplicate. The average CT value of the three housekeeping genes was used to calculate the results using the 2–ΔΔCT method, and expressed in fold increase/decrease of the gene of interest.
Adipose tissue explant culture
VAT obtained from mice was finely diced and transferred to 24-well plates containing 1 ml of DMEM with 4.5 g/L D-glucose (Gibco, Life technology, Gaithersburg, MD), and cultured in a humidified atmosphere of 21% O2 and 5% CO2 at 37 C for 1 hour as previously described (15,16). After refreshing the medium, tissues were incubated for 24 hours and culture medium was collected for glycerol analysis. In some experiments, the VAT was incubated with isoprenaline (30 nM, Sigma Aldrich, St. Louis, MO) for 1 hour and culture medium was collected. The glycerol level in culture medium was assessed using Free Glycerol Reagent (Sigma Aldrich, St. Louis, MO) according to manufacture instructions. The absorbance at A540 were read and recorded by a Spectrophotometer CLARIO STAR (BMG Labtech, Inc., Cary, NC).
Statistics
All data are presented as mean ± SEM. All statistical analysis were performed using GraphPad Prism Software. Area under the curve (AUC), mRNA expression, serum insulin and glycerol data were analyzed using two-way ANOVA with diet and time as factors with a Bonferroni post hoc analysis for comparison between groups. IPGTT was analyzed using a repeated measures ANOVA (treatment and time as factors) with a Bonferroni post hoc test for comparisons between groups. Statistical significance was defined as p<0.05.
Results
ADM22–52 does not alter glucose tolerance in HFHS fed female mice
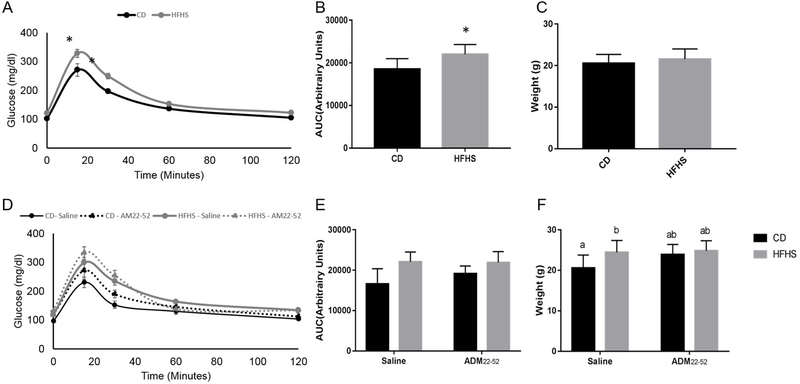
To examine the effect of ADM22–52 on glucose tolerance, mice were fed HFHS for 4 weeks, and then ADM22–52 was administered continuously for 4 weeks, HFHS diet was fed for a total of 8 weeks. At 4 weeks of HFHS diet feeding prior to ADM22–52 administration, HFHS fed mice displayed significantly elevated blood glucose at 15 and 30 minutes of IPGTT (p<0.05) and increased AUC (p<0.05) compared to CD mice (Figure 2A and 2B). Weights were not different at this time (Figure 2C). At 8 weeks HFHS fed mice still had increased AUC (p<0.05) compared to CD mice (Figure 2E). ADM22–52 treatment had no effect on glucose tolerance (Figure 2D and 2E). Body weights were significantly increased (p<0.05) in HFHS-saline females compared to CD-saline females, however there was no weight difference between CD-ADM22–52 and HFHS-ADM22–52 groups (Figure 2F).
Figure 2.
Glucose tolerance and body weight in mice under CD or HFHS diets. (A) Glucose tolerance, (B) IPGTT AUC and weights (C) in mice following 4 weeks CD or HFHS diet feeding before ADM22–52 treatment. (C) Glucose tolerance, (D) IPGTT AUC and (E) weights following 8 weeks CD or HFHS diet feeding with or without ADM22–52 treatment. Data displayed as mean+/−SEM with * and different letters indicating significant differences between groups (p<0.05).
HFHS diet fed mice displayed enhanced Adm, Crlr and Ramp3 mRNA expression in VAT
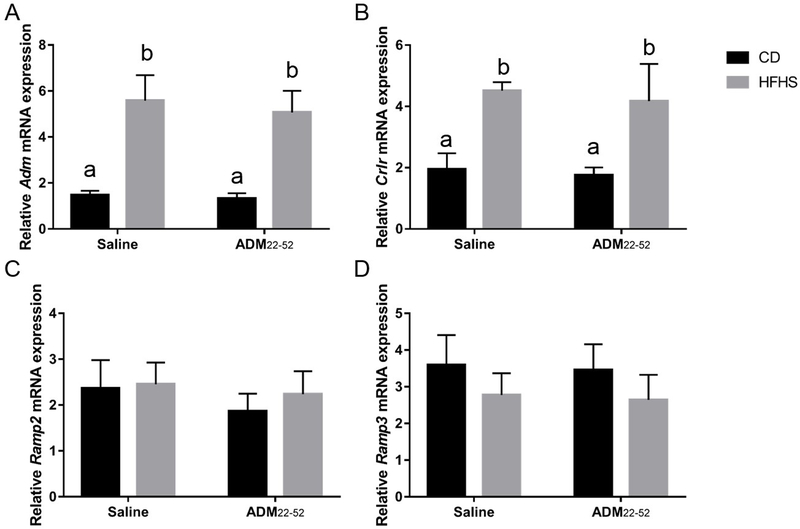
To determine the effect of HFHS diet and glucose intolerance on ADM and its receptor components in VAT, mRNA expression for Adm and Crlr, Ramp2 and Ramp3 were measured using Real-time PCR. There was a main effect of diet, with HFHS fed mice having increased (p<0.05) mRNA expression of Adm, Crlr, and Ramp3 in VAT, compared to CD mice (Figure 3A, 3B and 3D, p<0.05), but mRNA for Ramp2 was not affected (Figure 3C). ADM22–52 treatment did not significantly affect expression of these genes (Figure 3A, 3B, 3C, and 3D) and there was no significant interaction between diet and treatment effects. Post hoc analysis revealed significant differences among groups, with HFHS-saline and HFHS- ADM22–52 mice having increased (p<0.0001) mRNA expression of Adm and Crlr compared to CD-saline and CD- ADM22–52 mice.
Figure 3.
mRNA expression of ADM and its receptor components by VAT. VAT was obtained from HFHS or CD fed mice treated with or without ADM22–52. qPCR was performed to determine the mRNA expression of (A) Adm, (B) Crlr, (C) Ramp2, and (D) Ramp3. mRNA was normalized to the average of three housekeeping genes, β-actin, Gapdh and Hprt and data displayed as mean+/−SEM. Different letters indicate significant difference between groups (p<0.05).
ADM22–52 administration diminishes negative impact of HFHS diet on Insr and Glut4 mRNA in VAT
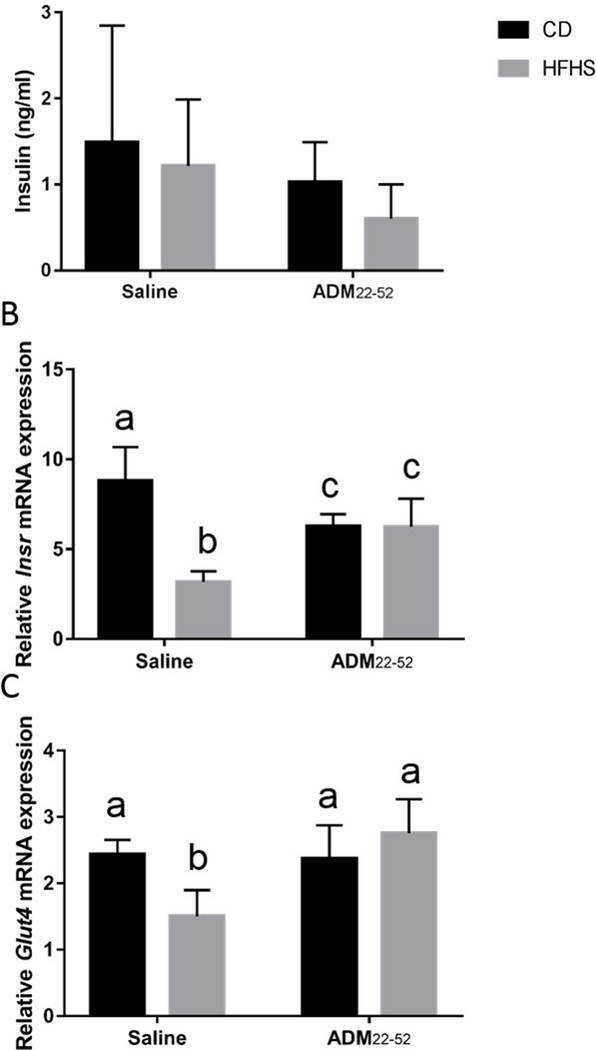
Next, we determined the effects of HFHS diet and ADM blockade on circulating levels of insulin and VAT gene expression of Insr and Glut-4. We found that neither HFHS diets nor ADM22–52 significantly affected serum insulin levels (Figure 4A). There was however a significant interaction of diet*treatment (p<0.0001) and significant main effect of diet (p<0.0001) on Insr mRNA expression (Fig. 4B). Post hoc analysis revealed Insr was significantly reduced in HFHS-saline mice compared to all other groups (p<0.05), while CD- ADM22–52 and HFHS- ADM22–52 mice had decreased (p<0.05) Insr compared to CD-saline mice (Fig. 4B). Next, Glut4 mRNA expression was analyzed. There was significant interaction (p<0.005) of diet*treatment and significant main effect of treatment (p<0.005) on Glut4 mRNA expression. Post hoc analysis revealed HFHS-saline animals had reduced Glut4 compared to all other groups (p<0.01).
Figure 4.
Serum insulin levels and mRNA of Insr and Glut4 by VAT in mice under CD or HFHS diets. (A) Serum insulin values were assessed using a Rat/Mouse insulin ELISA. qPCR was performed to determine the mRNA expression of (B) Insr and (C) Glut4 in VAT obtained from mice under HFHS or CD diets treated with or without ADM22–52. mRNA was normalized to the average of three housekeeping genes, β-actin, Gapdh and Hprt and data displayed as mean+/−SEM. Different letters indicate significant difference (p<0.05).
HFHS diet decreases expression of lipolytic enzymes: Plin1, Hsl, and Lpl in VAT
HFHS diet significantly decreased (p<0.01) mRNA expression of lipolytic enzymes Plin1, Hsland Lpl (Figure 5A–C). There was also a significant interaction of diet*treatment in the expression of HSL and LPL (p<0.05). Post hoc analysis revealed that HFHS-saline and HFHS- ADM22–52 had reduced (p<0.05) Plin mRNA expression compared to CD-saline animals but not CD- ADM22–52 mice (Fig. 5A). Hsl mRNA expression was decreased (p<0.001) in both HFHS groups compared to CD groups, however Hsl was also decreased (p<0.05) in CD- ADM22–52 compared to CD-saline mice (Fig. 5B). Lpl expression was decreased in HFHS-saline and HFHS- ADM22–52 compared to CD-saline animals.
Figure 5.
Effect of HFHS and ADM22–52 on the expression of lipolytic enzymes. VAT was obtained from mice under HFHS or CD diets treated with or without ADM22–52. qPCR was performed to determine the mRNA expression of (A) Plin1, (B) Hsl, and (C) Lpl,mRNA was normalized to the average of three housekeeping genes, β-actin, Gapdh and Hprt and data displayed as mean+/−SEM. Different letters indicate significant difference (p<0.05).
ADM22–52 stimulates Pck1 in VAT in HFHS fed mice
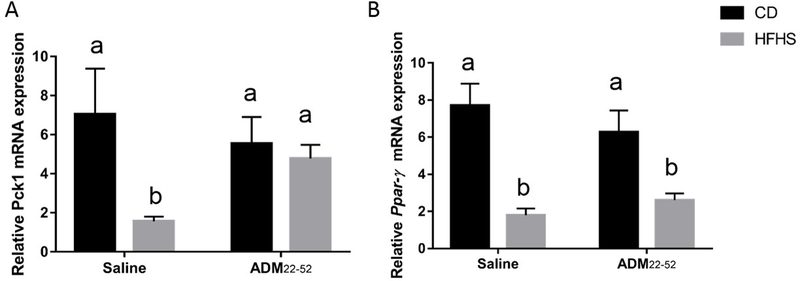
Diet had a main effect (p<0.0001) on adipogenesis factor Pck1 mRNA expression and there was significant interaction (P<0.001) between diet*treatment (Figure 6A). Post hoc comparisons revealed HFHS-saline animals had decreased Pck1 compared to all other groups. Ppar-γ mRNA expression was decreased by diet (p<0.001) and there was a significant interaction between diet*treatment (p<0.05). Post hoc comparisons between groups showed that HFHS diet groups, regardless of treatment, had reduced (p<0.05) Ppar-γ compared to CD groups (Figure 6B).
Figure 6:
Effect of HFHS and ADM22–52 on the expression of adiopgensis related genes. VAT was obtained from mice under HFHS or CD diets treated with or without ADM22–52. qPCR was performed to determine the mRNA expression of (A) Pck1 and (B) Ppar-γ. mRNA was normalized to the average of three housekeeping genes, β-actin, Gapdh and Hprt and data displayed as mean+/−SEM. Different letters indicate significant difference (p<0.05).
ADM22–52 suppressed lipolysis in VAT in HFHS fed mice
Lipolysis was evaluated by measuring glycerol levels in VAT explant culture medium. There was a significant main effect of diet (p<0.05) and significant interaction (0<0.05) of diet*treatment on basal and isoprenaline-stimulated glycerol release (Figure 7A–B). There was a significant effect (p<0.01) of treatment on isoprenaline-stimulated glycerol release, but not basal glycerol release. Post hoc comparisons revealed that HFHS-saline mice had increased basal and isoprenaline-stimulated glycerol release compared CD-saline and CD-ADM22–52 mice (Figure 7A–B, p<0.05). This stimulation was suppressed in HFHS-ADM22–52 mice (p<0.05), indicating that blockade of ADM improves lipid homeostasis.
Figure 7.
Effect of HFHS and ADM22–52 on basal and isoprenaline-induced glycerol release by VAT explants. VAT was obtained from mice under HFHS or CD diets treated with or without ADM22–52. (A) The tissues were incubated for 24 hours and culture medium was collected for glycerol analysis. (B) VAT was incubated with isoprenaline (30 nM) for 1 hour and culture medium was collected. The glycerol levels in culture medium was assessed by using Free Glycerol Reagent. Data displayed as mean+/−SEM. Different letters indicate significant difference (p<0.05)
Discussion
High fat diet‐fed C57BL/6 J mice are a widely used animal model for type 2 diabetes mellitus and metabolic syndrome (17). In the current study we showed that exposure to HFHS diet induces glucose intolerance and enhances expression of Adm and its receptor components, Crlr and Ramp3, in VAT. Administration of ADM22–52 did not affect glucose intolerance in HFHS fed mice, but suppressed both basal and isoprenaline-induced lipolysis in VAT explants. This effect was associated with rescued mRNA expression of insulin signaling factors Insr and Glut-4 as well as adipogenic factor, Pck1. Thus, we propose that increased ADM action in VAT may contribute to the lipid dysregulation in HFHS diet fed mice, and blockade of ADM actions may improve lipid homeostasis in HFHS-induced insulin resistance.
Visceral adipose tissue secretes large amounts of adipokines such as leptin, TNFα, and ADM, that disrupt metabolic homeostasis when dysregulated by HFHS diet (18). Consistent with previous reports (17), the present study demonstrated that mice fed HFHS diet developed glucose intolerance (Figure 2). Treatment with ADM22–52 did not mitigate the effects of HFHS on glucose tolerance (Figure 2C, 2D) or serum insulin levels (Figure 4A), indicating that ADM antagonist treatment alone is not effective in restoring normal glucose tolerance in HFHS fed animals.
Our study did reveal local effects of ADM treatment on adipose tissue in HFHS fed mice. Recent studies demonstrated that adipose tissue obtained from rats fed a high-fat diet expresses greater amounts of ADM than rats fed a normal diet (7). Our results corroborate these findings in mice, showing that Adm mRNA levels in VAT from HFHS fed mice were markedly increased compared to controls (Fig 3A). The mRNA levels of Adm receptor component Crlr and Ramp3 expressed in visceral adipose tissues also increased after HFHS diet (Figure 3B, 3D), but mRNA for Ramp2 was not affected (Figure 3B, 3C). Given that adipose tissue constitutes about one-fourth of total body composition, such adipose tissue-specific upregulation after HFHS diet suggests differential regulation of ADM and its receptor during the development of glucose intolerance.
Insulin resistance is strongly linked to type 2 diabetes and associated with a reduced uptake of glucose by adipose tissue which is regulated by GLUT4 (19). In this study we showed that mRNA expression of Insr and Glut4 in adipose tissue was rescued in part by treatment with ADM22–52 in HFHS fed mice (Figure 4 B, 4C), indicating that blockade of ADM action may improve insulin signaling transduction and glucose transportation in adipose tissue, and thus reduce HFHS-induced insulin resistance within adipocytes.
Proper balance between lipolysis and lipogenesis in adipocytes determines the release of free fatty acids and glycerol, which are crucial for whole body lipid homeostasis (20). There are a number of intracellular lipolytic enzymes that have an established function in the lipolytic breakdown of triglycerides (TG) in adipose tissues, including perilipin and HSL (21–23). Perilipin is an essential adipocyte-derived lipolytic enzyme and HSL mobilizes stored fats in adipose tissue. LPL is one of the enzymes for efficient fatty acid uptake and storage (24). In addition, PCK1 is the key enzyme in gluconeogenesis, an important metabolic pathway that functions to restrain the release of non-esterified fatty acids from adipocytes (25). PPAR-γ is a nuclear receptor required for adipocyte PCK1 expression (26,27). A change in the activity or abundance of these transcription factors leads to major changes in intracellular as well as whole body lipid levels. The present study demonstrated that HFHS diet reduced key lipolytic enzymes Plin1 and Hsl as well as Lpl, ADM22–52 treatment however did not alter these enzymes (Figure 5A–C). Key enzymes of adipogenesis, Pck1 (Figure 6A) and Ppar-γ (Figure 6B) were decreased by HFHS diet, however ADM22–52 treatment was able to rescue Pck1 but not Ppar-γ mRNA expression. This rescue of Pck1 mRNA expression by ADM blockade may contribute to increased synthesis of fatty acids by favoring adipocyte adipogenesis, leading to improvement in dyslipidemia.
It has been reported that ADM promotes lipolysis by increasing phosphorylation of HSL, and both ADM and isoprenaline induce lipolytic effects via elevating intracellular cAMP levels (11). We have observed that ADM significantly increased glycerol release in human adipocyte culture medium, and the increases in glycerol release were attenuated by ADM22–52 (16), implying a lipolytic property of ADM. The present study showed that both basal and isoprenaline-induce glycerol release by VAT explants were increased in HFHS mice (Figure 7A–B), and this effect was abrogated by ADM22–52, suggesting that elevations in ADM and its action may play a role in HFHS induced lipolysis. We acknowledge that additional lipolytic mechanisms such as TNF-α and other known factors might be operational in ADM induced lipolysis. However, in this study, we describe a novel mechanism of HFHS induced lipolysis that is mediated by ADM.
This study has several limitations which might restrict the interpretation of the results. First, due to the limited VAT sample size, protein expression for activated lipolytic enzymes, such as phosphorylated perilipin and HSL are unable to be evaluated, since relative gene expression does not necessarily imply that the protein will be translated or functional. Thus, future study should measure both protein levels and activity of lipid metabolic genes. Second, the effect of ADM on lipolysis of mouse VAT and the signaling pathways underlying ADM and isoprenaline-stimulated lipolysis remains unclear. Thus, the significance and the molecular mechanism underlying such unique and tissue-specific gene expression of ADM during HFHS induced glucose intolerance remain to be elucidated.
Nevertheless, the present study demonstrates HFHS diet increases expression of ADM and its receptor system in VAT from mice, and the lipolytic effect of ADM was abrogated by ADM receptor blockade, suggesting that HFHS induced lipolysis is mediated by ADM. In conclusion, this work reinforces the potential role of ADM as a crucial agent in the regulation of lipid metabolism. It also underlines the possible existence of a tight regulation loop between ADM produced in adipose tissue and lipid dysregulation. We believe that the effects of adipocyte-derived ADM on lipid homeostasis are potentially interesting fields of investigation.
Acknowledgments
This work was supported by National Institutes of Health (Grant HD 091503 and HL58144 to C.Y.).
Footnotes
Disclosure Statement: The authors have nothing to disclose.
References
- 1.Caveolae Martin S., lipid droplets, and adipose tissue biology: pathophysiological aspects. Horm Mol Biol Clin Investig. 2013;15(1):11–18. [DOI] [PubMed] [Google Scholar]
- 2.Nambu T, Arai H, Komatsu Y, Yasoda A, Moriyama K, Kanamoto N, Itoh H, Nakao K. Expression of the adrenomedullin gene in adipose tissue. Regul Pept. 2005;132(1–3):17–22. [DOI] [PubMed] [Google Scholar]
- 3.Harmancey R, Senard JM, Pathak A, Desmoulin F, Claparols C, Rouet P, Smih F. The vasoactive peptide adrenomedullin is secreted by adipocytes and inhibits lipolysis through NO-mediated beta-adrenergic agonist oxidation. FASEB J. 2005;19(8):1045–1047. [DOI] [PubMed] [Google Scholar]
- 4.Li Y, Jiang C, Wang X, Zhang Y, Shibahara S, Takahashi K. Adrenomedullin is a novel adipokine: adrenomedullin in adipocytes and adipose tissues. Peptides. 2007;28(5):1129–1143. [DOI] [PubMed] [Google Scholar]
- 5.Hinson JP, Kapas S, Smith DM. Adrenomedullin, a multifunctional regulatory peptide. Endocr Rev. 2000;21(2):138–167. [DOI] [PubMed] [Google Scholar]
- 6.McLatchie LM, Fraser NJ, Main MJ, Wise A, Brown J, Thompson N, Solari R, Lee MG, Foord SM. RAMPs regulate the transport and ligand specificity of the calcitonin-receptor-like receptor. Nature. 1998;393(6683):333–339. [DOI] [PubMed] [Google Scholar]
- 7.Fukai N, Yoshimoto T, Sugiyama T, Ozawa N, Sato R, Shichiri M, Hirata Y. Concomitant expression of adrenomedullin and its receptor components in rat adipose tissues. Am J Physiol Endocrinol Metab. 2005;288(1):E56–62. [DOI] [PubMed] [Google Scholar]
- 8.Martinez A, Elsasser TH, Bhathena SJ, Pio R, Buchanan TA, Macri CJ, Cuttitta F. Is adrenomedullin a causal agent in some cases of type 2 diabetes? Peptides. 1999;20(12):1471–1478. [DOI] [PubMed] [Google Scholar]
- 9.Turk HM, Buyukberber S, Sevinc A, Ak G, Ates M, Sari R, Savli H, Cigli A. Relationship between plasma adrenomedullin levels and metabolic control, risk factors, and diabetic microangiopathy in patients with type 2 diabetes. Diabetes Care. 2000;23(6):864–867. [DOI] [PubMed] [Google Scholar]
- 10.Kitamura K, Kangawa K, Kawamoto M, Ichiki Y, Nakamura S, Matsuo H, Eto T. Adrenomedullin: a novel hypotensive peptide isolated from human pheochromocytoma. Biochem Biophys Res Commun. 1993;192(2):553–560. [DOI] [PubMed] [Google Scholar]
- 11.Iemura-Inaba C, Nishikimi T, Akimoto K, Yoshihara F, Minamino N, Matsuoka H. Role of adrenomedullin system in lipid metabolism and its signaling mechanism in cultured adipocytes. Am J Physiol Regul Integr Comp Physiol. 2008;295(5):R1376–1384. [DOI] [PubMed] [Google Scholar]
- 12.Pennington KA, van der Walt N, Pollock KE, Talton OO, Schulz LC Effects of acute exposure to a high fat, high sucrose diet on gestational glucose tolerance and subsequent maternal health in mice. Biology of Reproduction. 2017. [DOI] [PubMed] [Google Scholar]
- 13.Pennington KA, Harper JL, Sigafoos AN, Beffa LM, Carleton SM, Phillips CL, Schulz LC. Effect of food restriction and leptin supplementation on fetal programming in mice. Endocrinology. 2012;153(9):4556–4567. [DOI] [PMC free article] [PubMed] [Google Scholar]
- 14.Dong Y, Betancourt A, Chauhan M, Balakrishnan M, Lugo F, Anderson ML, Espinoza J, Fox K, Belfort M, Yallampalli C. Pregnancy Increases Relaxation in Human Omental Arteries to the CGRP Family of Peptides. Biology of reproduction. 2015;93(6):134. [DOI] [PMC free article] [PubMed] [Google Scholar]
- 15.Barker G, Lim R, Georgiou HM, Lappas M. Omentin-1 is decreased in maternal plasma, placenta and adipose tissue of women with pre-existing obesity. PloS one. 2012;7(8):e42943. [DOI] [PMC free article] [PubMed] [Google Scholar]
- 16.Dong Y, Chauhan M, Betancourt A, Belfort M, Yallampalli C. Adipose Tissue Inflammation and Adrenomedullin Overexpression Contribute to Lipid Dysregulation in Diabetic Pregnancies. J Clin Endocrinol Metab. 2018. [DOI] [PMC free article] [PubMed] [Google Scholar]
- 17.Heydemann A An Overview of Murine High Fat Diet as a Model for Type 2 Diabetes Mellitus. Journal of diabetes research. 2016;2016:2902351. [DOI] [PMC free article] [PubMed] [Google Scholar]
- 18.Guo S Insulin signaling, resistance, and the metabolic syndrome: insights from mouse models into disease mechanisms. J Endocrinol. 2014;220(2):T1–T23. [DOI] [PMC free article] [PubMed] [Google Scholar]
- 19.Govers R Molecular mechanisms of GLUT4 regulation in adipocytes. Diabetes Metab. 2014;40(6):400–410. [DOI] [PubMed] [Google Scholar]
- 20.Hasan AU, Ohmori K, Hashimoto T, Kamitori K, Yamaguchi F, Rahman A, Tokuda M, Kobori H. PPARgamma activation mitigates glucocorticoid receptor-induced excessive lipolysis in adipocytes via homeostatic crosstalk. J Cell Biochem. 2018;119(6):4627–4635. [DOI] [PMC free article] [PubMed] [Google Scholar]
- 21.Shirai K, Itoh Y, Sasaki H, Totsuka M, Murano T, Watanabe H, Miyashita Y. The effect of insulin sensitizer, troglitazone, on lipoprotein lipase mass in preheparin serum. Diabetes research and clinical practice. 1999;46(1):35–41. [DOI] [PubMed] [Google Scholar]
- 22.Scherer PE. Adipose tissue: from lipid storage compartment to endocrine organ. Diabetes. 2006;55(6):1537–1545. [DOI] [PubMed] [Google Scholar]
- 23.Savage DB, Petersen KF, Shulman GI. Disordered lipid metabolism and the pathogenesis of insulin resistance. Physiol Rev. 2007;87(2):507–520. [DOI] [PMC free article] [PubMed] [Google Scholar]
- 24.Ohira M, Miyashita Y, Ebisuno M, Saiki A, Endo K, Koide N, Oyama T, Murano T, Watanabe H, Shirai K. Effect of metformin on serum lipoprotein lipase mass levels and LDL particle size in type 2 diabetes mellitus patients. Diabetes research and clinical practice. 2007;78(1):34–41. [DOI] [PubMed] [Google Scholar]
- 25.Cadoudal T, Fouque F, Benelli C, Forest C. [Glyceroneogenesis and PEPCK-C: pharmacological targets in type 2 diabetes]. Medecine sciences : M/S. 2008;24(4):407–413. [DOI] [PubMed] [Google Scholar]
- 26.Lee CH, Olson P, Evans RM. Minireview: lipid metabolism, metabolic diseases, and peroxisome proliferator-activated receptors. Endocrinology. 2003;144(6):2201–2207. [DOI] [PubMed] [Google Scholar]
- 27.Schoonjans K, Staels B, Auwerx J. The peroxisome proliferator activated receptors (PPARS) and their effects on lipid metabolism and adipocyte differentiation. Biochim Biophys Acta. 1996;1302(2):93–109. [DOI] [PubMed] [Google Scholar]


