

Abstract
Inflamm-aging was recently affiliated with the progression of diabetic complications. Local cellular senescence together with senescence-associated secretory phenotype (SASP) are the main contributors to inflamm-aging. However, little is known about their involvement in diabetic periodontitis. Gingiva is the first line of host defense in the periodontium, and macrophages are key SASP-carrying cells. Here, we explored the molecular mechanism by which hyperglycemia drives the inflamm-aging in the gingival tissue of diabetic mice and macrophages. We demonstrated that hyperglycemia increased the infiltrated macrophage senescence in gingival tissue of diabetic mice. Simultaneously, hyperglycemia elevated the local burden of senescent cells in gingival tissue and induced the serum secretion of SASP factors in vivo. Moreover, in vitro, high glucose induced macrophage senescence and SASP factors secretion through phosphorylation of NLRC4, which further stimulated the NF-κB/Caspase-1 cascade via an IRF8-dependent pathway. Deletion of NLRC4 or IRF8 abolished hyperglycemia-induced cellular senescence and SASP in macrophages. In addition, we found that treatment with metformin inhibited NLRC4 phosphorylation and remarkably decreased cellular senescence and SASP in the context of hyperglycemia. Our data demonstrated that hyperglycemia induces the development of inflamm-aging in gingival tissue and suggested that NLRC4 is a potential target for treatment of diabetes-associated complications.
Keywords: diabetes, inflammasome, cellular senescence, aging, inflammation, gingiva, hyperglycemia, inflamm-aging, NLRC4, SASP
Introduction
Diabetes mellitus is a heterogeneous group of disorders that affect millions of people (1). Hyperglycemia, the hallmark of diabetes mellitus, is associated with a range of complications, including periodontitis (2). Diabetes increases the susceptibility to periodontitis and leads to more severe inflammation (3). Recently, inflamm-aging was linked to the etiology of diabetic complications. Cellular senescence and senescence-associated secretory phenotype (SASP)2 are the key contributors to inflamm-aging (4). Evidence indicates that senescent cell burden increases in tissues that undergo functional damage in diabetes, such as the skin, pancreas, and kidney (5–9). Cellular senescence is crucial in the acquisition of the SASP, which also mediates tissue dysfunction through a chronic secretion of proinflammatory cytokines, leading to diabetic complications (10–12). The SASP factors inversely affect the surrounding cells and accelerate cellular senescence (13). In periodontium, the gingiva plays an important role as a mechanical barrier against bacterial invasion and as a part of the innate immune response to infectious inflammation (14). The senescent cell burden in tissue and SASP may directly contribute to diabetes-related gingival dysfunction and susceptibility to periodontal pathogens infection. However, the underlying pathogenesis has not yet been elucidated. In vivo data have suggested that macrophages are key SASP-carrying cells (13, 15). Concurrently, macrophages are innate immune cells in gingiva (16) that may be key to SASP factors secretion. However, how high glucose induces cell senescence and SASP in macrophages remains elusive.
The main pathways involved in cellular senescence regulation, including the nucleotide-binding and oligomerization domain–like receptor (NLR) family inflammasomes and interleukin (IL)-1β pathway, are master modulators of aging (17–19). The inflammasomes are cytosolic multiprotein complexes that recruit and activate Caspase-1, a key protease that triggers secretion of the inflammatory cytokine IL-1β (20). The inflammasomes can be activated by many danger signals, including hyperglycemia (21). Recent publications provided new evidence that the NLR family caspase activation and recruitment domain–containing 4 (NLRC4) correlates with inflamm-aging (22). Moreover, NLRC4-driven IL-1β production is critical for the progression of diabetic nephropathy (23). NLRC4 is also reported to play a vital role in the progression of brain inflamm-aging (24). Hence, the activation of NLRC4 in diabetes may induce cell senescence and SASP in gingiva.
In this study, a mouse model of hyperglycemia was used to investigate the local burden of senescent cells in gingiva and SASP in serum. Moreover, we utilized RAW264.7 macrophage cell lines to dissect the mechanistic role of NLRC4 in the progression of hyperglycemia-induced cell senescence and SASP in vitro. In addition, treatment with metformin in vivo and in vitro allowed preliminary insights into therapeutics for ameliorating the high local burden of senescent cells and SASP in gingiva.
Results
Hyperglycemia increases senescent cell burden in gingival tissue and induces SASP in serum of diabetic mice
To eliminate the influence of age and focus on the effect of glucose only, 4-week-old mice were rendered hyperglycemic by successive injections of streptozotocin (STZ) (Fig. 1A). As shown in Fig. 1B, the blood glucose of the diabetic mice significantly increased between weeks 7 and 11 and stabilized at ∼30 mm between weeks 11 and 17. Western blotting analysis confirmed that p16 and p21 expression levels gradually increased in gingival tissue of diabetic mice from weeks 7 to 11 alongside the rise of blood glucose and elevated significantly from weeks 13 to 17 compared with the control mice (Fig. 1C). Immunohistochemical (IHC) staining of gingival tissue revealed that the p16-positive and p21-positive cells gradually increased from weeks 9 to 17 and significantly increased from weeks 11 to 17 under ∼30 mm blood glucose in diabetic mice compared with the control (Fig. 1D). Then we determined whether hyperglycemia induced SASP in diabetic mice. We identified typical SASP factors in the serum of mice using a Luminex assay customization tool. As shown in Fig. 1E, expression of numerous cytokines changed to varying degrees. Pro-inflammatory cytokines, such as IL-1β, tumor necrosis factor (TNF) α, IL-6, matrix metalloproteinase (MMP)-2, MMP-8, and advanced glycation end products (AGEs), gradually increased in the diabetic mice. However, anti-inflammatory cytokines like IL-10 and adiponectin were significantly lower in diabetic than in control mice. Moreover, we investigated whether macrophages in the gingiva of diabetic mice were senescent. As shown in Fig. 1F, immunofluorescence staining revealed increased infiltration of macrophages (F4/80-positive cell) in gingival tissue of diabetic mice, and a significantly higher rate of p16-positive cells among these macrophages.
Figure 1.

Hyperglycemia increased the gingival senescent burden and induced serum SASP in diabetic mice. A, all protocols were performed strictly according to the procedure. C57 mice were rendered diabetic by STZ injections and sacrificed every 2 weeks. B, fasting glucose levels were determined every 2 weeks from weeks 5 to 17. The p value between control mice (N group) and diabetic mice (D group) is shown. **, p < 0.01. C, Western blotting analysis showing p16 and p21 specific immunoreactivity in the gingival tissue of the N group and the D group. The optical density (O.D.) values of p16 and p21 levels relative to β-actin are represented in bar histograms. The data are means ± S.D. (n = 3). *, p < 0.05; **, p < 0.01 versus N group. Panel C here and panels A and E in Fig. 3 use the same band of β-actin because of the identical protein sample in same Western blotting experiment. D, immunohistochemistry using antibody against p16 and p21 was analyzed in the gingival tissue of N group and D group. Scale bar, 50 μm. The percentage of positive cells is represented in bar histograms. The data are means ± S.D. (n = 3). *, p < 0.05; **, p < 0.01 versus N group. E, the SASP factors in the serum of N group and D group were determined every 2 weeks by a Luminex assay customization tool and shown in the heat map. F, gingival tissues of N group and D group were stained for immunofluorescence using an F4/80 antibody targeting macrophages (red) and a p16 antibody (green). The nuclei were stained with DAPI (blue). Scale bar, 50 μm.
High glucose induces cellular senescence and SASP in macrophage
In vivo data revealed higher infiltration of senescent macrophages in gingival tissue of diabetic mice. Next, we investigated whether high glucose induced cellular senescence and SASP in vitro using the macrophage cell line RAW 264.7. The activity of senescence-associated β-gal (SA–β-gal), a canonical marker of cell senescence (25), gradually increased in macrophages exposed to 10–30 mm glucose for 24 h (Fig. 2A). Concomitantly, Western blotting also showed that p16 and p21 were gradually up-regulated with increasing glucose concentrations (Fig. 2B). The rate of SA–β-gal–positive (blue-stained) cells and the expression levels of p16 and p21 under 30 mm glucose for 24 h were significantly higher than under 5 mm glucose for 24 h and under 30 mm glucose for 6 h (#, p < 0.05; ##, p < 0.01; *, p < 0.05; and **, p < 0.01, respectively) (Fig. 2, A and B). In addition, Luminex analysis (Fig. 2C) revealed that within the SASP factors, pro- and anti-inflammatory cytokines significantly increased and decreased, respectively, after high-glucose stimulation. The trends were consistent with the SASP of diabetic mice in vivo. We concluded that 30 mm glucose treatment for 24 h might be the optimal condition for high glucose–induced cellular senescence and SASP in macrophages. Then we determined whether the growth of senescent macrophages was arrested. Using 5-ethynyl-2-deoxyuridine (EdU) as a cell-proliferation marker, macrophages exposed to 30 mm glucose for 24 h show significantly less EdU-positive cells than those exposed to 5 mm glucose for 24 h and 30 mm glucose for 6 h (##, p < 0.01; and **, p < 0.01, respectively; Fig. 2D).
Figure 2.

High glucose induced cellular senescence and SASP in macrophage derived from RAW 264.7 cell. A, the activity of SA–β-gal was determined in macrophage exposed to 5–30 mm glucose for 6 or 24 h. Scale bar, 100 μm. The rate of SA–β-gal–positive (blue-stained) cells is represented in bar histograms. The data are means ± S.D. (n = 3). **, p < 0.01 versus 30 mm glucose for 6 h. ##, p < 0.01 versus 30 mm glucose for 24 h. B, the expression levels of p16 and p21 in macrophage were analyzed by Western blotting. The O.D. values of p16 and p21 levels relative to β-actin are represented in bar histograms. The data are means ± S.D. (n = 3). *, p < 0.05; **, p < 0.01 versus 30 mm glucose for 6 h. #, p < 0.05; ##, p < 0.01 versus 30 mm glucose for 24 h. Panel B here and panels C and F in Fig. 3 use the same band of β-actin because of the identical protein sample in same Western blotting experiment. C, the SASP factors in the supernatant of macrophage were determined by a Luminex assay customization tool and shown in the heat map. D, cell proliferation was detected using EdU detection kits to analyze the incorporation of EdU during DNA synthesis. Scale bar, 100 μm. The percentage of proliferating cells is represented in bar histograms. The data are means ± S.D. (n = 3). **, p < 0.01 versus 30 mm glucose for 6 h. ##, p < 0.01 versus 30 mm glucose for 24 h.
High glucose activates the phosphorylation of NLRC4
NLRC4 may be a key factor in the regulation of inflamm-aging (18, 19, 22, 24), and IRF8 is required for activation of NLRC4 inflammasome (26). Hence, we determined the activation of NLRC4 under hyperglycemia-induced cellular senescence microenvironment in vivo and in vitro by analysis of the target proteins. Western blotting results revealed that IRF8 and NLRC4 levels were higher in gingival tissue of diabetic than control mice between weeks 9 and 17 (Fig. 3A). IHC staining also showed significantly higher rates of IRF8- and NLRC4-positive cells in gingival tissue of diabetic compared with control mice in week 17 (Fig. 3B). Interestingly, phosphorylation of NLRC4 is critical for inflammasome activation (27, 28). Western blotting results revealed that the phosphorylation of NLRC4 significantly increased in gingival tissue of diabetic mice compared with control mice between weeks 9 and 17 (Fig. 3A). In vitro, Western blotting showed that the levels of IRF8, p-NLRC4, and NLRC4 gradually increased in macrophages exposed to 10–30 mm for 24 h (Fig. 3C). Accordingly, IRF8, p-NLRC4, and NLRC4 levels under 30 mm glucose for 24 h were significantly higher than under 5 mm glucose for 24 h and under high glucose for 6 h (#, p < 0.05; ##, p < 0.01; *, p < 0.01; and **, p < 0.01, respectively). Immunofluorescence staining revealed that in macrophages exposed to 30 mm glucose for 24 h, IRF8 and NLRC4 increasingly accumulated in the cytoplasm and formed a ring-like structure (Fig. 3D). Simultaneously, NLRC4 could recruit and activate Caspase-1 (20). As shown in Fig. 3E, diabetic mice have significantly higher levels of Caspase-1 p45 and p20 than control mice in week 17. In vitro, 30 mm glucose for 24 h could significantly increase the expression of Caspase-1 p45 and p20 compared with 5 mm glucose for 24 h and 30 mm glucose for 6 h (#, p < 0.05; ##, p < 0.01; *, p < 0.01; and **, p < 0.01, respectively) (Fig. 3F). As reported, SASP is mostly induced by NF-κB (29, 30). Consistently, Western blotting analysis revealed that high glucose could increase the expression of NF-κB in vivo (Fig. 3E) and in vitro (Fig. 3F).
Figure 3.

NLRC4-related pathway was activated in the gingival tissue of diabetic mice and macrophage exposed to high glucose for 24 h. A, Western blotting analysis showing IRF8, p-NLRC4, and NLRC4 specific immunoreactivity in the gingival tissue of the N and D groups. The O.D. values of IRF8, p-NLRC4, and NLRC4 levels relative to β-actin are represented in bar histograms. The data are means ± S.D. (n = 3). *, p < 0.05; **, p < 0.01 versus N group. B, representative of immunohistochemical staining of IRF8 and NLRC4 on the gingival sections from the N group and D group. Scale bar, 50 μm. The percentage of positive cells was calculated and is represented in bar histograms. The data are means ± S.D. (n = 3). *, p < 0.05; **, p < 0.01 versus N group. C, the expression levels of IRF8, p-NLRC4, and NLRC4 in macrophage were analyzed by Western blotting. The O.D. values of IRF8, NLRC4, and p-NLRC4 levels relative to β-actin are represented in bar histograms. The data are means ± S.D. (n = 3). *, p < 0.05; **, p < 0.01 versus 30 mm glucose for 6 h. #, p < 0.05; ##, p < 0.01 versus 30 mm glucose for 24 h. The black vertical line represents the splicing border, because there is a protein marker between the 6- and 24-h samples in one band. D, IRF8 and NLRC4 levels were measured by immunofluorescence staining. Scale bar, 50 μm. The fluorescence intensity is represented in bar histograms. The data are means ± S.D. (n = 3). *, p < 0.05; **, p < 0.01 versus 5 mm glucose for 24 h. E, the expression levels of Caspase-1, cleaved Caspase-1, and NF-κB were analyzed by Western blotting in vivo. The O.D. values of Caspase-1, cleaved Caspase-1, and NF-κB levels relative to β-actin are represented in bar histograms. The data are means ± S.D. (n = 3). *, p < 0.05; **, p < 0.01 versus N group. Fig. 1C and panels A and E in Fig. 3 use the same band of β-actin because of the identical protein sample in same Western blotting experiment. F, the expression levels of Caspase-1, cleaved Caspase-1, and NF-κB were analyzed by Western blotting in vitro. The O.D. values of Caspase-1, cleaved Caspase-1, and NF-κB levels relative to β-actin are represented in bar histograms. The data are means ± S.D. (n = 3). *, p < 0.05; **, p < 0.01 versus 30 mm glucose for 6 h. #, p < 0.05; ##, p < 0.01 versus 30 mm glucose for 24 h. The black vertical line represents the splicing border, because there is a protein marker between the 6- and 24-h samples in one band. Figs. 2B and 3 (C and F) use the same band of β-actin because of the identical protein sample in same Western blotting experiment.
Deletion of IRF8 or NLRC4 abolishes high glucose–induced cell senescence and SASP in macrophages
To pinpoint the contribution of NLRC4 to hyperglycemia-induced cell senescence and SASP, we knocked out NLRC4 in macrophages with the CRISPR/Cas9 system. Confirming previous results, the 24-h treatment with 30 mm glucose increased the rate of SA–β-gal–positive cells (Fig. 4A) and accumulated p16 and p21 in the cytoplasm of macrophages (Fig. 4B). However, the same treatment in NLRC4−/− macrophages distinctly down-regulated the activity of SA–β-gal (Fig. 4A) and decreased the cytoplasmic expression of p16 and p21 (Fig. 4B). Among the SASP factors, pro- and anti-inflammatory cytokines significantly decreased and increased, respectively (Fig. 4C). Simultaneously, the expression of Caspase-1 p45, Caspase-1 p20, and NF-κB was down-regulated (Fig. 4D). Interestingly, knockout of NLRC4 decreased the expression level of IRF8 that is recognized as upstream of NLRC4 (26) (Fig. 4D). Furthermore, among IRF8−/− macrophages, cells showing positive SA–β-gal signal (Fig. 4A) and cytoplasmic expression of p16 and p21 (Fig. 4B) also significantly decreased. In addition, IRF8 knockout dephosphorylated NLRC4 and decreased the expression levels of NLRC4, Caspase-1 p45, Caspase-1 p20, and NF-κB (Fig. 4D). Meanwhile, the SASP factors showed similar changes as in NLRC4−/− macrophages exposed to 30 mm for 24 h (Fig. 4C). Thus, high glucose could not induce cellular senescence and SASP in IRF8−/− and NLRC4−/− macrophages.
Figure 4.

High glucose was incapable of inducing cellular senescence and SASP in in IRF8−/− or NLRC4−/− macrophage exposed to 30 mm glucose for 24 h. A, the activity of SA–β-gal was determined in control, NLRC4−/−, and IRF8−/− macrophage exposed to 5 and 30 mm glucose for 24 h. Scale bar, 100 μm. The rate of SA–β-gal–positive cells is represented in bar histograms. The data are means ± S.D. (n = 3). **, p < 0.01 versus control CRISPR/Cas9 plasmid (30 mm glucose). B, p16 and p21 levels were measured by immunofluorescence staining. Scale bar, 50 μm. The fluorescence intensity is represented in bar histograms. The data are means ± S.D. (n = 3). **, p < 0.01 versus control CRISPR/Cas9 plasmid (30 mm glucose). C, the change of SASP-associated factors is displayed in the heat map. D, Western blotting analysis showing IRF8, p-NLRC4, NLRC4, Caspase-1, cleaved Caspase-1, NF-κB, p16, and p21 specific immunoreactivity. The O.D. values of these proteins' levels relative to β-actin are represented in bar histograms. The data are means ± S.D. (n = 3). *, p < 0.05; **, p < 0.01 versus control CRISPR/Cas9 plasmid (30 mm glucose).
Metformin alleviated senescent cell burden in gingival tissue and SASP factor secretion in serum of diabetic mice
Metformin was recently revealed to reduce the risk and progression of inflamm-aging (31). Here, we examined whether metformin could attenuate hyperglycemia-induced cellular senescence and SASP. In vivo, metformin had a remarkable hypoglycemic effect for diabetic mice (Fig. 5B). IHC revealed that p16- and p21-positive cells decreased in gingival tissue of diabetic mice treated with metformin (Fig. 5C). Accordingly, Western blotting analysis in these mice showed significant down-regulation of p16 and p21 in gingival tissue (Fig. 5F). Simultaneously, metformin could markedly ameliorate proinflammatory cytokines IL-1β, IL-6, TNFα, MMP-2, MMP-8, and AGEs and increase the levels of IL-10 and adiponectin (Fig. 5D). As shown in Fig. 5E, immunofluorescence staining indicated that metformin decreased the infiltration of senescent macrophages (F4/80/p16-positive cells) in gingival tissue of diabetic mice. Interestingly, metformin could also dephosphorylate and inhibit the expression of NLRC4 (Fig. 5F). Finally, metformin treatment also down-regulated IRF8, Caspase-1 p45, Caspase-1 p20, and NF-κB in gingival tissue (Fig. 5F).
Figure 5.

Metformin ameliorated the burden of senescent cells in gingival tissue and the SASP in serum of diabetic mice. A, all protocols were performed strictly according to the procedure. The diabetic mice were treated with the metformin (300 mg/kg body weight, everyday) from weeks 9 to 17. B, fasting blood glucose levels were determined at sacrifice (week 17) among control mice (N group), diabetic mice (D group), and diabetic mice treated with metformin (DM group). The data are means ± S.D. (n = 3). *, p < 0.05; **, p < 0.01 versus D group. C, representative of immunohistochemical staining of p16, p21, IRF8, and NLRC4 on the gingival sections from the N, D, and DM groups. Scale bar, 50 μm. The percentage of positive cells was calculated and is represented in bar histograms. The data are means ± S.D. (n = 3). *, p < 0.05; **, p < 0.01 versus the D group. D, the SASP factors in the serum of the N, D, and DM groups were determined at sacrifice (week 17) by a Luminex assay customization tool and shown in the heat map. E, the gingival tissues of the N, D, and DM group mice were stained for immunofluorescence using an F4/80 antibody targeting macrophages (red) and a p16 antibody (green). The nuclei were stained with DAPI (blue). Scale bar, 50 μm. F, IRF8, p-NLRC4, NLRC4, Caspase-1, cleaved Caspase-1, NF-κB, p16, and p21 in the gingival tissue of the N, D, and DM groups were analyzed by Western blotting. The O.D. values of these proteins' levels relative to β-actin are represented in bar histograms. The data are means ± S.D. (n = 3). *, p < 0.05; **, p < 0.01 versus D group.
Metformin attenuated hyperglycemia-induced cellular senescence and SASP through the dephosphorylation of NLRC4 in macrophage
In vitro, co-treatment with 10 mm metformin and 30 mm glucose for 24 h in macrophages decreased SA–β-gal–positive cells (Fig. 6A) and reduced the expression and accumulation of p16 and p21 in the cytoplasm (Fig. 6B). Meanwhile, metformin altered the SASP factors by decreasing the pro-inflammatory and increasing the anti-inflammatory cytokines (Fig. 6C). Consistently with the in vivo results, metformin decreased the phosphorylation of NLRC4 and the expression levels of IRF8, NLRC4, Caspase-1 p45, Caspase-1 p20, and NF-κB in macrophages exposed to high glucose for 24 h (Fig. 6D). Finally, as shown in Fig. 6E, metformin also decreased the accumulation of IRF8 and NLRC4 in the cytoplasm.
Figure 6.

Metformin attenuated high glucose–induced cellular senescence and SASP in macrophage exposed to high glucose (30 mm) for 24 h. A, the activity of SA–β-gal were determined in macrophage treated with low glucose (5 mm) (N), high glucose (30 mm) (HG), and high glucose (30 mm) + metformin (10 mm) (HGM). Scale bar, 100 μm. The rate of SA–β-gal–positive cells was calculated and is represented in bar histograms. The data are means ± S.D. (n = 3). *, p < 0.05; **, p < 0.01 versus HG. B and E, p16, p21, IRF8, and NLRC4 levels were measured by immunofluorescence staining. Scale bar, 50 μm. The fluorescence intensity is represented in bar histograms. The data are means ± S.D. (n = 3). **, p < 0.01 versus HG. C, the change of SASP factors are displayed in the heat map. D, the expression levels of IRF8, p-NLRC4, NLRC4, Caspase-1, cleaved Caspase-1, NF-κB, p16, and p21 in N, HG, and HGM were analyzed by Western blotting. The O.D. values of these proteins' levels relative to β-actin are represented in bar histograms. The data are means ± S.D. (n = 3). *, p < 0.05; **, p < 0.01 versus HG.
Discussion
In this study, we investigated the biological mechanism by which hyperglycemia aggravated the inflamm-aging of macrophages in gingival tissue via NLRC4 phosphorylation and induced a high local burden of senescent cells and the secretion of SASP factors. The activation of NLRC4 stimulated the NF-κB/Caspase-1 cascade via IRF8-dependent signaling. Moreover, we found that metformin modulated hyperglycemia-induced cellular senescence and SASP through a NLRC4-dependent pathway. Therefore, we identified a NLRC4-mediated causal link between hyperglycemia and the inflamm-aging in gingival tissue and macrophages.
Periodontitis is one of the major complications of diabetes mellitus, and hyperglycemia increases the susceptibility to and severity of this condition (32). In the development of this disease, the gingiva is a critical component of innate immunity and provides protection as a mechanical barrier against microbial invasion (14). Growing epidemiological evidence demonstrated that the accumulation of senescent cells in tissues was associated with diabetic complications (33). Meanwhile, senescent cells secrete a number of extracellular factors leading to SASP that can reinforce senescence and amplify inflammation (13, 34). Cellular senescence and SASP could cause the chronic, low-grade, systemic inflammation occurring in the absence of overt infection (sterile inflammation) defined as “inflamm-aging” (4, 35, 36) that recently emerged as a possible pathogenesis of tissue dysfunction (9, 33). Macrophages are important immune cells in gingiva (16, 37) as SASP promoters (13, 15). When stimulated by internal environmental factors including high glucose, macrophages may be induced to senescence and then oversecrete various SASP factors and propagate senescence (13, 38, 39). Hyperglycemia may play an important role in the accumulation of senescent cells and secretion of SASP in gingival tissue, thus causing gingival dysfunction. However, the role of cellular senescence and SASP in the pathogenesis of diabetic complications have not been fully explored.
In our study, we established the diabetic mouse model using 4-week-old mice to eliminate the effect of age and explore the single effect of hyperglycemia. We found that the senescent cells significantly increased in gingival tissue of diabetic mice from weeks 9 to 17. This indicated that hyperglycemia induced a high local burden of senescent cells in gingival tissue that may consequently damage its barrier function (33). Simultaneously, we found that hyperglycemia significantly increased the infiltration of senescent macrophages in gingival tissue of diabetic mice. In the serum of diabetic mice, we observed that TNFα, IL-1β, IL-6, MMP-2, MMP-8, and AGEs significantly increased compared with control mice. These are the pivotal proinflammatory cytokines involved in aggravating inflammation and tissue dysfunction in diabetic periodontitis (40–42). Conversely, we found decreased secretion of IL-10 and adiponectin, which play a central role in limiting inflammation in diabetic periodontitis (43, 44). As the key SASP-carrying cells (13, 15), senescent macrophages could secrete numerous SASP factors in gingival microenvironment to reinforce and propagate senescence, amplifying the senescent cell burden and SASP factors secretion. Gingival crevicular fluid, the gingival microenvironment, is mainly originated from the serum (45). Despite the discrepancy in cytokine concentrations and the lack of correlation among different biological matrices, an overall high agreement in the detection of cytokine levels was observed in serum and gingival crevicular fluid (46). SASP in the serum of diabetic mice could reflect the average inflammatory level of the gingival microenvironment. Macrophages may be the principle source of SASP factors in gingival microenvironment, and induce a high local burden of senescent cells in gingival tissue. Moreover, in vitro, 30 mm glucose for 24 h could increase p16 and p21 expression and SA–β-gal activity and reduce cell proliferation in macrophages, demonstrating that high glucose could accelerate macrophage senescence. SASP changes in the supernatant of macrophages exposed to high glucose were consistent with those observed in vivo. These results implied that hyperglycemia could trigger the inflamm-aging in macrophages, suggesting a potential new contributor to the development of low-grade inflammation and possibly diabetic periodontitis.
The molecular mechanism of hyperglycemia-induced cellular senescence and SASP is not clear. The NLRC4 inflammasome has recently been implicated in inflamm-aging (18, 19, 22, 24). Although the inflammasome can be activated by different danger signals, including high glucose (21), the only NLRC4 activators identified to date are bacterial flagellin and components of bacterial secretion systems (27). Previous studies revealed that the Salmonella enterica serovar Typhimurium could induce the phosphorylation of NLRC4 Ser533 (27, 28). Unlike WT NLRC4, S533A mutant could not activate Caspase-1 in NLRC4−/− macrophages in response to the S. enterica serovar Typhimurium, indicating that Ser533 phosphorylation is critical for NLRC4 function (27, 28). In our study, hyperglycemia up-regulated the expression of NLRC4 and induced its phosphorylation on Ser533 in the gingival tissue of diabetic mice, while also activating Caspase-1. Similarly, in macrophages, the high-glucose microenvironment also induced the expression and phosphorylation of NLRC4 and activated Caspase-1. In turn, activated Caspase-1 stimulated IL-1β productions in vivo and in vitro. However, the mechanism underlying NLRC4 phosphorylation remains unclear. We suggest that NLRC4 phosphorylation could be promoted by a hyperglycemia-associated protein with homologous function to the known NLRC4-activating bacterial components (23, 47). Recent research revealed that IRF8 is an upstream regulator of NLR family apoptosis inhibitory proteins (NAIPs), ultimately contributing to NLRC4 activity, but is dispensable for the activation of other inflammasome proteins, including NLRP3 (26). In our research, we revealed that IRF8 levels increased consistently with p-NLRC4 and NLRC4 both in vivo and in vitro. Moreover, in diabetic mice and macrophages, high glucose also up-regulated NF-κB. Evidence indicated that NF-κB regulated the SASP by switching of inflammatory pathways (29, 30, 48, 49). In turn, NF-κB may be activated by IL-1β binding to IL-1 receptors (50). In addition, NLRC4 may activate TAK1 through caspase activation and recruitment domains (CARD) to increase the expression of NF-κB (51). Therefore, the activation of NLRC4 may regulate the SASP through NF-κB.
To determine the link between NLRC4 activation and inflamm-aging in the context of high glucose, we knocked out NLRC4 in macrophages and observed that cellular senescence and SASP improved in high glucose microenvironment. Interestingly, IRF8 was down-regulated after knockout of NLRC4, indicating a feedback regulation between NLRC4 and IRF8. As expected, knockout of IRF8 down-regulated the expression and phosphorylation of NLRC4 while simultaneously decreasing the expression of Caspase-1 and NF-κB. Because IRF8 is required for phosphorylation of NLRC4, we speculate it may be a homologue to the NLRC4-activating bacterial components. Finally, knockout of IRF8 also ameliorated cellular senescence and SASP. Together, these results indicated that NLRC4 may be the key target of high glucose–induced cellular senescence and SASP.
Metformin was shown to possess an anti-inflammatory and anti-aging function in addition to its hypoglycemic effect (52, 53). Louro et al. (54) found that metformin treatment in type 2 diabetic mice could reduce serum levels of proinflammatory cytokines and improve the diabetic nephropathy inflammatory response. The Metformin, Anti-aging clinical trial supported by the U.S. Food and Drug Administration was considered a landmark of aging research (55). Concurrently, metformin was revealed to inhibit the expression of multiple inflammatory cytokines during cellular senescence and block NF-κB activity (56). Our findings provide a rationale to develop specific therapeutics for treating hyperglycemia-induced cellular senescence and SASP. In diabetic mice, metformin could decrease the infiltration of senescent macrophages while also alleviating the burden of senescent cells in gingiva and the SASP in serum. Interestingly, in vitro, metformin treatment could attenuate high glucose–induced cellular senescence and SASP in macrophages. This suggests that metformin may directly dephosphorylate NLRC4 in a high-glucose microenvironment; however, the detailed mechanism should be further studied. Overall, our results indicated that metformin may have an anti–inflamm-aging effect through direct inhibition of NLRC4 and indirect hypoglycemic effect.
Collectively, we observed that hyperglycemia-induced macrophage inflamma-ging accelerated gingival senescence through IRF8/NLRC4 signaling (Fig. 7), which was in turn amplified by NF-κB. We further demonstrated that metformin ameliorated hyperglycemia-induced senescence by inhibiting the phosphorylation of NLRC4, highlighting the pivotal role of this post-translational modification in inflamm-aging. Currently, the treatment of diabetic periodontitis is limited to blood glucose control and periodontal basic treatment. Identification of the underlying mechanisms will allow us to better understand the pathogenesis of diabetic periodontitis and help to develop the novel targeting-NLRC4 anti–inflamm-aging therapeutic strategies.
Figure 7.
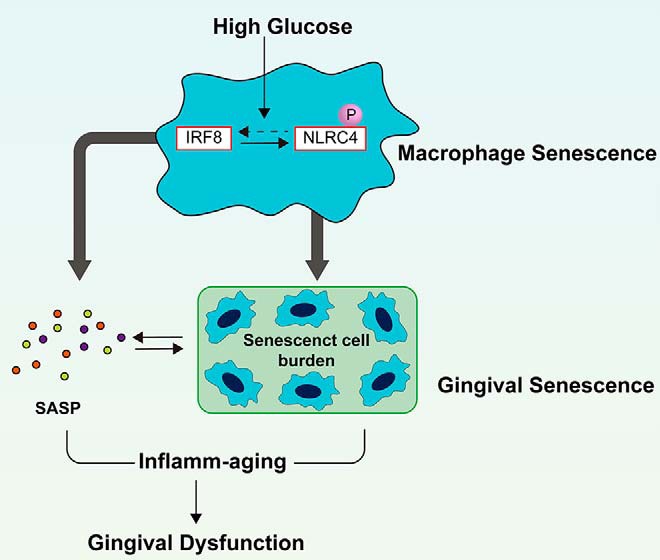
The potential mechanism of high glucose–induced inflamm-aging in gingival tissue.
Materials and methods
Animals
Four-week-old male C57BL/6 WT mice were obtained from the Model Animal Research Center of Nanjing University (Nanjing, China). Animal treatment was approved by the institutional committee for animal use and care in the Experimental Animal Center of West China Second University Hospital. The mice were given free access to a standard laboratory diet and tap water and caged individually under controlled temperature (23 ± 2 °C) and humidity (55 ± 5%) with an artificial light cycle. They were randomly divided into control mice (N group, n = 40), diabetic mice (D group, n = 40), and diabetic mice treated with metformin (DM group, n = 8). At 6 weeks of age, the mice in the D and DM groups were intraperitoneally injected with STZ (Sigma–Aldrich) at a dose of 55 mg/kg for 5 consecutive days. At 8 weeks of age, DM group was intragastrically infused with metformin (Sigma–Aldrich) at a dose of 300 mg/kg every day until sacrifice. Eight mice in N and D group were sacrificed every 2 weeks from weeks 9 to 17 of age, whereas the DM group was sacrificed at 17th week age.
Cell cultures and stimulation
RAW 264.7 murine macrophage cell line was obtained from American Type Culture Collection (ATCC, Manassas, VA). The cells were grown in Dulbecco's modified Eagle's medium (Gibco) supplemented with 10% fetal bovine serum (Gibco) and 1% penicillin/streptomycin (HyClone) and cultured at 37 °C in a humidified incubator in an atmosphere of 5% CO2. The cells were incubated with different concentrations of glucose (5–30 mm) and metformin (10 mm; Sigma) for 6 or 24 h, respectively.
CRISPR/Cas9 KO plasmid
To obtain knockout cells, we used the NLRC4 (sc-418306; Santa Cruz) or IRF8 (sc-421016; Santa Cruz) CRISPR/Cas9 KO plasmid sequences to target the NLRC4 or IRF8 DNA following the manufacturer's recommended protocol. In a 6-well tissue culture plate, 1.5–2.5 × 10⁵ cells were seeded in 3 ml of antibiotic-free standard growth medium/well. Twenty-four hours prior to transfection, the cells were grown to 80% confluency. The cells were then transfected with control, NLRC4, or IRF8 CRISPR/Cas9 KO plasmid and incubated for 24 h under normal culture conditions. The medium was replaced 24 h post-transfection, and the cells were stimulated with 5 and 30 mm glucose for 24 h.
Western blotting
Proteins were extracted from the RAW 264.7 cells or mouse mandible gingival tissues following the recommended protocol with a total protein extraction kit (Signalway Antibody LLC). Fifteen mg of protein from each sample was subjected to 5% SDS-PAGE and transferred to nitrocellulose membranes by electroblotting. The membranes were incubated overnight at 4 °C with primary antibodies against β-actin (1:1000; ta-09; ZSGB-BIO), p-NLRC4 (1:500; NM5491; ECMbiosciences), NLRC4 (1:1000; ab99860; Abcam), IRF8 (1:1000; sc-365042; Santa Cruz), Caspase-1 (1:1000; ET1608–69; Huabio), NF-κB p65 (1:1000; sc-514451; Santa Cruz), p16 (1:1000; sc-166760; Santa Cruz), and p21 (1:1000; sc-166630; Santa Cruz) followed by either secondary anti-rabbit (1:5000; 1706515; Bio-Rad) or anti-mouse (1:5000; ZB-2305; ZSGB-BIO) antibody for 1 h at room temperature. The signals were revealed using a West Pico chemiluminescent substrate system (SuperSignal, BioSpectrum 310 imaging system).
SA–β-gal staining
SA–β-gal staining was performed using the SA–β-gal staining kit (C0602; Beyotime Biotechnology, Shanghai, China) according to the manufacturer's instructions. The cells were washed three times with PBS and fixed with 4% (w/v) paraformaldehyde (PFA) for 15 min at room temperature. Then cells were incubated overnight at 37 °C in darkness with the working solution containing 0.05 mg/ml 5-bromo-4-chloro-3-indolyl β-d-galactoside. After being rinsed with PBS, the cells were observed at the microscope for the development of the blue coloration, at a magnification of 20×. The percentage of SA–β-gal–positive cells was calculated from five random fields by ImageJ software.
EdU staining
Cell proliferation was assessed using an EdU labeling/detection kit (C10310–1; RiboBio). RAW 264.7 cells were cultured in 6-well plates at 1 × 10⁶ cells/well and transfected with 5 or 30 mm glucose for 6 or 24 h. Then 50 mm EdU labeling medium was added to the 6-well plates, and they were incubated for 2 h at 37 °C under 5% CO2. After treatment with 4% PFA and 0.5% (v/v) Triton X-100, the cells were stained with anti-EdU working solution. Hoechst 33342 was used to label cell nuclei. The percentage of EdU-positive cells was calculated from five random fields by ImageJ.
Immunocytochemistry
After 15-min fixation in 4% PFA and 10-min incubation in 0.1% Triton X-100 at room temperature, the cells were blocked in PBS containing 4% (v/v) goat serum and 1% (v/v) glycerol for 1 h at room temperature. The cells were then incubated overnight at 4 °C with primary antibodies against p16 (1:100; sc-166760; Santa Cruz), p21 (1:100; sc-166630; Santa Cruz), NLRC4 (1:100; sc-514658; Santa Cruz), and IRF8 (1:100; sc-365042; Santa Cruz) followed by the corresponding secondary antibodies, anti-mouse Alexa Fluor 488 (1:200; ab150113; Abcam) for 1 h at 37 °C and 4′,6-diamidino-2-phenylindole (DAPI) for 2 min at 37 °C for nuclear staining. The images were obtained by the Pannoramic MIDI (3D HISTECH). The fluorescence intensity was calculated by ImageJ.
Luminex assay
Mouse serum and supernatant of RAW264.7 cells were applied on a Luminex assay customization tool (R&D Systems, Minneapolis, MN) following the manufacturer's instructions. Cytokine-specific changes between cohorts were visualized by row-specific Z-scores in a heat map.
Immunohistochemical staining
Mouse maxillary samples were fixed with 4% PFA for 24 h and decalcified with 10% EDTA solution for 30 days, changing the solution every other day. The samples were then dehydrated with the different ethanol concentrations and subjected to paraffin acetone and chloroform washes, both at 60 °C for 30 min, and three 1-hour paraffin infiltrations at 60 °C. Paraffin-embedded samples were coronally sectioned (4 μm) and stained with antibodies against NLRC4 (1:100; ab99860; Abcam), IRF8 (1:100; sc-365042; Santa Cruz), p16 (1:100; sc-166760; Santa Cruz), and p21 (1:100; sc-166630; Santa Cruz). After washing with PBS three times, the sections were incubated with goat anti-mouse IgG H&L secondary antibody (1:4000; ab205719; Abcam) and goat anti-rabbit IgG H&L secondary antibody (1:4000; ab ab205718; Abcam) for 30 min at room temperature. Immunostaining was performed using a DAB kit (Solarbio) and counterstain hematoxylin. The images were acquired by Aperio Digital Pathology Slide Scanners (Leica). The percentage of positive cells was calculated by ImageJ.
Immunofluorescence staining
Mouse maxillary sections were deparaffinized for 2 h at 65 °C, incubated in xylene, and hydrated through a graded series of alcohols. Heat-mediated antigen retrieval was performed using citrate buffer (pH 6.0). After washing three times for 5 min with PBS, the samples were incubated for 15 min with PBS containing 0.3% Triton and 2% goat serum, washed again three times with PBS, and incubated with PBS containing 10% goat serum for 30 min. The sections were incubated overnight at 4 °C with antibodies against F4/80 (1:200; sc-377009; Santa Cruz) and p16 (1:100; sc-166760; Santa Cruz). After washing three times for 20 min, the sections were incubated with a goat anti-rabbit Alexa Fluor 488 (1:300; A-27034; Life Technologies) targeting F4/80 antibody, together with a goat anti-mouse Alexa Fluor 568 (1:300; A-21134; Life Technologies) targeting p16 antibody. After 1 h of incubation, the sections were washed and incubated with DAPI. The images were obtained by the Pannoramic MIDI (3D HISTECH).
Statistical analysis
All tests were conducted in triplicate. The data were analyzed as the means ± S.E. Differences between the data sets were assessed by Dunnett's t test or by the Student's t test. A value of p < 0.05 was considered significant.
Author contributions
P. Zhang and Qi W. conceptualization; P. Zhang data curation; P. Zhang, Qian W., L.N., X.Z., and P. Zhao software; P. Zhang and L.N. formal analysis; P. Zhang, Qian W., L. N., R. Z., X. Z., P. Zhao, and N. J. methodology; P. Zhang writing-original draft; P. Zhang and R. Z. project administration; Qian W., X. L., Y. D., and Q. Y. validation; N. J., X. L., Y. D., and Qi W. supervision; X. L., Y. D., Q. Y., and Qi W. writing-review and editing; Qi W. funding acquisition.
This work was supported by National Natural Science Foundation of China Grant 81870779, International Scientific Cooperation and Exchanges Project of Sichuan Province Grant 2017HH0078, and International Cooperation Project of Chengdu Municipal Science and Technology Bureau Grant 2015-GH02–00035-HZ. The authors declare that they have no conflicts of interest with the contents of this article.
- SASP
- senescence-associated secretory phenotype
- NLR
- nucleotide-binding and oligomerization domain–like receptor
- IL
- interleukin
- STZ
- streptozotocin
- IHC
- immunohistochemical
- TNF
- tumor necrosis factor
- MMP
- matrix metalloproteinase
- AGE
- advanced glycation end product
- SA
- senescence-associated
- β-gal
- β-galactosidase
- EdU
- 5-ethynyl-2-deoxyuridine
- PFA
- paraformaldehyde
- DAPI
- 4′,6-diamidino-2-phenylindole
- O.D.
- optical density.
References
- 1. Bell G. I., and Polonsky K. S. (2001) Diabetes mellitus and genetically programmed defects in β-cell function. Nature 414, 788–791 10.1038/414788a [DOI] [PubMed] [Google Scholar]
- 2. Lalla E., and Papapanou P. N. (2011) Diabetes mellitus and periodontitis: a tale of two common interrelated diseases. Nat. Rev. Endocrinol 7, 738–748 10.1038/nrendo.2011.106 [DOI] [PubMed] [Google Scholar]
- 3. Demmer R. T., Holtfreter B., Desvarieux M., Jacobs D. R. Jr., Kerner W., Nauck M., Völzke H., and Kocher T. (2012) The influence of type 1 and type 2 diabetes on periodontal disease progression: prospective results from the Study of Health in Pomerania (SHIP). Diabetes Care 35, 2036–2042 10.2337/dc11-2453 [DOI] [PMC free article] [PubMed] [Google Scholar]
- 4. Prattichizzo F., De Nigris V., La Sala L., Procopio A. D., Olivieri F., and Ceriello A. (2016) “Inflammaging” as a druggable target: a senescence-associated secretory phenotype-centered view of type 2 diabetes. Oxid Med. Cell Longev. 2016, 1810327 [DOI] [PMC free article] [PubMed] [Google Scholar]
- 5. Waaijer M. E., Parish W. E., Strongitharm B. H., van Heemst D., Slagboom P. E., de Craen A. J., Sedivy J. M., Westendorp R. G., Gunn D. A., and Maier A. B. (2012) The number of p16INK4a positive cells in human skin reflects biological age. Aging Cell 11, 722–725 10.1111/j.1474-9726.2012.00837.x [DOI] [PMC free article] [PubMed] [Google Scholar]
- 6. Sone H., and Kagawa Y. (2005) Pancreatic β cell senescence contributes to the pathogenesis of type 2 diabetes in high-fat diet-induced diabetic mice. Diabetologia 48, 58–67 10.1007/s00125-004-1605-2 [DOI] [PubMed] [Google Scholar]
- 7. Verzola D., Gandolfo M. T., Gaetani G., Ferraris A., Mangerini R., Ferrario F., Villaggio B., Gianiorio F., Tosetti F., Weiss U., Traverso P., Mji M., Deferrari G., and Garibotto G. (2008) Accelerated senescence in the kidneys of patients with type 2 diabetic nephropathy. Am. J. Physiol. Renal. Physiol. 295, F1563–F1573 10.1152/ajprenal.90302.2008 [DOI] [PubMed] [Google Scholar]
- 8. Kirkland J. L., and Tchkonia T. (2015) Clinical strategies and animal models for developing senolytic agents. Exp. Gerontol. 68, 19–25 10.1016/j.exger.2014.10.012 [DOI] [PMC free article] [PubMed] [Google Scholar]
- 9. Muñoz-Espín D., and Serrano M. (2014) Cellular senescence: from physiology to pathology. Nat. Rev. Mol. Cell Biol. 15, 482–496 10.1038/nrm3823 [DOI] [PubMed] [Google Scholar]
- 10. Franceschi C., and Campisi J. (2014) Chronic inflammation (inflammaging) and its potential contribution to age-associated diseases. J. Gerontol A. Biol. Sci. Med. Sci. 69, S4–S9 10.1093/gerona/glu057 [DOI] [PubMed] [Google Scholar]
- 11. Tchkonia T., Zhu Y., van Deursen J., Campisi J., and Kirkland J. L. (2013) Cellular senescence and the senescent secretory phenotype: therapeutic opportunities. J. Clin. Invest. 123, 966–972 10.1172/JCI64098 [DOI] [PMC free article] [PubMed] [Google Scholar]
- 12. Childs B. G., Durik M., Baker D. J., and van Deursen J. M. (2015) Cellular senescence in aging and age-related disease: from mechanisms to therapy. Nat. Med. 21, 1424–1435 10.1038/nm.4000 [DOI] [PMC free article] [PubMed] [Google Scholar]
- 13. Prattichizzo F., De Nigris V., Mancuso E., Spiga R., Giuliani A., Matacchione G., Lazzarini R., Marcheselli F., Recchioni R., Testa R., La Sala L., Rippo M. R., Procopio A. D., Olivieri F., and Ceriello A. (2018) Short-term sustained hyperglycaemia fosters an archetypal senescence-associated secretory phenotype in endothelial cells and macrophages. Redox Biol. 15, 170–181 10.1016/j.redox.2017.12.001 [DOI] [PMC free article] [PubMed] [Google Scholar]
- 14. Fujita T., Yoshimoto T., Kajiya M., Ouhara K., Matsuda S., Takemura T., Akutagawa K., Takeda K., Mizuno N., and Kurihara H. (2018) Regulation of defensive function on gingival epithelial cells can prevent periodontal disease. Jpn. Dent. Sci. Rev. 54, 66–75 10.1016/j.jdsr.2017.11.003 [DOI] [PMC free article] [PubMed] [Google Scholar]
- 15. Hall B. M., Balan V., Gleiberman A. S., Strom E., Krasnov P., Virtuoso L. P., Rydkina E., Vujcic S., Balan K., Gitlin I., Leonova K., Polinsky A., Chernova O. B., and Gudkov A. V. (2016) Aging of mice is associated with p16(Ink4a)- and β-galactosidase–positive macrophage accumulation that can be induced in young mice by senescent cells. Aging (Albany NY) 8, 1294–1315 10.18632/aging.100991 [DOI] [PMC free article] [PubMed] [Google Scholar]
- 16. Zhang Q. Z., Nguyen A. L., Yu W. H., and Le A. D. (2012) Human oral mucosa and gingiva: a unique reservoir for mesenchymal stem cells. J. Dent Res. 91, 1011–1018 10.1177/0022034512461016 [DOI] [PMC free article] [PubMed] [Google Scholar]
- 17. Youm Y. H., Grant R. W., McCabe L. R., Albarado D. C., Nguyen K. Y., Ravussin A., Pistell P., Newman S., Carter R., Laque A., Münzberg H., Rosen C. J., Ingram D. K., Salbaum J. M., and Dixit V. D. (2013) Canonical Nlrp3 inflammasome links systemic low-grade inflammation to functional decline in aging. Cell Metab 18, 519–532 10.1016/j.cmet.2013.09.010 [DOI] [PMC free article] [PubMed] [Google Scholar]
- 18. Ebersole J. L., Kirakodu S., Novak M. J., Exposto C. R., Stromberg A. J., Shen S., Orraca L., Gonzalez-Martinez J., and Gonzalez O. A. (2016) Effects of aging in the expression of NOD-like receptors and inflammasome-related genes in oral mucosa. Mol. Oral Microbiol. 31, 18–32 10.1111/omi.12121 [DOI] [PMC free article] [PubMed] [Google Scholar]
- 19. Song F., Ma Y., Bai X. Y., and Chen X. (2016) The expression changes of inflammasomes in the aging rat kidneys. J. Gerontol. A Biol. Sci. Med. Sci. 71, 747–756 10.1093/gerona/glv078 [DOI] [PMC free article] [PubMed] [Google Scholar]
- 20. Guo H., Callaway J. B., and Ting J. P. (2015) Inflammasomes: mechanism of action, role in disease, and therapeutics. Nat. Med. 21, 677–687 10.1038/nm.3893 [DOI] [PMC free article] [PubMed] [Google Scholar]
- 21. Man S. M., and Kanneganti T. D. (2015) Regulation of inflammasome activation. Immunol. Rev. 265, 6–21 10.1111/imr.12296 [DOI] [PMC free article] [PubMed] [Google Scholar]
- 22. Furman D., Chang J., Lartigue L., Bolen C. R., Haddad F., Gaudilliere B., Ganio E. A., Fragiadakis G. K., Spitzer M. H., Douchet I., Daburon S., Moreau J. F., Nolan G. P., Blanco P., Déchanet-Merville J., et al. (2017) Expression of specific inflammasome gene modules stratifies older individuals into two extreme clinical and immunological states. Nat. Med. 23, 174–184 10.1038/nm.4267 [DOI] [PMC free article] [PubMed] [Google Scholar]
- 23. Yuan F., Kolb R., Pandey G., Li W., Sun L., Liu F., Sutterwala F. S., Liu Y., and Zhang W. (2016) Involvement of the NLRC4-inflammasome in diabetic nephropathy. PLoS One 11, e0164135 10.1371/journal.pone.0164135 [DOI] [PMC free article] [PubMed] [Google Scholar]
- 24. Mejias N. H., Martinez C. C., Stephens M. E., and de Rivero Vaccari J. P. (2018) Contribution of the inflammasome to inflammaging. J. Inflamm. (Lond.) 15, 23 10.1186/s12950-018-0198-3 [DOI] [PMC free article] [PubMed] [Google Scholar]
- 25. López-Otín C., Blasco M. A., Partridge L., Serrano M., and Kroemer G. (2013) The hallmarks of aging. Cell 153, 1194–1217 10.1016/j.cell.2013.05.039 [DOI] [PMC free article] [PubMed] [Google Scholar]
- 26. Karki R., Lee E., Place D., Samir P., Mavuluri J., Sharma B. R., Balakrishnan A., Malireddi R. K. S., Geiger R., Zhu Q., Neale G., and Kanneganti T. D. (2018) IRF8 regulates transcription of Naips for NLRC4 inflammasome activation. Cell 173, 920–933.e13 10.1016/j.cell.2018.02.055 [DOI] [PMC free article] [PubMed] [Google Scholar]
- 27. Qu Y., Misaghi S., Izrael-Tomasevic A., Newton K., Gilmour L. L., Lamkanfi M., Louie S., Kayagaki N., Liu J., Kömüves L., Cupp J. E., Arnott D., Monack D., and Dixit V. M. (2012) Phosphorylation of NLRC4 is critical for inflammasome activation. Nature 490, 539–542 10.1038/nature11429 [DOI] [PubMed] [Google Scholar]
- 28. Matusiak M., Van Opdenbosch N., Vande Walle L., Sirard J. C., Kanneganti T. D., and Lamkanfi M. (2015) Flagellin-induced NLRC4 phosphorylation primes the inflammasome for activation by NAIP5. Proc. Natl. Acad. Sci. U.S.A. 112, 1541–1546 10.1073/pnas.1417945112 [DOI] [PMC free article] [PubMed] [Google Scholar]
- 29. Salminen A., Kauppinen A., and Kaarniranta K. (2012) Emerging role of NF-κB signaling in the induction of senescence-associated secretory phenotype (SASP). Cell Signal. 24, 835–845 10.1016/j.cellsig.2011.12.006 [DOI] [PubMed] [Google Scholar]
- 30. Chien Y., Scuoppo C., Wang X., Fang X., Balgley B., Bolden J. E., Premsrirut P., Luo W., Chicas A., Lee C. S., Kogan S. C., and Lowe S. W. (2011) Control of the senescence-associated secretory phenotype by NF-κB promotes senescence and enhances chemosensitivity. Genes Dev. 25, 2125–2136 10.1101/gad.17276711 [DOI] [PMC free article] [PubMed] [Google Scholar]
- 31. Xia S., Zhang X., Zheng S., Khanabdali R., Kalionis B., Wu J., Wan W., and Tai X. (2016) An update on inflamm-aging: mechanisms, prevention, and treatment. J. Immunol. Res. 2016, 8426874 [DOI] [PMC free article] [PubMed] [Google Scholar]
- 32. Choi Y. H., McKeown R. E., Mayer-Davis E. J., Liese A. D., Song K. B., and Merchant A. T. (2011) Association between periodontitis and impaired fasting glucose and diabetes. Diabetes Care 34, 381–386 10.2337/dc10-1354 [DOI] [PMC free article] [PubMed] [Google Scholar]
- 33. Palmer A. K., Tchkonia T., LeBrasseur N. K., Chini E. N., Xu M., and Kirkland J. L. (2015) Cellular senescence in type 2 diabetes: a therapeutic opportunity. Diabetes 64, 2289–2298 10.2337/db14-1820 [DOI] [PMC free article] [PubMed] [Google Scholar]
- 34. Qadri M., Jay G. D., Zhang L. X., Wong W., Reginato A. M., Sun C., Schmidt T. A., and Elsaid K. A. (2018) Recombinant human proteoglycan-4 reduces phagocytosis of urate crystals and downstream nuclear factor κB and inflammasome activation and production of cytokines and chemokines in human and murine macrophages. Arthritis Res. Ther. 20, 192 10.1186/s13075-018-1693-x [DOI] [PMC free article] [PubMed] [Google Scholar]
- 35. Franceschi C., Bonafè M., Valensin S., Olivieri F., De Luca M., Ottaviani E., and De Benedictis G. (2000) Inflamm-aging: an evolutionary perspective on immunosenescence. Ann. N.Y. Acad. Sci. 908, 244–254 [DOI] [PubMed] [Google Scholar]
- 36. Fulop T., Larbi A., Dupuis G., Le Page A., Frost E. H., Cohen A. A., Witkowski J. M., and Franceschi C. (2017) Immunosenescence and inflamm-Aging as two sides of the same coin: friends or foes? Front. Immunol. 8, 1960 [DOI] [PMC free article] [PubMed] [Google Scholar]
- 37. Parisi L., Gini E., Baci D., Tremolati M., Fanuli M., Bassani B., Farronato G., Bruno A., and Mortara L. (2018) Macrophage polarization in chronic inflammatory diseases: killers or builders? J. Immunol. Res. 2018, 8917804 [DOI] [PMC free article] [PubMed] [Google Scholar]
- 38. Acosta J. C., Banito A., Wuestefeld T., Georgilis A., Janich P., Morton J. P., Athineos D., Kang T. W., Lasitschka F., Andrulis M., Pascual G., Morris K. J., Khan S., Jin H., Dharmalingam G., et al. (2013) A complex secretory program orchestrated by the inflammasome controls paracrine senescence. Nat. Cell Biol. 15, 978–990 10.1038/ncb2784 [DOI] [PMC free article] [PubMed] [Google Scholar]
- 39. Kuilman T., and Peeper D. S. (2009) Senescence-messaging secretome: SMS-ing cellular stress. Nat. Rev. Cancer 9, 81–94 10.1038/nrc2560 [DOI] [PubMed] [Google Scholar]
- 40. Longo P. L., Artese H. P., Rabelo M. S., Kawamoto D., Foz A. M., Romito G. A., Dib S. A., and Mayer M. P. (2014) Serum levels of inflammatory markers in type 2 diabetes patients with chronic periodontitis. J. Appl. Oral Sci. 22, 103–108 10.1590/1678-775720130540 [DOI] [PMC free article] [PubMed] [Google Scholar]
- 41. Wu Y. Y., Xiao E., and Graves D. T. (2015) Diabetes mellitus related bone metabolism and periodontal disease. Int. J. Oral Sci. 7, 63–72 10.1038/ijos.2015.2 [DOI] [PMC free article] [PubMed] [Google Scholar]
- 42. Sima C., and Van Dyke T. E. (2016) Therapeutic targets for management of periodontitis and diabetes. Curr. Pharm. Des. 22, 2216–2237 10.2174/1381612822666160216150338 [DOI] [PMC free article] [PubMed] [Google Scholar]
- 43. Acharya A. B., Thakur S., and Muddapur M. V. (2015) Evaluation of serum interleukin-10 levels as a predictor of glycemic alteration in chronic periodontitis and type 2 diabetes mellitus. J. Indian Soc. Periodontol. 19, 388–392 10.4103/0972-124X.150876 [DOI] [PMC free article] [PubMed] [Google Scholar]
- 44. Zhu J., Guo B., Gan X., Zhang L., He Y., Liu B., Chen X., Zhang S., and Yu H. (2017) Association of circulating leptin and adiponectin with periodontitis: a systematic review and meta-analysis. BMC Oral Health 17, 104 10.1186/s12903-017-0395-0 [DOI] [PMC free article] [PubMed] [Google Scholar]
- 45. Subbarao K. C., Nattuthurai G. S., Sundararajan S. K., Sujith I., Joseph J., and Syedshah Y. P. (2019) Gingival crevicular fluid: an overview. J. Pharm. Bioallied Sci. 11, S135–S139 [DOI] [PMC free article] [PubMed] [Google Scholar]
- 46. Duarte P. M., de Lorenzo Abreu L., Vilela A., Feres M., Giro G., and Miranda T. S. (2019) Protein and mRNA detection of classic cytokines in corresponding samples of serum, gingival tissue and gingival crevicular fluid from subjects with periodontitis. J. Periodontal Res. 54, 174–179 10.1111/jre.12617 [DOI] [PubMed] [Google Scholar]
- 47. Kolb R., Phan L., Borcherding N., Liu Y., Yuan F., Janowski A. M., Xie Q., Markan K. R., Li W., Potthoff M. J., Fuentes-Mattei E., Ellies L. G., Knudson C. M., Lee M. H., Yeung S. J., et al. (2016) Obesity-associated NLRC4 inflammasome activation drives breast cancer progression. Nat. Commun. 7, 13007 10.1038/ncomms13007 [DOI] [PMC free article] [PubMed] [Google Scholar]
- 48. Salminen A., Huuskonen J., Ojala J., Kauppinen A., Kaarniranta K., and Suuronen T. (2008) Activation of innate immunity system during aging: NF-kB signaling is the molecular culprit of inflamm-aging. Ageing Res. Rev. 7, 83–105 10.1016/j.arr.2007.09.002 [DOI] [PubMed] [Google Scholar]
- 49. Chen Y., Sun T., Wu J., Kalionis B., Zhang C., Yuan D., Huang J., Cai W., Fang H., and Xia S. (2015) Icariin intervenes in cardiac inflammaging through upregulation of SIRT6 enzyme activity and inhibition of the NF-κB pathway. Biomed. Res. Int. 2015, 895976 [DOI] [PMC free article] [PubMed] [Google Scholar]
- 50. Mao C. Y., Wang Y. G., Zhang X., Zheng X. Y., Tang T. T., and Lu E. Y. (2016) Double-edged-sword effect of IL-1β on the osteogenesis of periodontal ligament stem cells via crosstalk between the NF-κB, MAPK and BMP/Smad signaling pathways. Cell Death Dis. 7, e2296 10.1038/cddis.2016.204 [DOI] [PMC free article] [PubMed] [Google Scholar]
- 51. Kawai T., and Akira S. (2009) The roles of TLRs, RLRs and NLRs in pathogen recognition. Int. Immunol. 21, 317–337 10.1093/intimm/dxp017 [DOI] [PMC free article] [PubMed] [Google Scholar]
- 52. Martin-Montalvo A., Mercken E. M., Mitchell S. J., Palacios H. H., Mote P. L., Scheibye-Knudsen M., Gomes A. P., Ward T. M., Minor R. K., Blouin M. J., Schwab M., Pollak M., Zhang Y., Yu Y., Becker K. G., et al. (2013) Metformin improves healthspan and lifespan in mice. Nat. Commun. 4, 2192 10.1038/ncomms3192 [DOI] [PMC free article] [PubMed] [Google Scholar]
- 53. Saisho Y. (2015) Metformin and inflammation: its potential beyond glucose-lowering effect. Endocr. Metab. Immune Disord. Drug Targets 15, 196–205 10.2174/1871530315666150316124019 [DOI] [PubMed] [Google Scholar]
- 54. Louro T. M., Matafome P. N., Nunes E. C., da Cunha F. X., and Seiça R. M. (2011) Insulin and metformin may prevent renal injury in young type 2 diabetic Goto-Kakizaki rats. Eur. J. Pharmacol. 653, 89–94 10.1016/j.ejphar.2010.11.029 [DOI] [PubMed] [Google Scholar]
- 55. Hall S. S. (2015) A trial for the ages. Science 349, 1274–1278 10.1126/science.349.6254.1274 [DOI] [PubMed] [Google Scholar]
- 56. Moiseeva O., Deschênes-Simard X., St-Germain E., Igelmann S., Huot G., Cadar A. E., Bourdeau V., Pollak M. N., and Ferbeyre G. (2013) Metformin inhibits the senescence-associated secretory phenotype by interfering with IKK/NF-κB activation. Aging Cell 12, 489–498 10.1111/acel.12075 [DOI] [PubMed] [Google Scholar]