Abstract
The ocean’s chemistry is changing due to the uptake of anthropogenic carbon dioxide (CO2). This phenomenon, commonly referred to as “Ocean Acidification”, is endangering coral reefs and the broader marine ecosystems. In this study, we combine a recent observational seawater CO2 data product, i.e., the 6th version of the Surface Ocean CO2 Atlas (1991–2018, ~23 million observations), with temporal trends at individual locations of the global ocean from a robust Earth System Model to provide a high-resolution regionally varying view of global surface ocean pH and the Revelle Factor. The climatology extends from the pre-Industrial era (1750 C.E.) to the end of this century under historical atmospheric CO2 concentrations (pre-2005) and the Representative Concentrations Pathways (post-2005) of the Intergovernmental Panel on Climate Change (IPCC)’s 5th Assessment Report. By linking the modeled pH trends to the observed modern pH distribution, the climatology benefits from recent improvements in both model design and observational data coverage, and is likely to provide improved regional OA trajectories than the model output could alone, therefore, will help guide the regional OA adaptation strategies. We show that air-sea CO2 disequilibrium is the dominant mode of spatial variability for surface pH, and discuss why pH and calcium carbonate mineral saturation states, two important metrics for OA, show contrasting spatial variability.
Subject terms: Carbon cycle, Marine chemistry
Introduction
Ocean pH, carbonate ion concentrations ([CO32−]), and calcium carbonate mineral saturation states (Ω) have been declining as a result of the uptake of approximately 30% of the anthropogenic carbon dioxide (CO2) emissions over the past 270 years1–6. This process is commonly referred to as “ocean acidification (OA)”1,2,7,8. As the “other CO2 problem”, OA is making it harder for marine calcifiers to build a shell and/or skeletal structure, endangering coral reefs and the broader marine ecosystems1,2,9–11.
Seawater pH measurements date back to the beginning of the 20th century12, yet very few historical pH data are adequate for studying the global pH distribution. Prior to 1989, seawater pH was typically measured using glass electrodes with uncertainties as much as 0.1 units. Moreover, the earlier marine pH records are often unclear about the pH scale, measurement temperature, and whether the reported pH has been adjusted from measurement to in-situ conditions13. Only since the late 1980s when spectrophotometric pH measurement methods were refined, has it become possible for labs using dye solutions to discern small pH changes such as those expected from OA14–16. Additionally, the accepted spectrophotometric seawater pH measurement practices have been recently updated to allow for corrections for the influences of dye impurities17,18, challenging the comparability of pH measurements made between decades.
In lieu of measured pH, global studies of seawater pH have been relying on values calculated from other seawater CO2 chemistry variables. The modern day surface ocean pH distribution was recently described by Takahashi et al.19 who calculated pH (adjusted to 2005) using a gridded partial pressure of carbon dioxide (pCO2) data product from the Lamont Doherty Earth Observatory (utilizing ~6 million observations), and total alkalinity (TA) estimated from gridded sea surface salinity and nitrate. The historical and future pH distributions can be directly extracted from Earth System Models20,21, but the surface ocean pH distributions in models are controlled by the modeled processes and do not always closely reflect the true ocean state21. Furthermore, the model initial conditions are usually based on the first version of the Global Ocean Data Analysis Project (GLODAP) data product (1972–1999, ~6000 observations) with limited spatial coverage22.
Following the approach of Orr et al.2, we combine a recent rich observational CO2 data product, i.e., the 6th version of the Surface Ocean CO2 Atlas (SOCATv6, 1991–2018, ~23 million observations)23, with an updated TA estimation routine (locally interpolated alkalinity regression, or LIARv2)24, and temporal trends at individual locations of the global ocean from a robust Earth System Model (ESM2M)20 to provide a high-resolution regionally varying view of global surface ocean pH and Revelle Factor25 from the pre-Industrial era (1750 C.E.) to the end of the century.
Revelle Factor is a measure of the ocean’s buffer capacity for the carbonate system in seawater or freshwater. It is defined as the ratio between the fractional change in pCO2 to the fractional change in dissolved inorganic carbon (DIC) (Eq. 1) at constant temperature, salinity and TA25.
| 1 |
The higher the Revelle factor, the lower the ocean’s buffer capacity, and the faster the change of pCO2 in the ocean at a given DIC change. The Revelle Factor also serves as a good indicator of the ocean’s buffer capacity in terms of pH changes. A similar quantity defined as the ratio between the fractional change in pH to the fractional change in DIC using our data shows a strong correlation with the Revelle Factor (R2 > 0.999), so we discuss variability in these two related factors as though they are interchangeable. In this study, we report on the spatial and temporal variations of surface pH and Revelle Factor, their seasonal variability, and long-term changes from 1770 to 2100.
Surface pH distribution
The pH results of this study calculated using the SOCATv6 data product are statistically indistinguishable (mean ± root-mean-squared difference: 0.005 ± 0.014) from those calculated from the 2nd version of Global Ocean Data Analysis Project data product (GLODAPv2)26 (Fig. 1 and Supplementary Fig. S1). However, due to the much better spatial coverage (23 million vs. 15,115 observations) and consummately lower gridding uncertainty, and to a lesser extent the smaller pH uncertainties (0.01 vs. 0.02 pH) of the SOCATv6 calculations than the GLODAPv2 calculations, we contend that the SOCATv6-based gridded values are preferable to the GLODAPv2-based gridded values at the ocean surface. Except where otherwise indicated, the results of this study are therefore based on SOCATv6.
Figure 1.
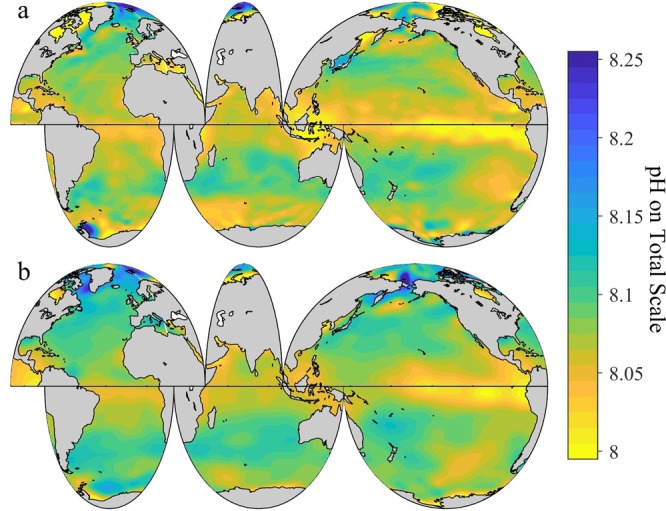
Climatological distribution of global surface ocean pH on the total hydrogen scale (pHT) at in-situ temperature. The pHT values are annually averaged and adjusted to be approximate for the year 2000. Panel a, surface pHT based on the 6th version of the Surface Ocean CO2 Atlas (SOCATv6). Panel b, surface pHT based on the 2nd version of the Global Ocean Data Analysis Project (GLODAPv2).
The pH climatology we produce shows a similar (a negligible average difference of 2.6 × 10⁻⁴ pH units) pH to that directly extracted from the Earth System Model that we use to derive temporal trends, suggesting the model captures the important processes controlling average surface ocean pH well (Supplementary Fig. S2). However, the two pH distributions show large differences regionally (a root-mean-squared difference of 0.06 pH units at the surface, equivalent to a 15% acidity difference, or ~3 decades of pH change27). The hybrid climatology we produce, which combines observation-based distribution with model-based temporal trends at individual locations of the global ocean, is likely to provide improved regional OA trajectories than the model output could alone, and thus will help guide the regional OA adaptation strategies.
The annually-averaged global surface ocean pHT2000 (adjusted for the year 2000, gridded to a global 1 × 1° grid, see methods for details) between 60°N and 60°S shows a narrow range across the global surface ocean (<0.2 units, Fig. 1a). The lowest surface ocean pHT2000 is found in the equatorial regions from 20°N to 20°S, especially in the eastern Pacific. The Arctic Ocean shows the largest spatial variability, followed by the Southern Ocean. The globally and annually-averaged surface ocean pHT2000 in the Atlantic, Pacific, and Indian Oceans (60°N to 60°S) is 8.07 ± 0.02 (1σ uncertainty on gridded values, see Methods), 8.06 ± 0.03, and 8.07 ± 0.02, respectively, with a global average of 8.07 ± 0.02 between 60°N to 60°S.
Two cancelling effects of SST on pH
pH and calcium carbonate mineral saturation states (Ω) are two important metrics for OA because they both respond sensitively to anthropogenic CO2 and are aspects of seawater chemistry that are thought to play a role in the health of some marine organisms. However, unlike surface ocean aragonite saturation state (Ωarag), which shows a large latitudinal gradient (e.g., Ωarag varies from ~3.7 at sea surface temperature, or SST, of ~25 °C in the subtropical and tropical regions to ~1.4 at SST of ~0 °C in the high latitudes) and is strongly correlated with SST (R2 = 0.94)28, surface ocean pHT2000 shows a small latitudinal gradient (in the above example, pH only varies from 8.09 to 8.11) and is weakly correlated with SST (R2 = 0.056, Supplementary Fig. S3). Understanding this difference between pH and Ω requires exploring how temperature interacts with the two properties. Temperature controls surface ocean pH and Ω primarily through two processes: directly through the temperature dependence of the seawater CO2 chemistry; and indirectly through air-sea exchange of CO2 and the subsequent changes to the DIC/TA ratio of the water.
The first process controls the chemical speciation of CO2 dissolved in seawater. A simple model (see: Methods) shows that in a closed system with constant DIC and TA, when temperature increases from 20 to 25 °C, the dissociation of bicarbonate (HCO3−) and water (H2O) are the primary processes producing hydrogen ions (H+) (1.99 and 1.55 µmolkg−1, respectively, in this particular example, see: Methods), a large portion of which (2.72 µmolkg−1) is consumed by borate (B(OH)4−), with most of the remaining produced H+ (0.82 µmolkg−1) reacting with HCO3– to form aqueous CO2 (CO2*, a combination of both dissolved CO2 and carbonic acid, or H2CO3), leaving a tiny portion of H+ (0.0015 µmolkg−1) in the seawater as H+ or H3O+, but enough to decrease pH from 8.10 to 8.02 (Supplementary Table S1). The extra CO32− from the dissociation of HCO3– (an increase of ~2 µmolkg−1, or ~1%), combined with a decrease of apparent solubility product (Ksp)with temperature (about –2% change from 20 to 25 °C)29 help enhance aragonite saturation state slightly (~3%) from 3.16 to 3.25.
The second process involves air-sea gas exchange and the associated changes in the DIC/TA ratio. When water temperature increases, the extra H+ from the dissociation of HCO3− and H2O will react with the most abundant carbonic species in the ocean, HCO3–, driving it to build up excess aqueous CO2 (CO2*). In the above example, when temperature increases from 20 to 25 °C, [CO2*] increases by 0.82 µmolkg−1, which would translate to an fCO2 increase of ~25 µatm if CO2 solubility (K0) were not to change. In reality, K0 decreases with increasing temperature30, and the change of K0 alone would cause fCO2 to increase by an additional ~53 µatm, twice as much as that from the change of [CO2*]. In summary, when temperature increases, the changes of both [CO2*] and solubility (K0) work together to create a tendency for seawater to degas CO2 to the atmosphere, lowering the DIC/TA ratio31, thus raising both pH and aragonite saturation state. Similarly, colder temperature will enable a body of water to absorb more CO2 in order to maintain equilibrium with the atmosphere, thus increasing its DIC/TA ratio, and decreasing both pH and aragonite saturation state.
In the above example, if warming/cooling only impacted the seawater CO2 chemistry through speciation changes, surface pHT would be 0.47 units higher near the poles than at the equator (Supplementary Fig. S4). In contrast, aragonite saturation state would be slightly (~15%) lower near the poles than at the equator. If the air-sea gas exchange of CO2 were the only controlling factor, pHT in the polar area would be 0.46 units lower than in the tropical area, and aragonite saturation state would be ~50% lower. These effects nearly cancel for pH, whereas they reinforce each other for aragonite saturation state (Supplementary Fig. S4), which explains why surface ocean pH does not show as strong of a latitudinal gradient as aragonite saturation state (Supplementary Fig. S3).
Role of air-sea CO2 disequilibria
Air-sea gas exchange tends to bring surface ocean pCO2 close to equilibrium with the atmosphere, but disequilibria following temperature changes or biological drawdown of DIC or remineralization events do persist in the surface ocean19. We estimate the effect of air-sea CO2 disequilibria on surface ocean pH (ΔpHT diseq) from the differences between in-situ pH and the pH if the water were to be equilibrated with the atmospheric CO2. The results show that air-sea CO2 disequilibria elevate pH in high latitude areas where CO2 is undersaturated and decrease it in the equatorial upwelling region where CO2 is supersaturated (Fig. 2a)19. Globally, the average ΔpHT diseq is 0.03 ± 0.06 (1σ). It should be noted that disequilibria are a symptom of pH variability rather than a cause, and the true explanation for any changes must require some combination of mixing, primary production, remineralization process, and heat exchange.
Figure 2.
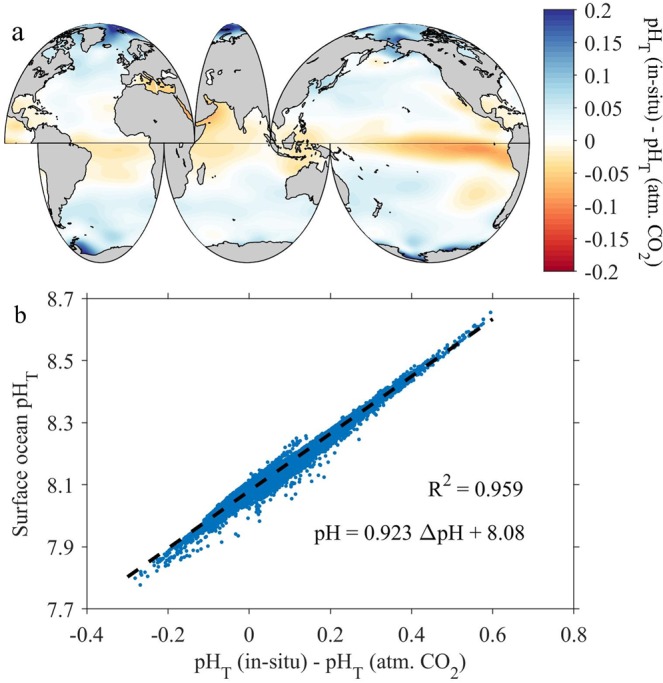
Surface ocean pHT variation caused by air-sea CO2 disequilibria. Panel a, the spatial distribution of the pH caused by air-sea disequilibria. pHT (atm. CO2) is the pH if the water were to be equilibrated with the atmospheric CO2 level in 2000. Panel b, the regression between surface pHT and the pH caused by air-sea disequilibria based on the original discrete pH data (before gridding).
As discussed previously, the result of the two SST processes is a rather homogeneous surface ocean pH distribution from the tropical to the polar areas at equilibrium. To examine how strongly ΔpHT diseq covaries with the observed surface ocean pHT distribution, pHT is plotted against ΔpHT diseq (Fig. 2b). Their regression suggests that the spatial pH variability is strongly correlated with ΔpHT diseq in the global surface ocean (R2 = 0.96, Fig. 2b). The surface air-sea disequilibria signal can be attributed to a time lag between the impacts of SST changes on seawater CO2 chemistry speciation which happen immediately, and those of the air-sea CO2 exchange which happen slowly following the temperature change.
Pre-industrial surface ocean pH
Surface ocean pHT in 1770 shows a similar spatial pattern as in 2000 (Fig. 3a), but is on average ~0.11 ± 0.03 (where the ± term reflects the root-mean-squared difference of this quantity across the global surface ocean) units higher in 1770 than in 2000 (Fig. 3b). Overall, the pHT drop from 1770 to 2000 is fastest in areas with the greatest Revelle Factor (i.e., the lowest seawater buffer capacity) (Fig. 4a). The Arctic Ocean shows the greatest pHT decrease (Fig. 3b), with an area-averaged ∆pHT change of −0.16 ± 0.04 units from 1770 to 2000. In comparison, the equatorial region between 20°S and 20°N only shows an area-averaged ∆pHT change of −0.10 ± 0.01 pH units during this period (Fig. 3b). The Southern Ocean data indicate strong area-averaged ∆pHT declines, but not as severe as the declines in the Arctic Ocean.
Figure 3.
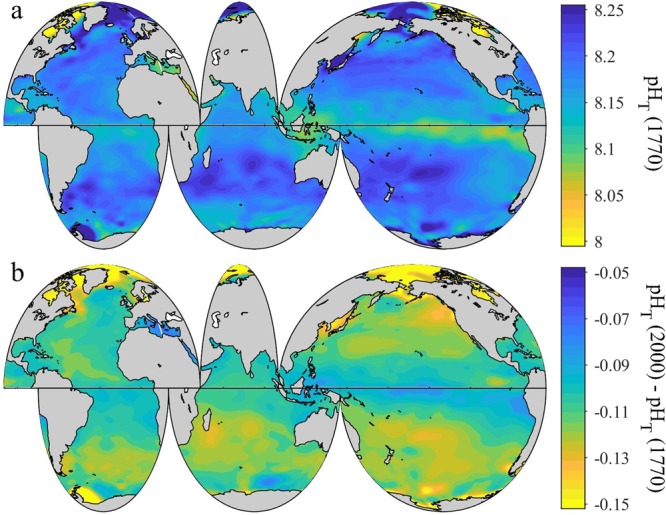
Spatial distribution of global surface ocean pHT in 1770. Panel a, the annually-averaged surface ocean pHT adjusted to be approximate for the year 1770. Panel b, the difference between pHT in 2000 and 1770 (pH2000 – pH1770) in the global surface ocean.
Figure 4.
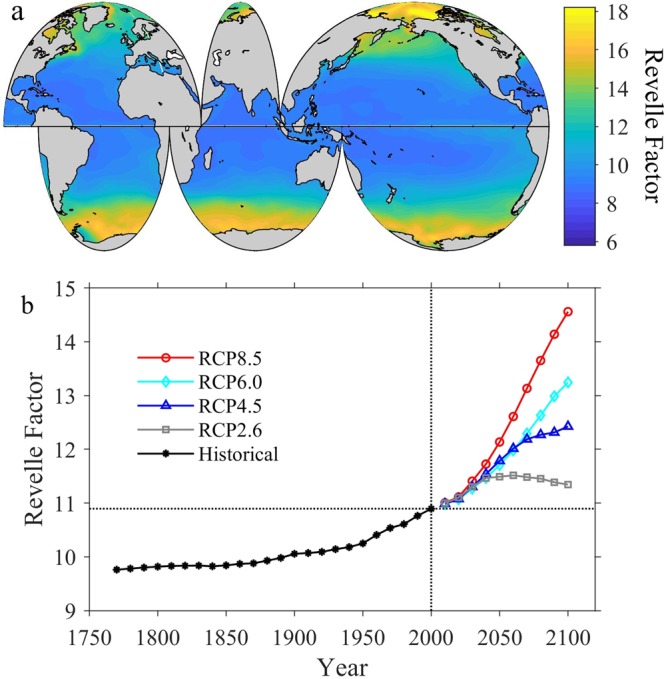
Spatial and temporal distributions of global surface ocean Revelle Factor. Panel a, the spatial distribution of annually-averaged Revelle Factor adjusted for the year 2000 in the global surface ocean. Panel b, the long-term change of the globally and annually-averaged surface Revelle Factor from 1770 to 2100 under all Representative Concentrations Pathway (RCP) scenarios.
Future surface ocean pH
Over a decade of CO2 emissions since 2005 show that the Representative Concentrations Pathway (RCP2.6) scenario is unlikely to adequately represent the future atmospheric CO2 level. Consequently, here we focus discussion instead on the RCP4.5 and RCP8.5 scenarios, as these are now the plausible low-end and high-end concentration pathways. Under the RCP 8.5 “business-as-usual” scenario, surface ocean pHT changes at about –0.02 units decade−1 (~6% [H+] decade−1) at the beginning of this century, close to what was observed by Lauvset et al.27, and gradually accelerates to an average of about −0.04 units decade−1 (~10% [H+] decade−1) towards the end of the century (Fig. 5). From 2000 to 2100, the globally and annually-averaged surface ocean pHT decreases by an average of about ~0.33 ± 0.04 (spatial variability) units (Figs. 5a, 6, and Supplementary Fig. S5), consistent with research based on ensembles of Earth System Models20,21. This is equivalent to an average hydrogen ion increase of ~114% (Figs. 5b, 7, and Supplementary Fig. S6), and slightly greater than the entire modern surface ocean pH range (Fig. 1a). The globally and annually-averaged Revelle Factor increases by 3.7 ± 0.9 (~34%) under the RCP8.5 scenario over the same period (Figs. 4b, 8, and Supplementary Fig. S7).
Figure 5.
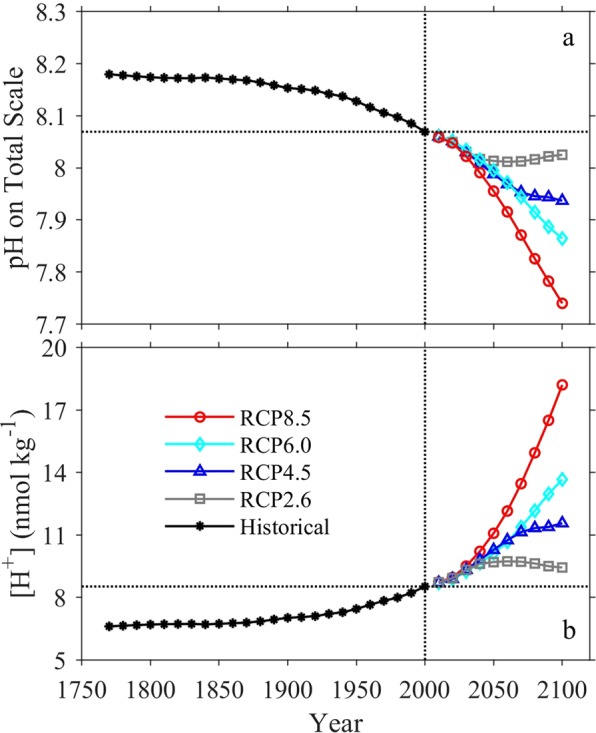
Long-term change of global surface ocean pHT and ocean acidity. Panel a, the globally and annually-averaged surface ocean pHT from 1770 to 2100. Panel b, the change of ocean acidity (hydrogen ion activity, [H+], 1 nmol kg−1 = 1×10⁻⁹ mol kg−1) over the same period.
Figure 6.
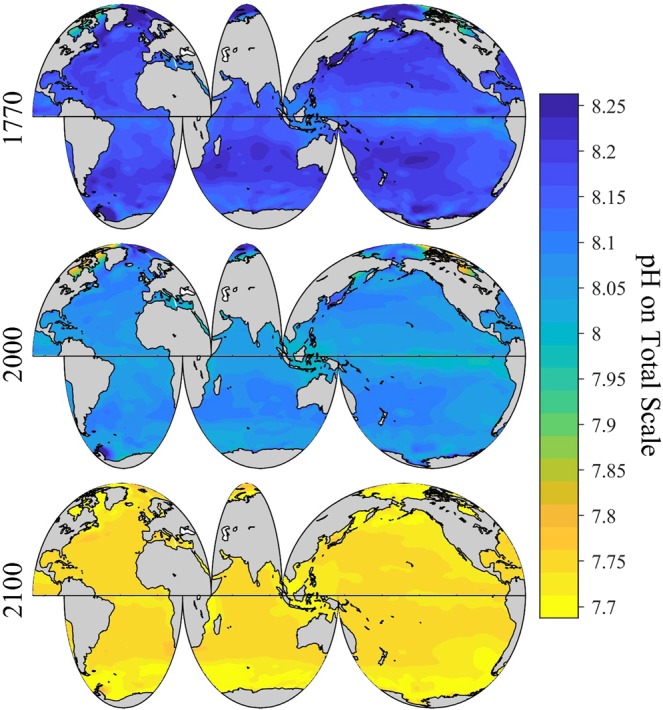
Spatial distribution of global surface ocean pHT (total hydrogen scale, annually averaged) in past (1770), present (2000) and future (2100) under the IPCC RCP8.5 scenario.
Figure 7.
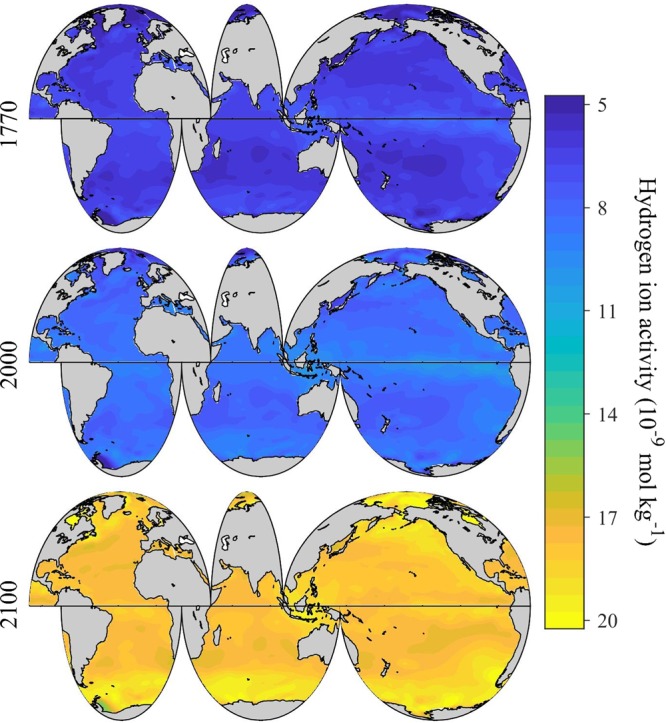
Spatial distribution of global surface ocean acidity (hydrogen ion activity, annually averaged) in past (1770), present (2000) and future (2100) under the IPCC RCP8.5 Scenario.
Figure 8.
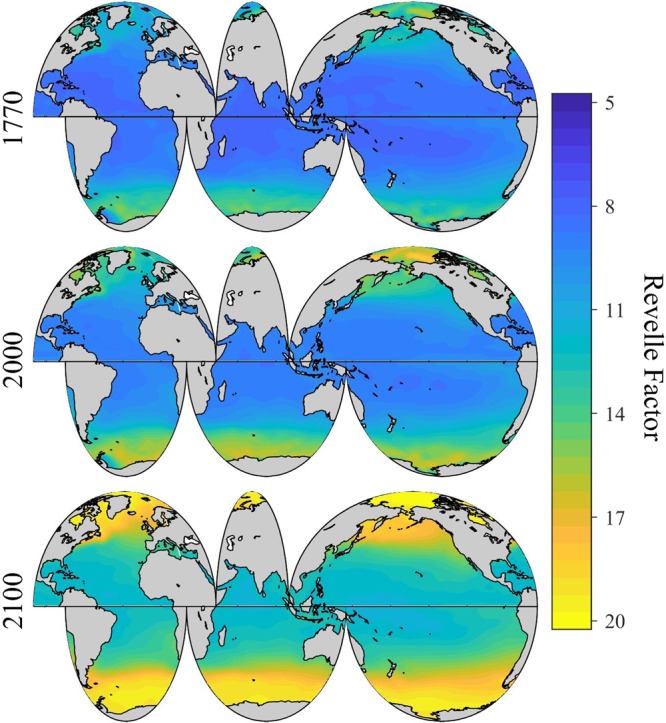
Spatial distribution of global surface ocean Revelle Factor (annually averaged) in past (1770), present (2000) and future (2100) under the IPCC RCP8.5 scenario.
The magnitude of pHT change from 2000 to 2100 (∆pHT) shows a clear latitudinal pattern with relatively small changes in the equatorial upwelling regions and larger changes in the Arctic and Southern Oceans (Supplementary Fig. S8). The latitudinal gradient in ∆pHT is mainly due to the regionally varying buffer capacity (Fig. 4a) combined with the magnitude of the projected seawater pCO2 change (Supplementary Fig. S8) from 2000 to 2100. Upwelling waters tend to have the lowest concentration of anthropogenic carbon, such that anthropogenic pH change is transiently slowed down by continuous upwelling. The overall results are that surface ocean pH decreases slower in areas with lower pH, e.g. the equatorial upwelling regions. Therefore, global surface ocean pHT is becoming increasingly more homogeneous with time (Fig. 6 and Supplementary Fig. S5).
Under the RCP4.5 scenario, surface ocean pHT decreases at a much slower rate (Fig. 5a and Supplementary Fig. S9). In 2100, pHT is ~0.13 ± 0.01 (spatial variability) units lower than in 2000, equivalent to a hydrogen ion increase of ~36% (Fig. 5b and Supplementary Fig. S10), comparable to the change from pre-industrial times until today. The globally and annually-averaged Revelle Factor would increase by 1.5 ± 0.7 (~14%) under the RCP4.5 scenario (Fig. 4b and Supplementary Fig. S11).
Summary and conclusions
This study combines observation-based pH distribution (~23 million observations from SOCATv6) with temporal trends at individual locations of the global ocean from a robust Earth System Model to provide a high-resolution regionally varying view of global surface ocean pH and Revelle Factor in all 12 months of the year from 1770 to 2100. As a result of the tremendously enhanced observational data coverage from the SOCATv6, the climatology of this study is likely to provide improved regional OA trajectories than the model output could alone, and therefore, will help guide the regional OA adaptation strategies.
We find that SST imposes two large but cancelling effects on surface ocean pH: (a) the effects of SST on chemical speciation of the carbonate system; and (b) the air-sea exchange of CO2 and the subsequent DIC/TA ratio of the water. These two processes act in concert for aragonite saturation state but oppose each other for pH. As a result, surface ocean pH shows little latitudinal variation, while aragonite saturation state is markedly lower in the colder polar regions than in the warmer subtropical and tropical regions. The spatial variation of surface ocean pH is instead mainly attributable to air-sea CO2 disequilibria driven by temperature changes and upwelling on regional scales.
From 1770 to 2000, the global average surface ocean pHT decreased by ~0.11 ± 0.03 (spatial variability) units. Under the IPCC RCP8.5 “business-as-usual” scenario, the globally and annually-averaged surface ocean pHT would decrease by an additional ~0.33 ± 0.04 units (~114% increase in hydrogen ion) and the ocean’s buffer capacity would decrease by an average ~34% from 2000 to 2100. The rapid decrease in buffer capacity suggests that while the ocean will likely to continue to take up more CO2 in the future due to the ever increasing atmospheric CO2 concentration, the ocean’s role in absorbing anthropogenic CO2 will gradually diminish into the future, and the subsequent chemistry change in the ocean will accelerate.
Methods
Seawater CO2 chemistry data needed for the pH and Revelle Factor calculations were extracted from the 6th version of the Surface Ocean CO2 Atlas (SOCATv6, 1991–2018, ~23 million observations)23. Data without quality control flags of A or B (uncertainty of fugacity of carbon dioxide, fCO2 < 2 µatm) were omitted. The fugacity of carbon dioxide is an effective partial pressure of carbon dioxide with its non-ideality corrected. The difference between pCO2 and fCO2 is usually <0.5%. Silicate and phosphate values for all SOCATv6 stations were extracted from the gridded Global Ocean Data Analysis Project version 2 (GLODAPv2) climatologies32. Total alkalinity (TA) was then estimated based on salinity, sea surface temperature (SST), and silicate using the updated locally interpolated alkalinity regression (LIARv2) method24.
pH on the total hydrogen scale (pHT) and Revelle Factor were calculated from in-situ temperature, salinity, fCO2, total alkalinity (TA), silicate and phosphate using the dissociation constants for carbonic acid of Lueker et al.33, potassium bisulfate (KHSO4–) of Dickson34, boric acid of Dickson35, and with the total borate concentration equations of Uppstrom36 as recommended by Orr et al.37 using the MATLAB version38 of the CO2SYS program39. Uncertainties of this approach were estimated using the CO2SYS errors program37 to be around 0.01 pH units, with default errors for carbonate and borate system constants, and assuming uncertainties for SST, salinity, TA, and fCO2 are 0.01, 0.1, 18 µmol kg−1 (i.e., twice LIARv2 uncertainty estimates for these surface data24), and 2 µatm, respectively.
For comparison purposes, global surface ocean pHT was also calculated from GLODAPv2 (1972–2012, ~13,000 observations)26. The GLODAPv2 data were extracted if they met these three criteria: (a) containing both dissolved inorganic carbon (DIC) and TA, (b) the World Ocean Circulation Experiment (WOCE) quality control flags for temperature, salinity, DIC, and TA = 2 (2 - good), (c) sampling depth <=20 meters. In the end, a total of 12,812 stations were used for this analysis. Global surface ocean pHT was calculated using the CO2SYS program as before except that DIC is used in place of fCO2. Uncertainties of the GLODAPv2 approach were estimated to be around 0.02 pH units, assuming uncertainties for temperature, salinity, TA, and DIC are 0.01, 0.02, 6 µmol kg−1 and 4 µmol kg−1, respectively. For both calculations of pH, there are substantial uncertainties (0.01–0.02) owing to carbonate system intercomparability, in that different values of pH can be obtained using different carbonate constant sets. Therefore, neither calculation of pH should be considered more accurate than 0.01 to 0.02.
The calculated pHT and Revelle Factor were adjusted from their sampling year to 2000 by assuming: (a) sea surface pCO2 increases at the same rate as atmospheric mole fraction of carbon dioxide (xCO2) as documented by the Intergovernmental Panel on Climate Change (IPCC) Fifth Assessment Report 5 (AR5)40, (b) SST increases at the rate described by 5th version of NOAA’s Extended Reconstructed Sea Surface Temperature (ERSSTv5)41, and (c) salinity and TA remain constant.
Surface ocean pHT and Revelle Factor were further adjusted from their sampling month to all 12 months of 2000 by assuming: (a) sea surface pCO2 follows the same annual cycle as documented by the Lamont-Doherty Earth Observatory (LDEO) climatology19, (b) sea surface temperature (SST) in all months of 2000 can be approximated by the 1995–2004 average monthly SST climatology from the World Ocean Atlas (WOA)13, and (c) salinity and TA remain constant.
Spatial mapping was conducted using a MATLAB version (Divand Software) of the Data-Interpolating Variational Analysis (DIVA)42. Correlation lengths of 42° Longitude × 21° Latitude and a Signal to Noise ratio (SN) of 3.0 were chosen to minimize disagreements between pH gridded based on SOCATv6 calculations and that based on GLODAPv2 calculations. The average uncertainty from the DIVA gridding in the Atlantic, the Pacific, and the Indian Ocean (between 60°S and 60°N) is 0.01 ± 0.01, (spatial variability), 0.01 ± 0.02 and 0.02 ± 0.03 pH units, respectively (Supplementary Fig. S12). The value in the Southern Ocean (south of 60°S) is 0.02 ± 0.04, and it is largest in the Arctic (north of 70°N) at 0.06 ± 0.17. Overall, the uncertainty is much larger in the southern hemisphere than in the northern hemisphere due to observation sparsity (Supplementary Fig. S12). For example, the mean uncertainty from 20°S to 60°S in the South Pacific is 0.02 ± 0.02 (spatial variability), about 7-fold greater than the average uncertainty from 20°N to 60°N in the North Pacific, or 0.003 ± 0.002 (Supplementary Fig. S12). Also, note that the uncertainty from the DIVA gridding is dependent on the choice of correlation lengths and SN so that different choices from those used here will yield different uncertainties.
Surface ocean pHT and Revelle Factor in all 12 months for all decades from 2010 to 2100 under the four IPCC RCP scenarios (RCP2.6, RCP4.5, RCP6.0, and RCP8.5) were simulated by assuming sea surface pCO2 and SST increase at the rate simulated by the Geophysical Fluid Dynamics Laboratory (GFDL) ESM2M model run20. This approach replaces the traditional assumption that surface pCO2 will track atmospheric xCO2 everywhere in the global ocean, and allows for the possibility that parts of the surface ocean will lag behind or exceed atmospheric xCO2 changes due to (for example) circulation changes or incomplete air-sea equilibration.
Because sea surface pCO2 was not available as one of the GFDL-ESM2M outputs, the temporal change of pCO2 was derived based on the changes of atmospheric xCO2 and delta air-sea pCO2 (Eq. 2):
| 2 |
where pCO2 is the partial pressure of carbon dioxide in the ocean, atm xCO2 is the mole fraction of carbon dioxide in the atmosphere, and ∆pCO2 is the difference between atmospheric and oceanic partial pressure of CO2 (positive meaning ocean >atmosphere). Year inside the parenthesis can be 2010, 2020, … 2100. Atmospheric xCO2 and pCO2 are two different concepts and they vary in value, but their respective temporal changes in the surface ocean can be assumed to be reasonably close to each other.
Specifically, data for atmospheric xCO2 (“CO2”) and delta air-sea pCO2 (“∆pCO2”) were downloaded from the “Amon” and “Omon” tables of the GFDL-ESM2M model results for all four RCPs. They were subtracted by their corresponding pre-industrial control (pi-control) values and then averaged over 10 years. For example, data from January 1, 2005 to December 31, 2014 were used to calculate the atmospheric xCO2 and ∆pCO2 values in 2010. Then the seawater pCO2 change from 2000 to 2010 at a certain location was calculated according to Eq. 2. We similarly calculated the seawater pCO2 change relative to 2000 for all decades through 2100.
The temporal change of SST in all decades of the 21st century relative to 2000 was derived from the GFDL-ESM2M model outputs as well. Temperature of surface (“TOS”) and its “pi-Control” were downloaded from the “Omon” table of the GFDL-ESM2M results. Once we had the projected seawater pCO2 and SST values, by assuming constant salinity and TA, we were able to calculate pH at each location of the global ocean in all months for all decades of the 21st Century under the four RCP scenarios. The assumption of a constant TA could bring in a maximum pH bias of 0.004 pH units, much smaller than the pH calculation uncertainty of 0.01 pH units43.
Similarly, the historical surface ocean pH and Revelle Factor from 1870 to 1990 were calculated using the “esmHistorical” data from the GFDL-ESM2M model results. Because the GFDL-ESM2M model outputs start from January 1, 1861 and at least 10 years’ worth of data were needed to do a temporal average to estimate surface ocean pH in any decade, the earliest decade we could calculate pH for started in 1870. However, by assuming surface ocean pCO2 changes at the same rate as the atmospheric xCO240 everywhere in the global ocean, and SST stays the same from 1770 to 1860, we were able to calculate surface ocean pH in all months for all decades from 1770 to 1860 as well. Considering atmospheric xCO2 only changed 8.9 µatm from 1770 to 1870 (equivalent to a pH change of ~0.01 units), and the pH calculation is insensitive to temperature, the above approximation is unlikely to result in significant uncertainties in pH values over that timeframe.
The influences of the two temperature processes on surface ocean pH (chemical speciation vs. gas exchange) were quantified by examining seawater at the average global SST, salinity, DIC, and TA of 18.35 °C, 34.87, 2020 µmol kg−1, 2306 µmol kg–1 respectively26. The impact of the first process, i.e., the temperature dependence of the chemical speciation of seawater CO2 chemistry species, was isolated by assuming constant TA and DIC and varying temperatures of [0 °C:5 °C:30 °C], reflecting variations from the poles to the equator. Hydrogen ion (H+) generation caused by the dissociation of HCO3− can be estimated from the change of carbonate ion concentration ([CO32−]). Similarly, H+ generation caused by the dissociation of H2O can be estimated from the change of hydroxide ion concentration ([OH−]). H+ consumption caused by borate can be estimated from the change of borate alkalinity [B(OH)4−], and that caused by its reaction with HCO3− can be estimated from the change of aqueous carbon dioxide concentration ([CO2*]).
The impact of the second process, i.e., temperature-driven air-sea CO2 exchange was isolated by assuming fixed TA and pCO2 from the equator to the poles, varying input temperature to [0 °C:5 °C:30 °C] from the poles to the equator, while keeping output temperature constant. The combined influences of both processes can be estimated with a fixed TA and pCO2, while setting both input and output temperatures to [0 °C:5 °C:30 °C].
Supplementary information
Supplementary materials for Surface ocean pH and buffer capacity: past, present and future
Acknowledgements
We acknowledge funding support from the National Oceanic and Atmospheric Administration (NOAA) Ocean Acidification Program. B.R.C. was supported by the NOAA Carbon Data Management and Synthesis grant (N8R1SE3‐PGC) managed by Kathy Tedesco and David Legler of the Ocean Observations and Monitoring Division of the NOAA Climate Program Office. A.O. and S.K.L. were funded by the Norwegian Research Council (ICOS-Norway, 245927). We thank members of the SOCATv6 and GLODAPv2 for synthesizing and quality controlling the data products used for this analysis, and John P. Dunne (NOAA Geophysical Fluid Dynamics Laboratory) for help with the Earth System Model output. We are grateful to Taro Takahashi and Stewart Sutherland (Lamont-Doherty Earth Observatory) for help with the monthly surface ocean carbon dioxide data. We thank Huai-Min Zhang and Boyin Huang (NOAA National Centers for Environmental Information, NCEI) for helping with the preindustrial temperature data. We thank Tim Boyer (NCEI) for helping explore the gridding options, and James Orr (Laboratoire des Sciences du Climat et de l’Environnement, France) for helping estimate the CO2SYS calculation uncertainty. We thank Rik Wanninkhof of NOAA’s Atlantic Oceanographic and Meteorological Laboratory (AOML) for providing constructive comments that helped improve the manuscript. This is Pacific Marine Environmental Laboratory Contribution number 4798 and Joint Institute for the Study of the Atmosphere and Ocean Contribution number 2019-1034.
Author contributions
All authors contributed to the writing of the manuscript. In addition, L.-Q.J. conducted the data analysis and plotted the figures. B.R.C. provided guidance on the use of Earth System Models output for the temporal change simulation and helped with the uncertainty analysis. R.A.F. helped design the research. S.K.L. helped with the spatial gridding and uncertainty analysis. A.O. helped provide guidance on the use of the GLODAPv2 and SOCATv6 data products.
Data availability
Data used for this analysis are from the 6th version of the Surface Ocean CO2 Atlas (SOCATv6), and the 2nd version of the Global Ocean Data Analysis Project (GLODAPv2) data product, which are available at National Oceanic and Atmospheric Administration (NOAA) National Centers for Environmental Information (NCEI) [DOI:10.7289/V51Z42R8 (SOCATv6), and DOI:10.7289/V5KW5D97 (GLODAPv2)]. The data products of this study, i.e., the climatological distributions of global surface ocean pH, acidity, and Revelle Factor in all 12 months of the year from 1770 to 2100 (gridded data in netCDF format), as well as Powerpoint slides and animations for presentation, are available through NOAA/NCEI (DOI: 10.25921/kgqr-9h49). Please note that both SOCATv6 and GLODAPv2 are primarily open ocean based products. As a result, uncertainties in the coastal ocean could be very large due to the lack of data coverage and the subsequent gridding artifacts.
The scientific results and conclusions, as well as any views or opinions expressed herein, are those of the authors and do not necessarily reflect the views of NOAA or the Department of Commerce.|
Competing interests
The authors declare no competing interests.
Footnotes
Publisher’s note Springer Nature remains neutral with regard to jurisdictional claims in published maps and institutional affiliations.
Supplementary information
is available for this paper at 10.1038/s41598-019-55039-4.
References
- 1.Feely RA, et al. Impact of anthropogenic CO2 on the CaCO3 system in the oceans. Science. 2004;305:362–366. doi: 10.1126/science.1097329. [DOI] [PubMed] [Google Scholar]
- 2.Orr JC, et al. Anthropogenic ocean acidification over the twenty-first century and its impact on calcifying organisms. Nature. 2005;437:681–686. doi: 10.1038/nature04095. [DOI] [PubMed] [Google Scholar]
- 3.Feely RA, Doney SC, Cooley SR. Ocean Acidification: Present conditions and future changes in a high-CO2 world. Oceanography. 2009;22:36–47. doi: 10.5670/oceanog.2009.95. [DOI] [Google Scholar]
- 4.Khatiwala S, et al. Global ocean storage of anthropogenic carbon. Biogeosciences. 2013;10:2169–2191. doi: 10.5194/bg-10-2169-2013. [DOI] [Google Scholar]
- 5.Ussiri D. A. & Lal, R. The Global Carbon Inventory. Carbon Sequestration for Climate Change Mitigation and Adaptation (Springer, Cham, 2017).
- 6.Le Quéré C, et al. Global Carbon Budget 2018. Earth Syst. Sci. Data. 2018;10:2141–2194. [Google Scholar]
- 7.Broecker Wallace, Clark Elizabeth. A dramatic Atlantic dissolution event at the onset of the last glaciation. Geochemistry, Geophysics, Geosystems. 2001;2(11):n/a-n/a. doi: 10.1029/2001GC000185. [DOI] [Google Scholar]
- 8.Caldeira K, Wickett ME. Oceanography: anthropogenic carbon and ocean pH. Nature. 2003;425:365. doi: 10.1038/425365a. [DOI] [PubMed] [Google Scholar]
- 9.Doney SC, Fabry VJ, Feely RA, Kleypas JA. Ocean acidification: the other CO2 problem. Annu. Rev. Mar. Sci. 2009;1:169–192. doi: 10.1146/annurev.marine.010908.163834. [DOI] [PubMed] [Google Scholar]
- 10.Gattuso, J.-P. & Hansson, L. Ocean acidification (Oxford University Press, Oxford, 2011).
- 11.Gattuso J.-P., Magnan A., Billé R., Cheung W. W. L., Howes E. L., Joos F., Allemand D., Bopp L., Cooley S. R., Eakin C. M., Hoegh-Guldberg O., Kelly R. P., Pörtner H.-O., Rogers A. D., Baxter J. M., Laffoley D., Osborn D., Rankovic A., Rochette J., Sumaila U. R., Treyer S., Turley C. Contrasting futures for ocean and society from different anthropogenic CO2emissions scenarios. Science. 2015;349(6243):aac4722. doi: 10.1126/science.aac4722. [DOI] [PubMed] [Google Scholar]
- 12.Sørensen SPL, Palitzsch S. Uber die Messung der Wasserstoffionenkonzentration des Meerwassers. Biochem. Z. 1910;24:387. [Google Scholar]
- 13.Boyer, T. P. et al. World Ocean Database 2013, NOAA Atlas NESDIS 72 (eds Levitus, S. & Mishonov, A.), 10.7289/V5NZ85MT (Silver Spring, MD, 2013).
- 14.Byrne RH, Breland JA. High precision multiwavelength pH determinations in seawater using cresol red. Deep-Sea Res. 1989;36:803–810. doi: 10.1016/0198-0149(89)90152-0. [DOI] [Google Scholar]
- 15.Clayton TD, Byrne RH. Spectrophotometric seawater pH measurements: total hydrogen ion concentration scale calibration of m-cresol purple and at-sea results. Deep. Sea Res. 1993;40:2115–2129. doi: 10.1016/0967-0637(93)90048-8. [DOI] [Google Scholar]
- 16.Dickson AG. The measurement of seawater pH. Mar. Chem. 1993;44:131–142. doi: 10.1016/0304-4203(93)90198-W. [DOI] [Google Scholar]
- 17.Liu XW, Patsavas MC, Byrne RH. Purification and characterization of meta-cresol purple for spectrophotometric seawater pH measurements. Environ. Sci. Technol. 2011;45:4862–4868. doi: 10.1021/es200665d. [DOI] [PMC free article] [PubMed] [Google Scholar]
- 18.Douglas NK, Byrne RH. Achieving accurate spectrophotometric pH measurements using unpurified meta-cresol purple. Mar. Chem. 2017;190:66–72. doi: 10.1016/j.marchem.2017.02.004. [DOI] [Google Scholar]
- 19.Takahashi T, et al. Climatological distributions of pH, pCO2, Total CO2, Alkalinity, and CaCO3 Saturation in the global surface ocean, and temporal changes at selected locations. Mar. Chem. 2014;164:95–125. doi: 10.1016/j.marchem.2014.06.004. [DOI] [Google Scholar]
- 20.Dunne JP, et al. GFDL’s ESM2 global coupled climate-carbon earth system models. Part II: carbon system formulation and baseline simulation characteristics. J. Climate. 2013;26:2247–2267. doi: 10.1175/JCLI-D-12-00150.1. [DOI] [Google Scholar]
- 21.Bopp L, et al. Multiple stressors of ocean ecosystems in the 21st century: projections with CMIP5 models. Biogeosciences. 2013;10:6225–6245. doi: 10.5194/bg-10-6225-2013. [DOI] [Google Scholar]
- 22.Key RM, et al. A global ocean carbon climatology: Results from Global Data Analysis Project (GLODAP) Global Biogeochem. Cycles. 2004;18:GB4031. doi: 10.1029/2004GB002247. [DOI] [Google Scholar]
- 23.Bakker DCE, et al. A multi-decade record of high quality fCO2 data in version 3 of the Surface Ocean CO2 Atlas (SOCAT) Earth System Science Data. 2016;8:383–413. doi: 10.5194/essd-8-383-2016. [DOI] [Google Scholar]
- 24.Carter BR, et al. Updated methods for global locally interpolated estimation of alkalinity, pH, and nitrate. Limnol. Oceanogr. Methods. 2017;16:119–131. doi: 10.1002/lom3.10232. [DOI] [Google Scholar]
- 25.Revelle R, Suess HE. Carbon dioxide exchange between atmosphere and ocean and the question of an increase of atmospheric CO2 during the past decades. Tellus. 1957;9:18–27. doi: 10.3402/tellusa.v9i1.9075. [DOI] [Google Scholar]
- 26.Olsen A, et al. An internally consistent data product for the world ocean: The Global Ocean Data Analysis Project version 2 (GLODAPv2) – an internally consistent data product for the world ocean. Earth Syst. Sci. Data. 2016;10:297–323. doi: 10.5194/essd-8-297-2016. [DOI] [Google Scholar]
- 27.Lauvset SK, Gruber N, Landschutzer P, Olsen A, Tjiputra J. Trends and drivers in global surface ocean pH over the past 3 decades. Biogeosciences. 2015;12:1285–1298. doi: 10.5194/bg-12-1285-2015. [DOI] [Google Scholar]
- 28.Jiang L-Q, et al. Climatological distribution of aragonite saturation state in the global oceans. Global Biogeochem. Cycles. 2015;29:1656–1673. doi: 10.1002/2015GB005198. [DOI] [Google Scholar]
- 29.Mucci A. The solubility of calcite and aragonite in seawater at various salinities, temperatures, and one atmosphere total pressure. Am. J. Sci. 1983;283:781–799. doi: 10.2475/ajs.283.7.780. [DOI] [Google Scholar]
- 30.Carroll JJ, Slupsky JD, Mather AE. The solubility of carbon dioxide in water at low pressure. J. Phys. Chem. Ref. Data. 1991;20:1201–1209. doi: 10.1063/1.555900. [DOI] [Google Scholar]
- 31.Feely RA, et al. Decadal changes in the aragonite and calcite saturation state of the Pacific Ocean. Global Biogeochem. Cycles. 2012;26:GB3001. doi: 10.1029/2011GB004157. [DOI] [Google Scholar]
- 32.Lauvset SK, et al. A new global interior ocean mapped climatology: the 1° × 1° GLODAP version 2. Earth Syst. Sci. Data. 2016;8:325–340. doi: 10.5194/essd-8-325-2016. [DOI] [Google Scholar]
- 33.Lueker TJ, Dickson AG, Keeling CD. Ocean pCO2 calculated from dissolved inorganic carbon, alkalinity, and equations for K1 and K2: validation based on laboratory measurements of CO2 in gas and seawater at equilibrium. Mar. Chem. 2000;70:105–119. doi: 10.1016/S0304-4203(00)00022-0. [DOI] [Google Scholar]
- 34.Dickson AG. Standard potential of the reaction: AgCl(s) + 1/2 H2(g) = Ag(s) + HCl(aq), and the standard acidity constant of the ion HSO4− in synthetic seawater from 273.15 to 318.15K. J. Chem. Thermodyn. 1990;22:113–127. doi: 10.1016/0021-9614(90)90074-Z. [DOI] [Google Scholar]
- 35.Dickson AG. Thermodynamics of the dissociation of boric acid in synthetic sea water from 273.15 to 318.15 K. Deep-Sea Res. 1990;37:755–766. doi: 10.1016/0198-0149(90)90004-F. [DOI] [Google Scholar]
- 36.Uppstrom LR. The boron/chloronity ratio of deep-sea water from the Pacific Ocean. Deep-Sea Res. 1974;21:161–162. [Google Scholar]
- 37.Orr James C., Epitalon Jean-Marie, Dickson Andrew G., Gattuso Jean-Pierre. Routine uncertainty propagation for the marine carbon dioxide system. Marine Chemistry. 2018;207:84–107. doi: 10.1016/j.marchem.2018.10.006. [DOI] [Google Scholar]
- 38.van Heuven, S., Pierrot, D., Lewis, E. & Wallace, D. W. R. Matlab Program Developed for CO2System Calculations (Carbon Dioxide Information Analysis Center, Oak Ridge National Laboratory, US Department of Energy, Oak Ridge, Tennessee, 2009).
- 39.Lewis, E., & Wallace, D. W. R. Program Developed for CO2System Calculations, ORNL/CDIAC-105 (Carbon Dioxide Information Analysis Center, Oak Ridge National Laboratory, U. S. Department of Energy, Oak Ridge, Tennessee, 1998).
- 40.IPCC. Synthesis Report. Contribution of Working Groups I, II and III to the Fifth Assessment Report of the Intergovernmental Panel on Climate Change (eds Pachauri, R. K. & Meyer, L. A.) (IPCC, Geneva, Switzerland, 2014).
- 41.NOAA. Extended Reconstructed Sea Surface Temperature (ERSST.v5), https://www.ncdc.noaa.gov/data-access/marineocean-data/extended-reconstructed-sea-surface-temperature-ersst, (National Centers for Environmental Information, Asheville, North Carolina, USA, 2017).
- 42.Barth A, Beckers J-M, Troupin C, Alvera-Azcárate A, Vandenbulcke L. Divand−1.0: n-dimensional variational data analysis for ocean observations. Geosci. Model Dev. 2014;7:225–241. doi: 10.5194/gmd-7-225-2014. [DOI] [Google Scholar]
- 43.Carter BR, et al. When can ocean acidification impacts be detected from decadal alkalinity measurements? Global Biogeochem. Cycles. 2016;30:595–612. doi: 10.1002/2015GB005308. [DOI] [Google Scholar]
Associated Data
This section collects any data citations, data availability statements, or supplementary materials included in this article.
Supplementary Materials
Supplementary materials for Surface ocean pH and buffer capacity: past, present and future
Data Availability Statement
Data used for this analysis are from the 6th version of the Surface Ocean CO2 Atlas (SOCATv6), and the 2nd version of the Global Ocean Data Analysis Project (GLODAPv2) data product, which are available at National Oceanic and Atmospheric Administration (NOAA) National Centers for Environmental Information (NCEI) [DOI:10.7289/V51Z42R8 (SOCATv6), and DOI:10.7289/V5KW5D97 (GLODAPv2)]. The data products of this study, i.e., the climatological distributions of global surface ocean pH, acidity, and Revelle Factor in all 12 months of the year from 1770 to 2100 (gridded data in netCDF format), as well as Powerpoint slides and animations for presentation, are available through NOAA/NCEI (DOI: 10.25921/kgqr-9h49). Please note that both SOCATv6 and GLODAPv2 are primarily open ocean based products. As a result, uncertainties in the coastal ocean could be very large due to the lack of data coverage and the subsequent gridding artifacts.
The scientific results and conclusions, as well as any views or opinions expressed herein, are those of the authors and do not necessarily reflect the views of NOAA or the Department of Commerce.|


