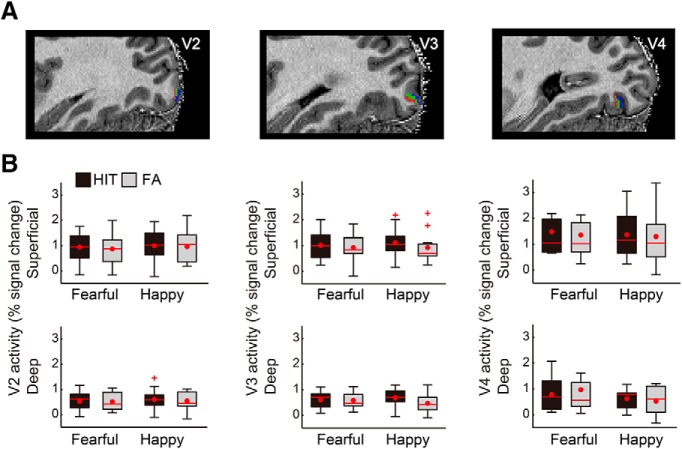
Figure 4.
Control analyses showing no differential activity in V2, V3, and V4 in HIT compared with FA trials. A, V2, V3, and V4 cortical depths are visualized on the anatomic image of an example participant, with the same color coding as for V1 shown in Figure 3. B, Unlike V1, V2–V4 did not show any differential activity between the percept types and facial emotions, regardless of cortical depth. Box plot shows upper (75%) and lower (25%) quartiles with median (red line) and mean (red dot), with whisker showing maximum and minimum value. An outlier (outside of ±2.7 SDs within a distribution for a given condition) is shown with a red cross.

