

Abstract
G-protein-coupled receptors (GPCRs) are among the most important receptors in human physiology and pathology. They serve as master regulators of numerous key processes and are involved in as well as cause debilitating diseases. Consequently, GPCRs are among the most attractive targets for drug design and pharmaceutical interventions (>30% of drugs on the market). The glucagon-like peptide 1 (GLP-1) hormone receptor GLP1R is closely involved in insulin secretion by pancreatic β-cells and constitutes a major druggable target for the development of anti-diabetes and obesity agents. GLP1R structure was recently solved, with ligands, allosteric modulators and as part of a complex with its cognate G protein. However, the translation of this structural data into structure/function understanding remains limited. The current study functionally characterizes GLP1R with special emphasis on ligand and cellular partner binding interactions and presents a free-energy landscape as well as a functional model of the activation cycle of GLP1R. Our results should facilitate a deeper understanding of the molecular mechanism underlying GLP1R activation, forming a basis for improved development of targeted therapeutics for diabetes and related disorders.
Introduction
Diabetes mellitus is a debilitating metabolic disorder in which blood glucose levels are abnormally high (1). The prevalence of diabetes worldwide has markedly increased in the past decade (2), with more than 400 million individuals diagnosed with diabetes and predictions as dire as diabetes becoming the 7th leading cause of death globally by 2030 (3). One receptor involved in glucose regulation, and consequently showing great promise to mitigate diabetes pathophysiology is the glucagon-like peptide 1 receptor, GLP1R. GLP1R is found in the pancreas, intestine, kidney, lung, heart, and brain (4, 5). It is a class B G-protein-coupled receptor (GPCR) (6) and it contains a large extracellular domain (ECD) which is not present in class A GPCRs, such as rhodopsin and the β2AR. GLP1R’s agonist, GLP-1, is released from L cells of the gut after eating (7) and it is the ECD that initially recognizes and binds GLP-1 (6, 8). GLP1R signaling, mediated by the stimulatory G-protein pathway (9, 10), stimulates insulin secretion from pancreatic β cells (11, 12); inhibits glucagon release from α cells (13); reduces appetite and energy intake (14, 15); and delays gastric emptying (16, 17) (see Figure 1). All these effects contribute to better management of the pathophysiology of diabetes and obesity (18–20).
Fig. 1.
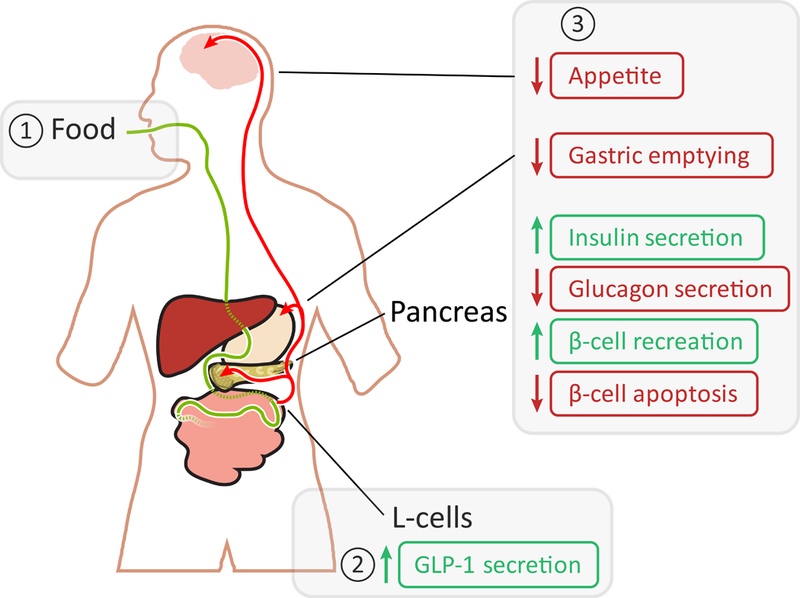
Physiological effects of GLP1R. Food consumption is marked with a green line and GLP-1 in the blood is marked with red arrows. The small green and red vertical arrows denote increase or decrease, respectively. The boxed 1, 2 and 3 show the canonical sequence of event for GLP-1, where 1 denotes the trigger, 2 the release and 3 the effects in the brain, stomach, and pancreas.
Broadly, GPCRs are membrane-bound proteins that partake in diverse physiological processes (e.g. hormonal regulation, cognition, mood, smell, and taste (21)), conveying information and allowing cells to react to their environment. GPCRs are omnipresent in human physiology (22), and their malfunction causes and affects a variety of malignant and non-malignant disorders including various cancers (23), diabetes (24), Alzheimer’s disease (25), and more (26). Indeed, more than 30% of drugs under development target GPCRs (27–29).
The basic principle of action of GPCRs, including GLP1R, entails binding of an agonist (GLP-1 for GLP1R; and e.g. adrenaline for the β2 adrenergic receptor and morphine for the μ opioid receptor), followed by signal transduction via conformational changes that result in binding of the intracellular cognate heterotrimeric G-protein partner (Gs in the case of GLP1R; or e.g. Gi in the case of the μ opioid receptor). The G protein’s α subunit then exchanges its bound GDP (resting inactive state) with GTP (active state), the G protein unbinds from the receptor and disassembles to elicit and amplify the main response inside the cell (activation of adenylate cyclase in the case of Gs; see Figure 2; or e.g. stimulation of phospholipase C for Gq). The activated receptor then undergoes phosphorylation by a G-protein coupled receptor kinase (GRK), followed by binding of β-arrestin and finally signal termination in clathrin-mediated endocytosis of the receptor (30, 31).
Fig. 2.
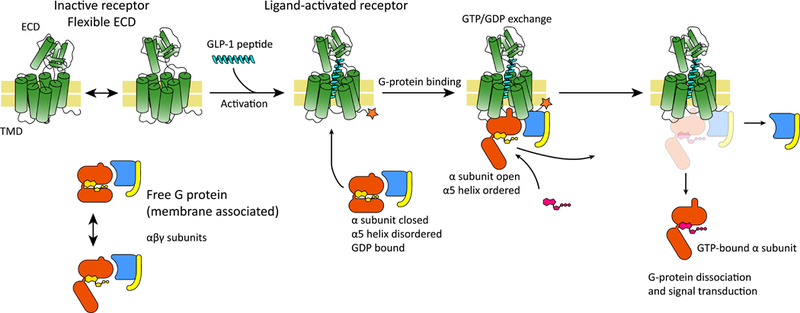
Canonical activation sequence for GLP1R. The receptor harbors the GPCR-typical 7 transmembrane helices domain (TMD) and an extracellular domain (ECD) which bears some flexibility, represented schematically in the figure with a two-headed arrow. The inactive receptor binds the ligand, GLP-1, undergoes a conformational change and becomes active (highlighted with a star in the figure). Cellular G protein bound to the activated receptor then undergoes conformational changes (namely, opening and ordering of the α5 domain; see text), allowing the exchange of GDP with GTP (shown in yellow and magenta). Finally, the GTP-bound G protein dissociates and the subunits elicit cellular response.
GLP1R agonists (GLP1RAs), such as semaglutide and liraglutide, are increasingly used to treat diabetic patients (32, 33), exhibiting benefits such as reducing the risk of death from heart diseases in diabetic patients (32); having insulinotropic effects in type 1 diabetes patients (34); and are known to increase the growth, differentiation, and regeneration of β cells (18, 35). Overall, GLP1RAs-related studies show promise against type 1 and type 2 diabetes, prediabetes, obesity, as well as heart, liver, and neurological diseases (19, 36). And yet, investigating GLP1R from a structural perspective has been surprisingly limited. Studying GLP1R at the molecular level can have a fundamental impact on medical understanding and therapeutic interventions to cope with diabetes and obesity.
In this respect, computational biology facilitates the study of processes such as protein function and dynamics in very high detail. Here, we conducted extensive studies on GLP1R and its complexes with cellular partners and its agonist, using computational and modeling techniques. We calculated and constructed free-energy landscapes for GLP1R activation, similar to our recent study on the β2AR (37). The aim of this study was to achieve a high level of understanding of the molecular and energetic details of GLP1R activation.
Obtaining realistic free-energy landscapes that describe the function of biological system proved useful in previous studies (e.g. (38–41)). However, specifically for GPCRs progress has been limited, as discussed by Deupi and Kobilka (42). To this end, in our previous β2AR study (37) we modeled and constructed all the end-point conformations of the G protein (considering the inter-domain orientation and the order/disorder state of the C-terminal α5) and receptor, including all complexes. Together with the current study, the studies may serve as cornerstones in constructing a complete molecular model of GPCR activation in general, a feat that should prove highly valuable for the scientific and pharmaceutical communities. Additionally, the current study is aimed at providing a more realistic representation of GLP1R activation and interaction with the agonist and cellular partner, facilitating future studies on this medically important receptor, especially for the increasing epidemic of type 2 diabetes.
Materials and Methods
Modeling
The structural modeling process in the current study made use of MODELLER (43), CHARMM-GUI server (44), and several VMD plugins (45). Briefly, different components of the system (described below) were joined using RMSD alignment, and missing connectors were constructed de-novo. For the receptor, active and inactive conformations were taken from PDB 5VAI (46) and 5VEX (monomer A; (47)), respectively. For the G-protein: open-ordered, open-disordered, and closed states were based on 3SN6 (48), 5JS8 (49), and 1GP2 (50), respectively (see our previous study for more details (37)). All amino-acid sequences were modified to match the sequences from AAR05444.1 (H. sapiens GLP1R; 29–421) for the receptor; EAX11358.1 (H. sapiens glucagon; 181–210) for GLP-1; and NP_000507.1 (H. sapiens G(s)α; 9–394), NP_032168.1 (M. musculus G(s)β; 2–340), and NP_034445.1 (M. musculus G(s)γ; 5–62) for G protein subunits α, β, and γ; respectively; all accessions are from NCBI GenBank. Finally, residues that were not present in all models were deleted (e.g. residues at the termini that were not resolved in some of the solved structures), for finals models with the exact same atoms (in terms of number and types) throughout the systems (albeit at different coordinates). This step is important to make the energy comparison reliable.
At the end of the modeling process, we found that minor clashes and bad topologies were resolved in the relaxation (see below). However, large overlaps between domains/subunits could not be overcome without manual intervention, in the form of minute spatial translations minimizing the overlap. As a control, we calculated the coarse-grained (CG) energy of randomly generated translations of similarly small magnitudes and found they had little effect on the total energy of the system, provided the system was allowed to relax. Missing loops were modeled de-novo using MODELLER (43) and CHARMM-GUI (44).
Relaxation
The first step of model relaxation was performed with a 1 ns MD run using Gromacs 2018.1, with no membrane present (we note that MD simulations for the purpose of refinement of membrane protein models is effective even without a membrane, see (51)). Then, we performed further relaxation, production simulations and calculations of each assembled system using MOLARIS simulation package (52), where each system was embedded in a grid of particles emulating a membrane bilayer (36Å thick), and surrounded by a water sphere (40 Å radius). We performed energy minimization using the steepest descent algorithm, and relaxation by a short MD simulation of 20 ps for local relaxation of the system, prior to the energy calculations.
Total energy calculations
For the total energy of the various systems, 20 frames from each MD run (performed with MOLARIS) were taken the proteins within the system were simplified to the CG model of MOLARIS-XG (53, 54). Then, we used the MCPT method, where a Monte Carlo (MC) simulation (53) is performed, allowing proton transfer events to occur, followed by a free-energy calculation, using our in-house CG and the ‘model 1’ parameter (see (54) and the SI appendix for more details on the energy terms). The free energy for each system was computed as the average of these 20 MCPT simulations. The electrostatic energy term however was scaled down by a factor of 2.
Results and Discussion
Building the complexes
The construction of the complexes was done by combining existing subunits and domains from experimentally determined structures. GLP1R in its active state was taken from PDB ID 5VAI (46). The inactive conformation was taken from PDB ID 5VEX ((47); monomer A).The G-protein subunits were taken from 5VAI. The modeling of the G-protein α subunit conformations, considering the relative orientation of the AHD and the RD, as well as the folded state of the α5-β6 region were taken from our previous study (37), and in the current work will be referred to as open/closed and ordered/disordered, respectively. Missing segments (e.g. the active conformation is missing the loop connecting the ECD to the TM domain) were taken from other templates where they were resolved (mostly from 5VAI). The full sequence of all models was matched to the sequence of H. sapiens GLP1R (EMBL accession AAR05444, residues 29–421) and extraneous segments that could not be properly modeled in the other conformations were deleted. The reason for this treatment is the potential effect that the different sequence and length of the protein modeled will affect the free energies and mask differences in energy that are functionally important (and resulting from the tertiary and quaternary structures).
Finally, using these different properties (active/inactive, G-protein open/close etc.) we assembled all the combination complexes and calculated their respective free energies (see below).
Following the construction of the complexes, we submitted all systems to energy minimization (using the steepest decent algorithm), followed by refinement using an MD simulation. Initially, the refinement was performed using Gromacs 2018.1 for 1 ns without a membrane (using MD simulations to refine membrane protein models without a membrane has been recently shown to be as effective as with a membrane (51); not to be confused with production runs). Next, the assemblies were embedded in a 36Å-thick membrane grid and a 40Å-radius water sphere. Finally, the systems were simulated using the MOLARIS simulation package (52) for 20 ps, allowing local relaxation of the protein subunits. The energy calculations (see below) were performed on these relaxed systems.
Interestingly, the G-protein α subunit conformation in PDB ID 5VAI is very similar to the conformation of the β2AR (the subject of our previous study (37), PDB ID 3SN6 (48)). Consequently, we assume that it should harbor the same conformation for the missing fragments and subunits. Therefore, we took those missing parts of the G protein directly from the models of our previous study (37). When different fragments were connected, the connections were refined using SWISS-MODEL (55), and finally individual missing atoms were added using the CHARMM-GUI server (44). The sequences of the G-protein subunits are as follows: α: human, β: mouse, and γ: mouse.
The GLP-1 peptide structure was taken from 5VAI and the Exendin (Ex) peptide structure was taken from PDB ID 6B3J (56). The ligand in 6B3J is in fact Ex-P5, however, the sequence of the resolved part is identical to the commonly used Ex-4.
Free energy landscape
To better understand the system, we computed the total energy of all the states mentioned above; namely: receptor active/inactive, G-protein α subunit open/close, α5-β6 ordered/disordered, and with or without GLP-1 peptide (or Ex); note that some specific combinations are not sterically possible. The total free energy was computed using our electrostatics-based coarse-grained (CG) model (53, 54) and related approaches (57), while scaling down the electrostatic energy by a factor of 2 for reasons that will be discussed below. The SI contains details on the energy function of our CG model.
We find that the inactive state of the GLP1R is overall lower in energy than the active state (whether the G protein is bound, and regardless of its own conformation; see Figure 3). This outcome suggests fairly low basal activity for GLP1R, in the absence of an activating agent, in line with the experimentally reported basal activity of <10% (58). Clearly, it is expected that the agonist would serve as such an activator and tilt the equilibrium towards activation of the receptor. Indeed, our calculations reveal an energy decrease upon binding of GLP-1 (or Ex, see below) to the receptor. It is worth noting that the receptor can only bind GLP-1 in its active form and only when the ECD is in a binding-permitting orientation (such as in 5VAI); thus, the binding energy of GLP-1 should compensate the energy difference between the active and inactive states of the receptor, as well as the difference in energy between the ECD conformations (including the entropic loss, more on this below). We will discuss the binding of GLP-1 in more details below.
Fig. 3.
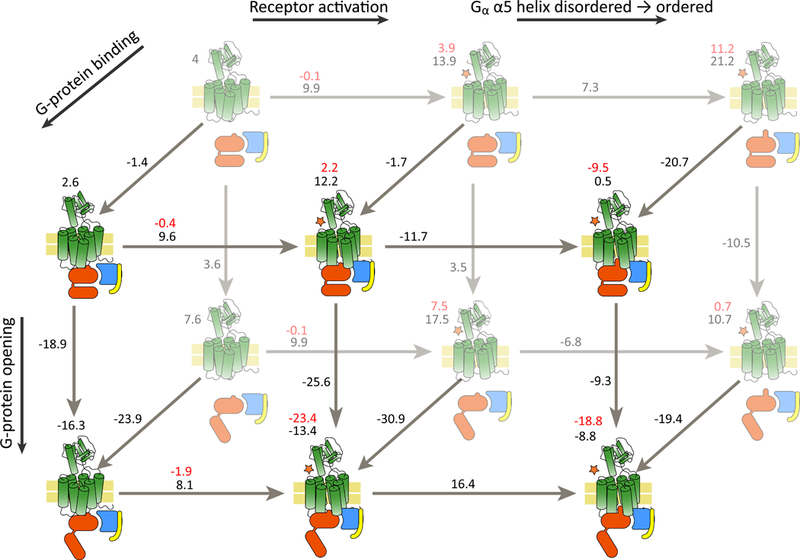
State total free energy. The various states as described above and their associated MCPT total free energy are shown as illustrations, with the energy labeled above it. The difference in free energy between two states is shown in black on the arrow, and the red is the energy after parametrically adding the binding energy of the ligand. The reaction coordinates are labeled with thick arrows on the edges of the scheme. The receptor is illustrated in green, with a star denoting activation, the G-protein subunits are illustrated in red, blue and yellow for α, β, and γ, respectively.
Another important aspect to consider is the energy landscape with respect to G-protein binding to the receptor. Here, the observed energies indicate that the G protein binds with very high affinity to the receptor, at nearly all conditions. This suggests a pre-coupled complex, as mentioned in other studies (59, 60). However, due to the high magnitude of the binding energy it is more likely that our interaction energies are overestimated (some energy differences are higher than what would be expected for protein-protein interactions) and should be viewed more as qualitative guidelines in understanding the system, rather than biophysical constants.
Next, we report an increase in energy when the free G protein transits from closed to open. Studies show that the transition between the states for the free G protein has a small energy gap (49, 61). The open state, however, becomes more dominant when the G protein is bound to the active receptor, as seen in our energy landscape and in the cited studies above. This is in line with the notion that upon binding to the activated receptor, the G protein undergoes the changes required to release GDP and induce signal transduction (separation of the AHD and the RD, termed opening in the current study; and ordering of the α5-β6 segment; see (37)). However, there are some discrepancies in this respect between expected trends and our computed energies. The difference in energy between the open and closed state, when the G protein is bound to the receptor is very large, and is probably over estimated, especially when the G protein is bound to the inactive receptor. Also, the energy of the system does not further decrease when the α5-β6 segment becomes ordered, which is a pre-requisite for signal transduction. We do note that the α5-β6 segment has been modeled based on various structures, and the modeling process could be the source of this discrepancy. Also, we observed spontaneous opening and ordering within the free G protein, which would suggest spontaneous signal transduction not only in the absence of agonist, but even in the absence of a receptor. This is probably the biggest shortcoming in our landscape estimate, and it clearly reflects problems with the calculations or the underlying structures. It is difficult to predict which aspect of the modeling and energy calculation process resulted in this inaccuracies and issues.
Finally, in the current study we did not compute the binding energies of the GTP or GDP to the G protein. This omission was because in our previous study these energies were already computed, and the G protein is in fact the same structure and sequence as previously used (see (37) for more details).
Binding of GLP-1
To gain more insight into the agonist-binding-induced activation of GLP1R we calculated the binding energy of the receptor’s natural agonist, GLP-1, as well as Ex (Exendin-4 is found in the saliva of the Gila monster H. suspectum but we are using a truncated version, based on the resolved structure of bound Ex-P5, harboring the same sequence for that segment; we refer to the agonist as Ex to avoid confusion), an agonist often used in experiments (we did not use an available structure of Ex-4 because there are none bound to GLP1R). The reported affinities for these peptides are in the range of 50–100 nM and 2 nM for GLP-1 and Ex-4, respectively (62), corresponding to approximate binding free energies of −10 and −12 kcal/mol (the missing parts of Ex-4 are beyond the ligand binding site, and therefore our calculated binding energy for Ex should be in line with the experimental results for full Ex-4). The binding energies were calculated using the more robust PDLD/S-LRA method (see SI for more details on PDLD/S-LRA), which has proved very useful for calculating binding energies of polar ligands (e.g. (63)). The binding was calculated for the active receptor with and without a bound G protein. The inactive receptor and several ECD orientations that we generated (de-novo) created steric clashes that could not be overcome by reasonable computational means, and we therefore proceed under the assumption that the energetic contribution to the binding affinity is principally from the single conformation of active receptor with the ECD oriented as in 5VAI. As evident in Table 1, the binding energy of the ligands behaves qualitatively similar (reflected by maintaining the higher-to-lower order of the energy, and by absolute values and deltas within 5 kcal/mol or less) in the presence or absence of the G protein (with a difference of ~5 kcal/mol in favor of free G protein; this is somewhat surprising and is possibly a convergence issue), and this is to be expected, since the distance to the binding site is fairly large, and the contribution is probably indirect (via stabilizing a conformation). We note that the binding energy is enough to convert the receptor from the inactive conformation to the active one, as expected and required for the model to make sense. In Figs. 3 and 4 we present the total energy of each state (in black) and the total energy of the state in the presence of bound GLP-1 (which was calculated using the CG method and the PDLD method, see methods and SI). However due to instabilities resulting from the flexibility and size of the ligand, and potential convergence issues, the energies in the figure were computed by adding the binding energy of GLP-1 as a parameter (−10 kcal/mol, see above).
Table 1.
Binding energies (in kcal/mol) of GLP1R ligands
| Method | Ligand | No G protein | With G protein | ||
|---|---|---|---|---|---|
| With ECD | No ECD | With ECD | No ECD | ||
| GLP-1 | −23 | −13 | −18 | −12 | |
| Ex | −16 | −21 | −14 | −19 | |
All energies are in kcal/mol
Fig. 4.
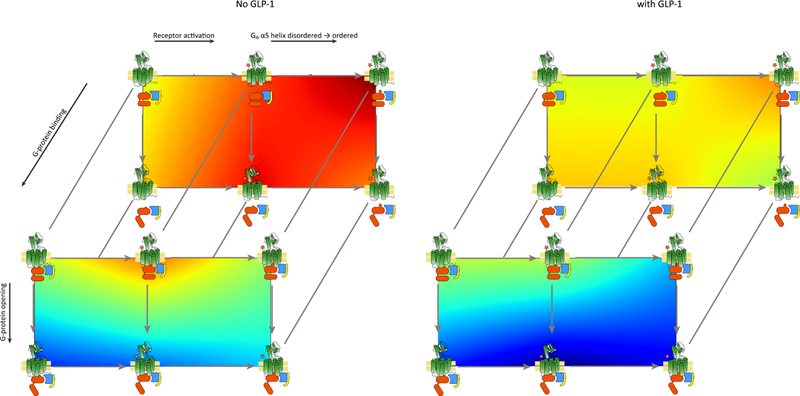
Free-energy landscapes. The energies from Fig. 3 are shown as landscapes (heat maps) in 2D, projected on the same state scheme as in Fig. 3. The barriers are unknown and were not computed, and so the figure presents a linear interpolation of the total energies, without taking barriers into account. The state scheme has been geometrically stretched to accommodate the maps more clearly. Red is high energy and blue is low energy.
ECD contribution
The PDLD/S-LRA ligand-binding calculations (see SI for details on the method) described above were also conducted in the absence of the ECD domain (by removing it from the system entirely) in order to assess the energetic contribution of the ECD domain to the total binding energy. The results, presented in Table 1, show that the ECD domain reinforces ligand binding, in line with experimental results (6, 8). Finally, there is not enough information regarding the entropic contribution of the ECD domain in order to relate to how the agonist binding energy term compensates for the loss of entropy (assuming the ECD domain spontaneously assumes a non-binding conformation in the resting state of the receptor, when GLP-1 is not bound). Regardless, the difference in energies presented in Fig. 3 appear large enough to compensate for reasonable loss of entropy, for a domain of that size.
Concluding remark
In this study, we calculated free-energy for various key states of GLP-1R (Figs. 3 and 4), with respect to its conformation, and interaction with its ligands and cognate G protein, as well as the G protein’s conformation and activation (release of GDP). Our calculated energies, in large, are consistent with experiment and indicate the canonical activation cycle of low basal activity, shift of the equilibrium towards the active state after binding of the ligand (natural or not), and G-protein activation when it is bound to an active receptor. In this respect, it is worth noting that the movement of α5 entails motion in the connected β6 structural element, and the joint movement of the α5-β6 region was experimentally shown to be involved in GDP release (64, 65). Also, the movement of helix α5, which is a prerequisite for release of GDP (66). Thus, our computed energies conform with the notion that only interactions with the activated receptor will result in release of GDP from the G-protein (67), and hence in signal transduction; regardless of unproductive conformational changes occurring in the G-protein, as reported in (61).
We also show indications for the importance of the ECD domain for ligand activation (where the energy contribution of the ECD to ligand binding is principally a determinant in tilting the equilibrium between active and inactive receptor).
However, our model has its caveats, namely that the energetic values themselves are overestimated, and some energy differences are larger than what would be expected for a system in equilibrium in a live cell. We attribute these discrepancies to inaccuracies in modeling as well as convergence and parameter tuning issues. Having said that, we find the model useful, and believe that it will serve as a good platform for further studied in biochemistry or for pharmacological pursuits. More specifically, our study provides a qualitative and even semiquantitative description of the landscape of GLP1R which could help in rational design of drugs that control signal transduction processes related to diabetes and obesity. This challenging task is partially addressed here using our CG model for analyzing in detail GLP1R. With respect to the GPCR-associated ternary complex model (68, 69), our model (and specifically Fig. 3) reinforces and adds to the existing model. This is not surprising since they all rely on the same basic principles of thermodynamics.
In trying to generalizing a perspective about the outcome of this work to GPCRs as a family, it is worth nothing that the mechanism of GPCRs as a whole is probably shared between most members of the family, and the details of the interactions with partners and subsequent effects on them and cascading cellular response, is probably common between all members that bind the same cognate G protein (e.g. Gs). The common mechanism assumption is probably best supported by GPCR architecture being well preserved (even in cases of low sequence similarity (70)) and the common binding pocket for G protein partners, on the cytoplasmic face of different receptors (71), and shows that our results could serve as a cornerstone in further understanding of GLP1R, or other GPCRs as well.
Supplementary Material
Acknowledgments
This work was supported by the National Science Foundation grant MCB 1707167, National Institute of Health R01-AI055926, and the Bridge Institute. We thank the University of Southern California High Performance Computing and Communication Center (HPCC) for computational resources. We also wish to thank Prof. Raymond C. Stevens for inspiring discussions.
References
- 1.Alam U, Asghar O, Azmi S, & Malik RA (2014) General aspects of diabetes mellitus. Handb Clin Neurol 126:211–222. [DOI] [PubMed] [Google Scholar]
- 2.Caspard H, et al. (2018) Recent trends in the prevalence of type 2 diabetes and the association with abdominal obesity lead to growing health disparities in the USA: An analysis of the NHANES surveys from 1999 to 2014. Diabetes Obes Metab 20(3):667–671. [DOI] [PMC free article] [PubMed] [Google Scholar]
- 3.Kerru N, Singh-Pillay A, Awolade P, & Singh P (2018) Current anti-diabetic agents and their molecular targets: A review. Eur J Med Chem 152:436–488. [DOI] [PubMed] [Google Scholar]
- 4.Baggio LL & Drucker DJ (2014) Glucagon-like peptide-1 receptors in the brain: controlling food intake and body weight. J Clin Invest 124(10):4223–4226. [DOI] [PMC free article] [PubMed] [Google Scholar]
- 5.Heppner KM & Perez-Tilve D (2015) GLP-1 based therapeutics: simultaneously combating T2DM and obesity. Front Neurosci 9:92. [DOI] [PMC free article] [PubMed] [Google Scholar]
- 6.de Graaf C, et al. (2017) Extending the Structural View of Class B GPCRs. Trends Biochem Sci 42(12):946–960. [DOI] [PubMed] [Google Scholar]
- 7.Graaf C, et al. (2016) Glucagon-Like Peptide-1 and Its Class B G Protein-Coupled Receptors: A Long March to Therapeutic Successes. Pharmacol Rev 68(4):954–1013. [DOI] [PMC free article] [PubMed] [Google Scholar]
- 8.Mann R, et al. (2007) Peptide binding at the GLP-1 receptor. Biochem Soc T 35:713–716. [DOI] [PubMed] [Google Scholar]
- 9.Drucker DJ, Philippe J, Mojsov S, Chick WL, & Habener JF (1987) Glucagon-like peptide I stimulates insulin gene expression and increases cyclic AMP levels in a rat islet cell line. Proc Natl Acad Sci U S A 84(10):3434–3438. [DOI] [PMC free article] [PubMed] [Google Scholar]
- 10.Dalvi PS, Nazarians-Armavil A, Purser MJ, & Belsham DD (2012) Glucagon-like peptide-1 receptor agonist, exendin-4, regulates feeding-associated neuropeptides in hypothalamic neurons in vivo and in vitro. Endocrinology 153(5):2208–2222. [DOI] [PubMed] [Google Scholar]
- 11.MacDonald PE, et al. (2002) The multiple actions of GLP-1 on the process of glucose-stimulated insulin secretion. Diabetes 51 Suppl 3:S434–442. [DOI] [PubMed] [Google Scholar]
- 12.Jones B, Bloom SR, Buenaventura T, Tomas A, & Rutter GA (2018) Control of insulin secretion by GLP-1. Peptides 100:75–84. [DOI] [PubMed] [Google Scholar]
- 13.Nauck MA, et al. (2002) Effects of glucagon-like peptide 1 on counterregulatory hormone responses, cognitive functions, and insulin secretion during hyperinsulinemic, stepped hypoglycemic clamp experiments in healthy volunteers. J Clin Endocr Metab 87(3):1239–1246. [DOI] [PubMed] [Google Scholar]
- 14.Holst JJ (2007) The physiology of glucagon-like peptide 1. Physiol Rev 87(4):1409–1439. [DOI] [PubMed] [Google Scholar]
- 15.Sandoval DA & D’Alessio DA (2015) Physiology of proglucagon peptides: role of glucagon and GLP-1 in health and disease. Physiol Rev 95(2):513–548. [DOI] [PubMed] [Google Scholar]
- 16.Nauck MA, et al. (1997) Glucagon-like peptide 1 inhibition of gastric emptying outweighs its insulinotropic effects in healthy humans. Am J Physiol 273(5 Pt 1):E981–988. [DOI] [PubMed] [Google Scholar]
- 17.Meier JJ, et al. (2003) Normalization of glucose concentrations and deceleration of gastric emptying after solid meals during intravenous glucagon-like peptide 1 in patients with type 2 diabetes. J Clin Endocrinol Metab 88(6):2719–2725. [DOI] [PubMed] [Google Scholar]
- 18.Cheang JY & Moyle PM (2018) Glucagon-Like Peptide-1 (GLP-1)-Based Therapeutics: Current Status and Future Opportunities beyond Type 2 Diabetes. ChemMedChem 13(7):662–671. [DOI] [PubMed] [Google Scholar]
- 19.Andersen A, Lund A, Knop FK, & Vilsboll T (2018) Glucagon-like peptide 1 in health and disease. Nat Rev Endocrinol 14(7):390–403. [DOI] [PubMed] [Google Scholar]
- 20.Chatterjee S, Ghosal S, & Chatterjee S (2016) Glucagon-like peptide-1 receptor agonists favorably address all components of metabolic syndrome. World J Diabetes 7(18):441–448. [DOI] [PMC free article] [PubMed] [Google Scholar]
- 21.Thomsen W, Frazer J, & Unett D (2005) Functional assays for screening GPCR targets. Curr Opin Biotechnol 16(6):655–665. [DOI] [PubMed] [Google Scholar]
- 22.Erlandson SC, McMahon C, & Kruse AC (2018) Structural Basis for G Protein-Coupled Receptor Signaling. Annu Rev Biophys. [DOI] [PubMed] [Google Scholar]
- 23.Gutierrez AN & McDonald PH (2017) GPCRs: Emerging anti-cancer drug targets. Cell Signal 41:65–74. [DOI] [PubMed] [Google Scholar]
- 24.Sebastiani G, Ceccarelli E, Castagna MG, & Dotta F (2018) G-protein-coupled receptors (GPCRs) in the treatment of diabetes: Current view and future perspectives. Best Pract Res Clin Endocrinol Metab 32(2):201–213. [DOI] [PubMed] [Google Scholar]
- 25.Thathiah A & De Strooper B (2011) The role of G protein-coupled receptors in the pathology of Alzheimer’s disease. Nat Rev Neurosci 12(2):73–87. [DOI] [PubMed] [Google Scholar]
- 26.Schoneberg T, et al. (2004) Mutant G-protein-coupled receptors as a cause of human diseases. Pharmacol Therapeut 104(3):173–206. [DOI] [PubMed] [Google Scholar]
- 27.Sriram K & Insel PA (2018) G Protein-Coupled Receptors as Targets for Approved Drugs: How Many Targets and How Many Drugs? Molecular Pharmacology 93(4):251–258. [DOI] [PMC free article] [PubMed] [Google Scholar]
- 28.Hauser AS, Attwood MM, Rask-Andersen M, Schioth HB, & Gloriam DE (2017) Trends in GPCR drug discovery: new agents, targets and indications. Nature Reviews Drug Discovery 16(12):829–842. [DOI] [PMC free article] [PubMed] [Google Scholar]
- 29.Pierce KL, Premont RT, & Lefkowitz RJ (2002) Seven-transmembrane receptors. Nat Rev Mol Cell Biol 3(9):639–650. [DOI] [PubMed] [Google Scholar]
- 30.Foster SR & Brauner-Osborne H (2018) Investigating Internalization and Intracellular Trafficking of GPCRs: New Techniques and Real-Time Experimental Approaches. Handb Exp Pharmacol 245:41–61. [DOI] [PubMed] [Google Scholar]
- 31.Gurevich VV & Gurevich EV (2008) GPCR monomers and oligomers: it takes all kinds. Trends in Neurosciences 31(2):74–81. [DOI] [PMC free article] [PubMed] [Google Scholar]
- 32.Khat DZ & Husain M (2018) Molecular Mechanisms Underlying the Cardiovascular Benefits of SGLT2i and GLP-1RA. Curr Diab Rep 18(7):45. [DOI] [PubMed] [Google Scholar]
- 33.Unger J (2018) A Clinical Overview of Once-weekly Glucagon-like Peptide-1 Receptor Agonists. J Fam Pract 67(6 suppl):S1–S2. [PubMed] [Google Scholar]
- 34.Kjems LL, Holst JJ, Volund A, & Madsbad S (2003) The influence of GLP-1 on glucose-stimulated insulin secretion: effects on beta-cell sensitivity in type 2 and nondiabetic subjects. Diabetes 52(2):380–386. [DOI] [PubMed] [Google Scholar]
- 35.Otto-Buczkowska E & Jainta N (2018) Pharmacological Treatment in Diabetes Mellitus Type 1 - Insulin and What Else? Int J Endocrinol Met 16(1). [DOI] [PMC free article] [PubMed] [Google Scholar]
- 36.Riddy DM, Delerive P, Summers RJ, Sexton PM, & Langmead CJ (2018) G Protein-Coupled Receptors Targeting Insulin Resistance, Obesity, and Type 2 Diabetes Mellitus. Pharmacol Rev 70(1):39–67. [DOI] [PubMed] [Google Scholar]
- 37.Alhadeff R, Vorobyov I, Yoon HW, & Warshel A (2018) Exploring the free-energy landscape of GPCR activation. Proc Natl Acad Sci U S A 115(41):10327–10332. [DOI] [PMC free article] [PubMed] [Google Scholar]
- 38.Astumian RD, Mukherjee S, & Warshel A (2016) The Physics and Physical Chemistry of Molecular Machines. ChemPhysChem 17(12):1719–1741. [DOI] [PMC free article] [PubMed] [Google Scholar]
- 39.Alhadeff R & Warshel A (2017) Reexamining the origin of the directionality of myosin V. Proc Natl Acad Sci U S A 114(39):10426–10431. [DOI] [PMC free article] [PubMed] [Google Scholar]
- 40.Lin JC, Hyeon C, & Thirumalai D (2014) Sequence-dependent folding landscapes of adenine riboswitch aptamers. Phys Chem Chem Phys 16(14):6376–6382. [DOI] [PMC free article] [PubMed] [Google Scholar]
- 41.Zhang B, Zheng W, Papoian GA, & Wolynes PG (2016) Exploring the Free Energy Landscape of Nucleosomes. J Am Chem Soc 138(26):8126–8133. [DOI] [PubMed] [Google Scholar]
- 42.Deupi X & Kobilka BK (2010) Energy Landscapes as a Tool to Integrate GPCR Structure, Dynamics, and Function. Physiology 25(5):293–303. [DOI] [PMC free article] [PubMed] [Google Scholar]
- 43.Webb B & Sali A (2017) Protein Structure Modeling with MODELLER. Methods Mol Biol 1654:39–54. [DOI] [PubMed] [Google Scholar]
- 44.Jo S, Kim T, Iyer VG, & Im W (2008) CHARMM-GUI: a web-based graphical user interface for CHARMM. J Comput Chem 29(11):1859–1865. [DOI] [PubMed] [Google Scholar]
- 45.Humphrey W, Dalke A, & Schulten K (1996) VMD: visual molecular dynamics. J Mol Graph 14(1):33–38, 27–38. [DOI] [PubMed] [Google Scholar]
- 46.Zhang Y, et al. (2017) Cryo-EM structure of the activated GLP-1 receptor in complex with a G protein. Nature 546(7657):248-+. [DOI] [PMC free article] [PubMed] [Google Scholar]
- 47.Song G, et al. (2017) Human GLP-1 receptor transmembrane domain structure in complex with allosteric modulators. Nature 546(7657):312–315. [DOI] [PubMed] [Google Scholar]
- 48.Rasmussen SG, et al. (2011) Crystal structure of the beta2 adrenergic receptor-Gs protein complex. Nature 477(7366):549–555. [DOI] [PMC free article] [PubMed] [Google Scholar]
- 49.Goricanec D, et al. (2016) Conformational dynamics of a G-protein alpha subunit is tightly regulated by nucleotide binding. P Natl Acad Sci USA 113(26):E3629–E3638. [DOI] [PMC free article] [PubMed] [Google Scholar]
- 50.Wall MA, et al. (1995) The Structure of the G-Protein Heterotrimer G(I-Alpha-1)Beta(1)Gamma(2). Cell 83(6):1047–1058. [DOI] [PubMed] [Google Scholar]
- 51.Dutagaci B, Heo L, & Feig M (2018) Structure refinement of membrane proteins via molecular dynamics simulations. Proteins 86(7):738–750. [DOI] [PMC free article] [PubMed] [Google Scholar]
- 52.Lee FS, Chu ZT, & Warshel A (1993) Microscopic and Semimicroscopic Calculations of Electrostatic Energies in Proteins by the POLARIS and ENZYMIX Programs. J. Comp. Chem. 14:161–185. [Google Scholar]
- 53.Vicatos S, Rychkova A, Mukherjee S, & Warshel A (2014) An effective coarse-grained model for biological simulations: recent refinements and validations. Proteins 82(7):1168–1185. [DOI] [PMC free article] [PubMed] [Google Scholar]
- 54.Vorobyov I, Kim I, Chu ZT, & Warshel A (2016) Refining the treatment of membrane proteins by coarse-grained models. Proteins 84(1):92–117. [DOI] [PMC free article] [PubMed] [Google Scholar]
- 55.Waterhouse A, et al. (2018) SWISS-MODEL: homology modelling of protein structures and complexes. Nucleic Acids Res 46(W1):W296–W303. [DOI] [PMC free article] [PubMed] [Google Scholar]
- 56.Liang YL, et al. (2018) Phase-plate cryo-EM structure of a biased agonist-bound human GLP-1 receptor-Gs complex. Nature 555(7694):121–125. [DOI] [PubMed] [Google Scholar]
- 57.Warshel A, Sharma PK, Kato M, & Parson WW (2006) Modeling electrostatic effects in proteins. Biochim. Biophys. Acta 1764(11):1647–1676. [DOI] [PubMed] [Google Scholar]
- 58.Al-Sabah S, et al. (2014) The GIP receptor displays higher basal activity than the GLP-1 receptor but does not recruit GRK2 or arrestin3 effectively. Plos One 9(9):e106890. [DOI] [PMC free article] [PubMed] [Google Scholar]
- 59.Audet N, et al. (2008) Bioluminescence resonance energy transfer assays reveal ligand-specific conformational changes within preformed signaling complexes containing delta-opioid receptors and heterotrimeric G proteins. J Biol Chem 283(22):15078–15088. [DOI] [PMC free article] [PubMed] [Google Scholar]
- 60.Cevheroglu O, Becker JM, & Son CD (2017) GPCR-G alpha protein precoupling: Interaction between Ste2p, a yeast GPCR, and Gpalp, its G alpha protein, is formed before ligand binding via the Ste2p C-terminal domain and the Gpalp N-terminal domain. Bba-Biomembranes 1859(12):2435–2446. [DOI] [PubMed] [Google Scholar]
- 61.Zhu YP, Zhang L, Zhang XJC, & Zhao YF (2017) Structural dynamics of G(i)alpha protein revealed by single molecule FRET. Biochem Biophys Res Commun 491(3):603–608. [DOI] [PubMed] [Google Scholar]
- 62.Donnelly D (2012) The structure and function of the glucagon-like peptide-1 receptor and its ligands. Br J Pharmacol 166(1):27–41. [DOI] [PMC free article] [PubMed] [Google Scholar]
- 63.Singh N & Warshel A (2010) Absolute binding free energy calculations: on the accuracy of computational scoring of protein-ligand interactions. Proteins 78(7):1705–1723. [DOI] [PMC free article] [PubMed] [Google Scholar]
- 64.Thomas TC, Schmidt CJ, & Neer EJ (1993) G-protein alpha o subunit: mutation of conserved cysteines identifies a subunit contact surface and alters GDP affinity. Proc Natl Acad Sci U S A 90(21):10295–10299. [DOI] [PMC free article] [PubMed] [Google Scholar]
- 65.Iiri T, Herzmark P, Nakamoto JM, van Dop C, & Bourne HR (1994) Rapid GDP release from Gs alpha in patients with gain and loss of endocrine function. Nature 371(6493):164–168. [DOI] [PubMed] [Google Scholar]
- 66.Oldham WM & Hamm HE (2008) Heterotrimeric G protein activation by G-protein-coupled receptors. Nat Rev Mol Cell Biol 9(1):60–71. [DOI] [PubMed] [Google Scholar]
- 67.Hamm HE (1998) The many faces of G protein signaling. Journal of Biological Chemistry 273(2):669–672. [DOI] [PubMed] [Google Scholar]
- 68.De Lean A, Stadel JM, & Lefkowitz RJ (1980) A ternary complex model explains the agonist-specific binding properties of the adenylate cyclase-coupled beta-adrenergic receptor. J Biol Chem 255(15):7108–7117. [PubMed] [Google Scholar]
- 69.Mahoney JP & Sunahara RK (2016) Mechanistic insights into GPCR-G protein interactions. Curr Opin Struc Biol 41:247–254. [DOI] [PMC free article] [PubMed] [Google Scholar]
- 70.Miszta P, et al. (2018) GPCRM: a homology modeling web service with triple membrane-fitted quality assessment of GPCR models. Nucleic Acids Res 46(W1):W387–W395. [DOI] [PMC free article] [PubMed] [Google Scholar]
- 71.Gurevich VV & Gurevich EV (2017) Molecular Mechanisms of GPCR Signaling: A Structural Perspective. Int J Mol Sci 18(12). [DOI] [PMC free article] [PubMed] [Google Scholar]
Associated Data
This section collects any data citations, data availability statements, or supplementary materials included in this article.