Abstract
We studied fluorescence resonance energy transfer between donors and acceptors bound to double-helical DNA. The donor Hoechst 33258 binds to the minor groove of DNA and the acceptor propidium iodide (PI) is an intercalator. The time-resolved donor decays were measured in the frequency domain. The donor decays were consistent with a random 1-dimensional distribution of acceptors. The decays were analyzed in terms of three 1-dimensional models: a random continuous acceptor distribution; acceptors placed on discrete lattice sites; and a cylindrical model with the acceptor in the center, and the donors on a cylinder surface. The data were well described by all three models. Interpretation in terms of continuous distribution of acceptors revealed a minimum donor to acceptor distance of 13 Å, which is 3 bp from the center of Hoechst 33252. These results suggest that PI is excluded from the 4 bp covered by Hoechst 33252 when it is bound to the minor groove of DNA.
Keywords: donor, acceptor, fluorescence resonance energy transfer, double-helical DNA
INTRODUCTION
Since publication of the classic reviews by Stryer and Haugland,1,2 resonance energy transfer (RET) has been extensively used to study the structure of biological macromolecules. Many of the RET studies have focused on protein structure.3–5 In recent years there have been numerous studies of DNA using RET.6 These studies include distance distributions between the ends of DNA oligomers7 and the distances between terminal sites on three-way and four-way DNA junctions.8–10
These previous studies of RET in DNA measured the distances between specific sites on the DNA molecule. In the present report we describe a different type of experiment, which is RET between dyes bound noncovalently to DNA. In this case one needs to consider the presence of multiple acceptors distributed along the DNA helix, rather than just one or two acceptors at specific sites. Additionally, one needs to consider the dimensionality of the donor (D) and acceptor (A) distribution, which in the case of DNA is expected to be close to 1 dimensional. Relatively few reports appeared on this topic. One-dimensional energy transfer was previously reported from ethidium bromide to an intercalating acceptor11 and for a number of D–A pairs bound to double-helical DNA.12 We now describe an extension of these reports to include interpretation of these data in terms of lattice and cylindrical geometric models and the minimum distance between donors and acceptors when bound to DNA.
MATERIALS AND METHODS
Calf thymus DNA (CT-DNA) was obtained from Sigma. Hoechst 33258 (Ho) and propidium iodide (PI) were obtained form Molecular Probes and were used as the donor and acceptor, respectively. All the experiments were carried out at room temperature in 10 mM Tris-HCl buffer (pH 7.5) containing 100 mM NaCl. The CT-DNA was used without further purification and without sonication. The concentrations of DNA and Ho were quantified spectroscopically by using a molar extinction coefficient of 13,300 cm−1 M−1 (expressed as base pairs, bp) at 260 nm and 40,000 cm−1 M−1 at 352 nm, respectively. The CT-DNA concentration was 200 μM (bp), and the Ho concentration was 4 μM. The Ho showed a strong A-T specific binding with an intense increase of fluorescence.13 The concentrations of PI were determined by weight and were 2, 10, 20, 30, 40, and 50 μM. There could be free PI molecules in the samples with the high PI concentrations; however, all the PI molecules were bound to DNA in the lower concentrations of PI that were 2–20 μM).
The steady-state and frequency-domain (FD) fluorescence measurements were both carried out in 2-mm quartz cuvettes. The FD measurements were performed using a previously described instrument.14,15 The excitation source was the cavity-dumped output of a synchronously pumped pyridine-2 dye laser, generating a laser pulse train with a repetition rate at 3.81 MHz and a pulse width of about 7 ps. The dye laser output was frequency doubled to 350 nm and used to directly excite the samples, and the donor emission was isolated using a 450-nm interference filter.
THEORY
Multiexponential Donor Decays
The fluorescence intensity decay of most biological macromolecules is more complex than a single exponential. In these cases one typically represents the decay I(t) in terms of the multiexponential model
| (1) |
where I0 is the intensity at t = 0, αi is the initial amplitudes of the intensity decays associated with the individual decay times τi, and ϕi(t) is the fluorescence decay functions of the particular components. The αi are normalized so that Σαi = 1. In the absence of acceptors
| (2) |
and then eq. (1) simplifies to
| (3) |
which is the usual multiexponential decay model. Equation (3) is used to recover the lifetimes τi and the amplitudes αi from the unquenched fluorescence decay. The fractional contribution of each decay time component to the steady-state intensity is expressed as
| (4) |
and the mean decay time is given by
| (5) |
RET in 1 Dimension
RET is a result of the distance-dependent interaction that occurs between an excited donor molecule and an unexcited acceptor molecule. The most important interaction of this kind is the Coulombic dipole–dipole interaction for which the bimolecular transfer rate k(r) depends on the sixth power of the donor–acceptor distance r16,17
| (6) |
where τ is the donor fluorescence lifetime in the absence of the acceptor and R0 is the Förster distance. We assume the Förster distance is the same for each intensity component and that the fluorescence decays of these components are dependent on the respective transfer rates ki(r) given by
| (7) |
In the energy transfer between the groove-bound donors and intercalated acceptors we need to consider the restricted geometric distributions of donors and acceptors. We assume that the donor concentration is low enough that the processes of donor–donor transfer can be neglected. The simplest model of this type assumes that acceptor molecules are distributed randomly on the axis of a 1-dimensional coordinate system with the excited donor molecule placed at the origin. We refer to this as the continuous model because the acceptors are randomly distributed at any point along the line and are not restricted to lattice sites along the DNA. Also, the minimum distance between the D and A is zero. The donor decay for the model is described by the equation18,19
| (8) |
where CA is the acceptor concentration (number of molecules per unit length) and C01 is the so-called critical concentration defined as C01 = (2R0)−1. One has to stress that eq. (8) was derived with the assumption that the interacting molecules have no dimensions, so one cannot evaluate the influence of the excluded volume around the donor on the observed fluorescence decays using this equation. This model does not consider the location of acceptors because in double-helical DNA they are distributed at random but distant sites.
The above model may not be adequate for the description of energy transfer between dye molecules bound to the DNA. In double-helical DNA the dye molecules are not totally randomly distributed along the DNA helix. Rather, they are bound to specific sites determined by the lattice structure of the DNA. When a donor is surrounded by acceptors that are randomly distributed on sites of a 1-dimensional lattice, Blumen and Manz20 showed that the intensity decays of the donor can be described as
| (9) |
where ρ is the density of the lattice points, λ = (t/τD)(R0/rmin)6, rmin denotes the minimum donor–acceptor distance, and γ(a, x) is the incomplete γ function. In the general case, when the lattice effects on the acceptor distribution are expected to take place, all significant terms of eq. (9) should be taken into account. Usually CA ≪ ρ; then the sum over k converges very rapidly and calculation of just several initial terms of the sum results in sufficiently precise evaluation of the donor fluorescence decay.
One can show that eq. (8) can be obtained from eq. (9) by assuming rmin = 0 and taking into account only the first term (for k = 1) of the infinite sum over k. If rmin > 0 then taking into account just the first term of the sum is tantamount to the assumption that the acceptor molecules are randomly distributed without lattice restrictions in the interval (rmin, ∞). Then eq. (9) yields
| (10) |
This equation describes the intensity decay for a 1-dimensional continuous random distribution of acceptors without discrete lattice sites, starting at a distance r = rmin.
One can also consider the known binding sites of Ho and 7-aminoactinomycin D (Aad) on the DNA. The Aad molecules are intercalators and can be placed on the axis of the DNA helix. The Ho molecules bind to the minor grove and are slightly dislocated from the central axis toward the surface of the helix.21 To properly analyze the energy transfer of such a system, one should use a model that accounts for the distance of the donor molecules from the helix axis. This is possible using a cylindrical model in which we assumed that donor molecules are placed on the surface of the infinite cylinder of the radius R and the acceptors are randomly distributed along the axis of the cylinder. For this case, using the formalism described in Blumen and Klafer,22 the following equation may be obtained for the donor fluorescence decay ϕi(t):
| (11) |
where z is the distance along the cylinder axis. As for the derivation of eqs. (8) and (9), we assumed here that the donor concentration is low enough to assume that the processes of donor–donor transfer are negligible. Because the donor–acceptor distance cannot be less than R, one can expect that the results given by eq. (11) would be similar to those obtained from eq. (10). The disadvantage of this model is that it does not allow for an excluded region under the donor molecule.
In this work we compared the measured fluorescence decays with the decays predicted by eqs. (8)–(11) to obtain information about the spatial distribution of the intercalated and groove-bound molecules on the DNA. We also studied to what degree the dimensionality of the system is demonstrated in our experimental data. We found that all of the above 1-dimensional models were able to describe the data, but the model leading to eq. (9) seemed to be the best. To determine whether the data could be described by a 2- or 3-dimensional model, we chose 2- and 3-dimensional analogs of eq. (9), which are given by the following equations for the 2-dimensional system:
| (12) |
where . For the 3-dimensional system,
| (13) |
where . These equations can be obtained based on the general solution given in Blumen and Manz.20 One can also show that eq. (13) is consistent with the expression for the ensemble averaged transfer rate in 3 dimensions referred to in Butler and Pilling.23
Analysis of FD Data
Using the technique of FD fluorometry,14,15 one can compare the experimental phase (ϕω) and modulation (mω) values with those calculated (c) from the model intensity decay [I(t)]. At a given modulation frequency (ω) these values are given by
| (14) |
| (15) |
where
| (16) |
| (17) |
| (18) |
The best fitted parameters (Förster radius or acceptor concentrations) and the goodness of fit parameter were determined by the minimum value of
| (19) |
where ϕω and mω are the experimental phase and modulation, respectively; δϕ and δm are the experimental uncertainties; SSR is the sum of the squared residuals; and v is the number of degrees of freedom. The values of δϕ and δm are the experimental uncertainties (noise) in the phase and modulation measurements. The weighted residuals are calculated for phase and modulation data as
| (20) |
respectively.
RESULTS
Description of Experimental System
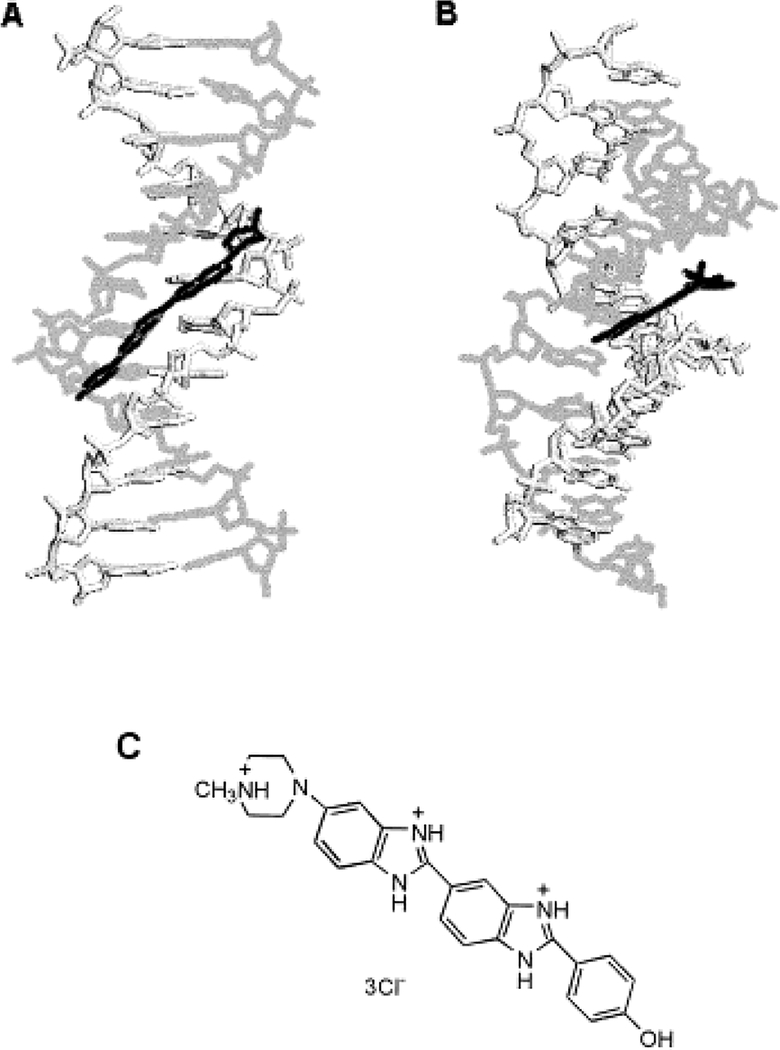
Figure 1 shows the expected geometries of Ho and PI bound to double-helical DNA. The Ho is bisbenzimide dye that is approximately 3 Å in width and 19 Å in length.21,24 The complex of DNA and Ho has several binding modes, depending on the ratio of DNA and Ho. At the low concentrations of Ho used in this study, Ho shows a strong and A-T specific binding with an intense increase in fluorescence. The Ho binding site is in the minor groove and requires 4–5 bp of DNA.25,26 The Ho in the minor groove region is located in the deeper portion between the DNA double helix, and the distance between the center of the Ho and axis of the DNA helix is almost 4 Å.21,24 The PI is a phenanthridinium intercalator.27 The intercalation of PI may be to any of the DNA, and it seems probable that PI will not bind to regions already bound to Ho. Assuming Ho and PI do not bind to the same base pairs, then the minimal distance between the centers of Ho and PI is calculated to be near 12 Å from the sizes of Ho and each DNA base pair.
Figure 1.
A depiction of the complex of DNA helix (gray) and Ho (black) with (A) the view looking into the minor groove direction and (B) the complex rotated 90°; (C) the structure of the Hoechst 33258 donor. The intercalation of PI may be to any of the DNA sites without bound Ho.
Steady-State Spectral Properties
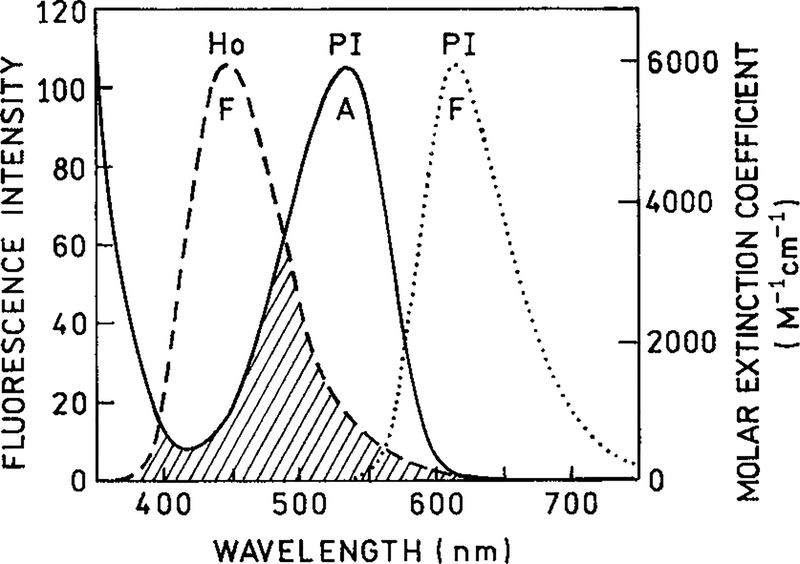
Absorption and emission spectra of the donor and acceptor are shown in Figure 2. The emission of Ho overlaps with the absorption spectrum of PI. These spectra were used to calculate the Förster distance for the RET. The quantum yield of the donor was taken as 0.53, which was measured relative to coumarin 1 with a quantum yield of 0.73.28 The κ2 value was 1.25. This value was used previously for RET between DNA-bound fluorophores12 rather than the usual value of 0.667 for the isotropic dynamic limit. The refractive index was taken as 1.5, which is intermediate between that of water 1.33 and 1.75, and is the consensus value for the interior of DNA.29 These assumed values led to an R0 of 35.7 Å.
Figure 2.
The fluorescence emission (F) and absorption spectra (A) of DNA complexes of Ho and PI. The fluorescence emission spectra were excited at their absorption maxima. The spectral overlap, illustrated by the area with oblique lines, was used to calculate the Förster distance (35.7 Å).
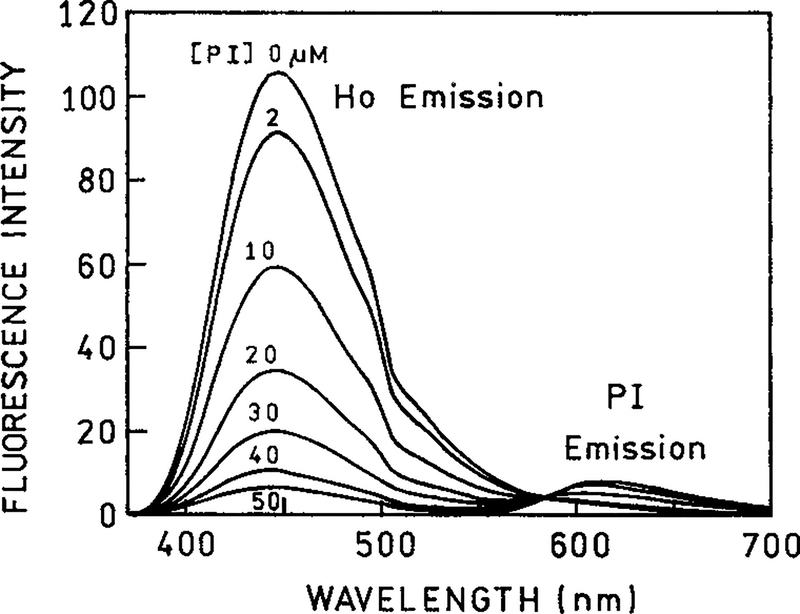
The emission spectra of DNA containing both Ho and PI are shown in Figure 3. The concentration of Ho and DNA were constant at 4 and 200 μM DNA, respectively, which was measured as base pairs. As the concentration of PI is increased the intensity of Ho decreases. One also observes increasing emission from the PI acceptor centered near 610 nm.
Figure 3.
The fluorescence emission spectra of DNA-bound Ho in the absence and presence of PI. The concentrations of PI were 2, 10, 20, 30, 40, and 50 μM. The excitation wavelength was 350 nm.
Time-Resolved Donor Decays
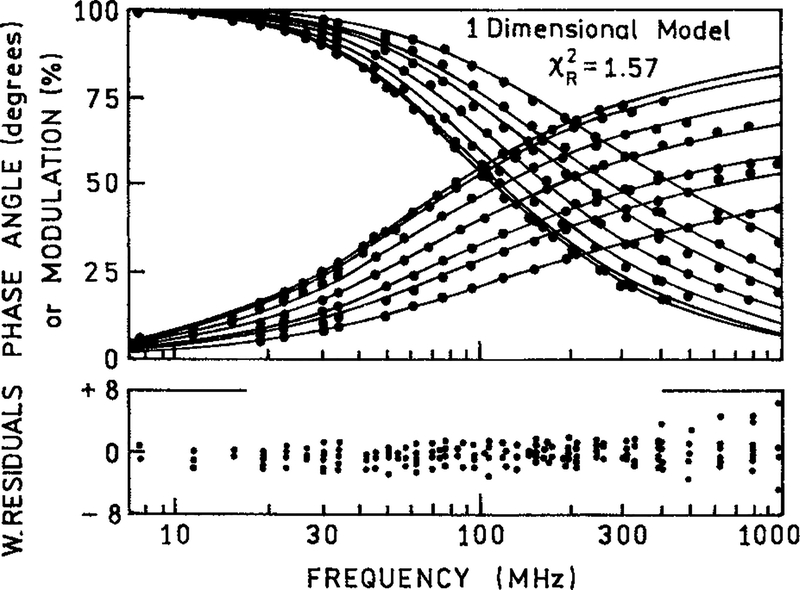
The donor intensity decays were measured using the FD method. The dots in Figure 4 show the measured phase and modulation values for Ho for a number of acceptor concentrations. As the acceptor concentration increases, the frequency responses shift to higher modulation frequency, which indicates a decrease in the mean decay time. Examination of Figure 4 shows that the intensity decay becomes visually more heterogeneous at higher acceptor concentrations. This occurs because a distribution of donor to acceptor distances results in a wider range of donor decay times.
Figure 4.
The frequency-domain phase and modulation of DNA-bound Ho in the absence and presence of PI with various concentrations (2, 10, 20, 30, 40, and 50 μM). The frequency-domain intensity decays were analyzed using the 1-dimensional model [eqs. (1) and (10)] and fitting the (—) acceptor concentrations. In the analysis we used a Förster distance of 35.7 Å and a minimal donor–acceptor distance of 12 Å. The lower panel shows weighted residues for phase and modulation [see eq. (20)].
These FD data were analyzed in terms of the multiexponential model (Table I). In the absence of the acceptor the Ho displays a double exponential decay with a mean decay time of 2.47 ns. The mean decay time decreases to 0.78 ns at 50 μM PI. The extent of heterogeneity in the donor decay can be recognized by the values for the single decay time fit. This value increases to 36.9 in the absence of acceptor to 1564 with 50 μM PI. Such larger values indicate an extremely heterogeneous donor decay. Because of this heterogeneity, three decay times were needed to fit the data for PI concentrations above 2 μM.
Table I.
Multicomponent Analysis of DNA-Bound Donor Intensity Decays
| 1 Component | 2 Components | 3 Components | ||||||||
|---|---|---|---|---|---|---|---|---|---|---|
| Acceptor Concn | τi | fi | τi (ns) | fi | τi (ns) | fi | ||||
| 0 mM | 2.33 | 1.00 | 36.9 | 2.53 | 0.81 | 1.64 | 2.28 | 0.68 | 2.47 | 1.53 |
| (no acceptor) | — | — | 0.51 | 0.19 | 0.31 | 0.18 | ||||
| — | — | — | — | 3.34 | 0.14 | |||||
| 2 μM | 2.15 | 1.00 | 99.5 | 2.41 | 0.75 | 2.91 | 2.45 | 0.66 | 2.30 | 3.81 |
| — | — | 0.34 | 0.25 | 0.33 | 0.25 | |||||
| — | — | — | — | 1.80 | 0.09 | |||||
| 10 μM | 1.69 | 1.00 | 374 | 2.23 | 0.55 | 4.50 | 2.34 | 0.94 | 2.05 | 2.47 |
| — | — | 0.35 | 0.45 | 0.003 | 0.04 | |||||
| — | — | — | — | 0.67 | 0.02 | |||||
| 20 μM | 1.17 | 1.00 | 727 | 0.30 | 0.56 | 11.9 | 0.13 | 0.38 | 1.64 | 1.06 |
| — | — | 1.84 | 0.44 | 0.71 | 0.34 | |||||
| — | — | — | — | 2.15 | 0.28 | |||||
| 30 μM | 0.75 | 1.00 | 1635 | 0.17 | 0.70 | 31.8 | 0.08 | 0.62 | 1.33 | 1.56 |
| — | — | 1.49 | 0.30 | 0.60 | 0.24 | |||||
| — | — | — | — | 1.96 | 0.14 | |||||
| 40 μM | 0.57 | 1.00 | 1383 | 0.14 | 0.76 | 16.5 | 0.10 | 0.61 | 1.06 | 1.42 |
| — | — | 1.32 | 0.24 | 0.50 | 0.26 | |||||
| — | — | — | — | 1.67 | 0.13 | |||||
| 50 μM | 0.34 | 1.00 | 1564 | 0.11 | 0.85 | 19.8 | 0.06 | 0.77 | 0.78 | 1.69 |
| — | — | 1.08 | 0.15 | 0.40 | 0.17 | |||||
| — | — | — | — | 1.48 | 0.06 | |||||
(ns), mean lifetime.
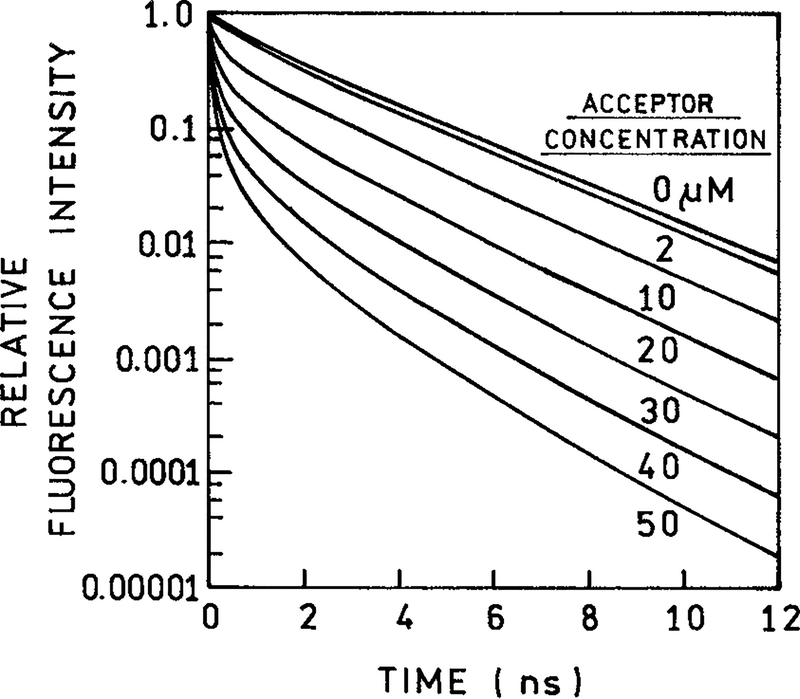
It is interesting to examine the intensity decays in the time domain (Fig. 5). The intensity decays were reconstructed using the best fits of the 1-dimensional lattice model (Fig. 4). This analysis is described below. The intensity decay of the donor alone is typical of a moderately heterogeneous biochemical fluorophore. Binding of PI to the DNA results in a strongly heterogeneous decay (Fig. 5). These decays show a rapid decrease in intensity with short periods of time, followed by a slower decay with longer times. This form of intensity decay is characteristic of 1-dimensional distribution of donors and acceptors,11,19 which results in a t1/6 term in the intensity decay [eq. (10)].
Figure 5.
The recovered time-resolved decays of donor fluorescence in the absence and presence of acceptor (PI) calculated from eqs. (1) and (10) using the recovered values of the parameters. The concentrations of PI were 0, 2, 10, 20, 30, 40, and 50 μM.
1-Dimensional RET Models
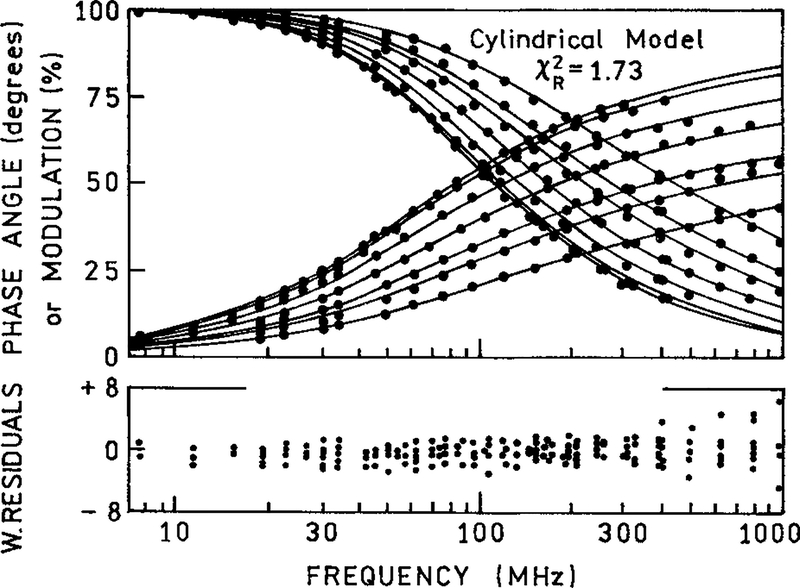
The donor decays were analyzed in terms of the three models: the 1-dimensional model [eq. (8)], the cylindrical model [eq. (11)], and the 1-dimensional model with an excluded region under the donor [eq. (10)]. Roughly equivalent fits were obtained for all three models. The best fit was obtained for the continuous model with an excluded region [eq. (10)], yielding a of 1.57 (Fig. 4). The continuous model with no excluded region [eq. (8)] yielded a of 1.66 (not shown), and the cylindrical model resulted in a of 1.73 (Fig. 6).
Figure 6.
The frequency-domain phase and modulations of DNA-bound Ho in the absence and presence of PI with various concentrations (2, 10, 20, 30, 40, and 50 μM). The frequency-domain intensity decays were analyzed using the cylindrical model [eqs. (1) and (11)] and fitting the (—) acceptor concentrations. In the analysis we used a Förster distance of 35.7 Å and a cylinder radius of 4 Å. The lower panel shows weighted residuals for phase and modulation [see eq. (20)].
The complete lattice model [eq. (10)] provided a marginally better fit than the cylindrical model ( = 1.57 vs. 1.73). The ratio of the values is 1.102. With our approximate 230 degrees of freedom an elevation in the of 10% is expected to occur only 20% of the time because of statistical variations in the data.19 For this reason we accept eq. (10) as providing the best description of the data. However, in our opinion a 20% probability is too low and we cannot state with confidence that our data exclude the cylindrical model [eq. (12)].
One can also use the intensity decay data and the known acceptor concentrations to calculate the Förster distance (R0). These values are summarized in Table II. One notices that all the models give similar R0 values, but these are all somewhat smaller than the calculated value of 35.7 Å. At present we do not understand the reason for the discrepancy. One possibility is that these actual acceptor concentrations are larger than used in the calculations, resulting in a smaller apparent R0 value.
Table II.
Förster Distance Calculated from Spectral Parameters and Recovered from Donor Intensity Decays
| Calcd. Values | Models and Recovered Values | ||||
|---|---|---|---|---|---|
| 1-D Model [Eq. (9)] | Cylindrical Model [Eq. (11)] | ||||
| 1 Term | 2 Terms | 3 Terms | |||
| Förster distances (Å) | 35.7 | 32.6 | 31.3 | 31.2 | 32.8 |
| — | 1.58 | 1.69 | 1.71 | 2.17 | |
The recovered R0 values were calculated using the donor intensity decay data with lower concentrations of PI (1, 5, and 10 μM).
We also used the analysis to recover the acceptor concentrations (Table III). These analyses were performed with an R0 fixed at 35.7 Å and the acceptor concentrations as variable parameters. When analyzed in terms of RET in 3 or 2 dimensions, the analysis recovered physically unrealistic values for the acceptor concentrations. In contrast, the 1-dimensional lattice [eq. (10)] and cylindrical [eq. (11)] models resulted in acceptor concentrations (in acceptors/base pairs) that were in precise agreement with the values expected for our preparation procedures. All three 1-dimensional models were roughly equivalent in returning the expected acceptor concentrations.
Table III.
Recovered Acceptor Concentrations from Donor Intensity Decays
| Measured Values from Volume | Lattice Model [Eq. (10)] (Acceptors/bp) | 2-D Model [Eq. (12)] (Acceptors/cm2) | 3-D Model [Eq. (13)] (mM) | Cylindrical Model [Eq. (11)] (Acceptors/bp) | ||
|---|---|---|---|---|---|---|
| μM | (Acceptors/bp) | |||||
| 2 | 0.01 | 0.01 | 0.3 × 10¹² | 0.61 | 0.01 | |
| 10 | 0.05 | 0.05 | 1.3 × 10¹² | 2.74 | 0.05 | |
| 20 | 0.10 | 0.09 | 2.6 × 10¹² | 5.81 | 0.09 | |
| 30 | 0.15 | 0.14 | 4.3 × 10¹² | 10.1 | 0.14 | |
| 40 | 0.20 | 0.18 | 5.4 × 10¹² | 13.1 | 0.17 | |
| 50 | 0.25 | 0.24 | 7.9 × 10¹² | 19.8 | 0.24 | |
| — | 1.57 (7.80a) | 10.5 | 35.4 | 1.73 (11.2a) | ||
In the analysis of frequency-domain intensity decays to recover acceptor concentrations, the input parameters are t; bp length = 3.4 Å; R0 (Förster distance) = 35.7 Å; rmin = 12 Å in the 1-, 2-, and 3-D models; and R = 4 Å in the cylindrical model.
These are the values before the data fit to the acceptor concentrations in each model.
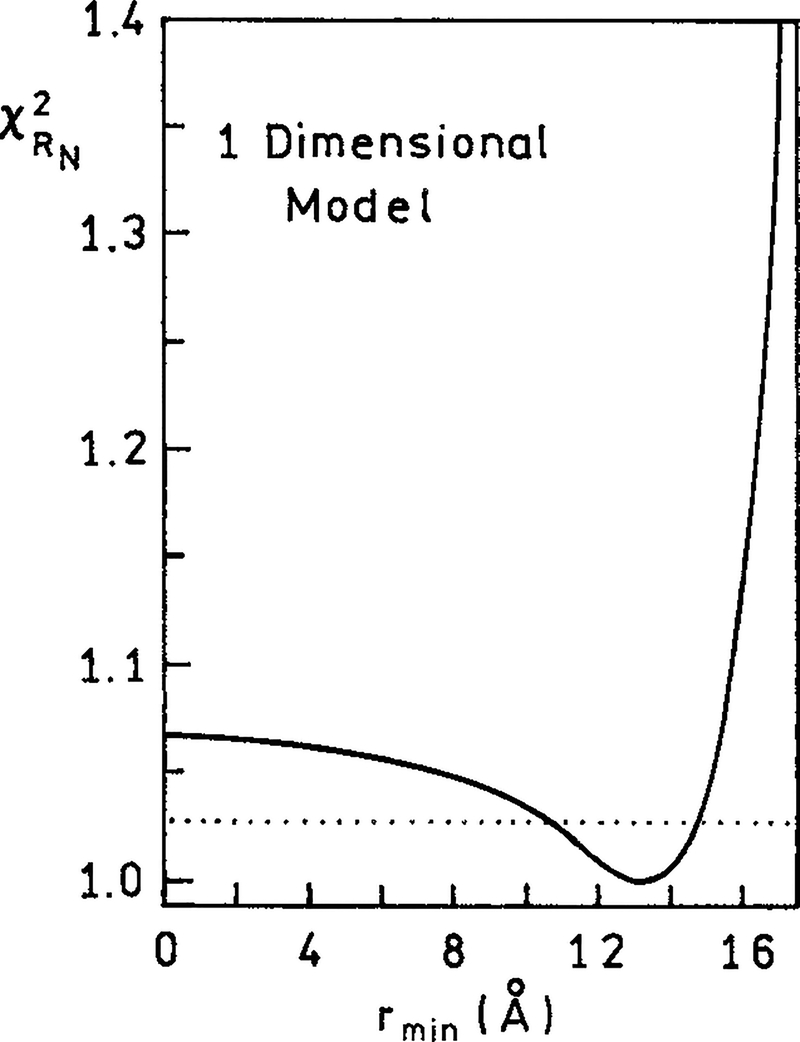
We used the continuous model [eq. (10)] to estimate the distance of the closest D to A approach. This was accomplished by examining the surface for the value of rmin (Fig. 7). The surface is determined by holding rmin at a fixed value and minimizing with the acceptor concentrations as variable parameters. The value is minimal near 13–14 Å ( = 1.56 at 13 Å). This value agrees with the calculated minimum distance of 12 Å from the known sizes of Ho and the DNA base pairs. The confidence limit on rmin can be estimated from the interaction of the surface with the values calculated from19
| (21) |
In this expression v is the number of degrees of freedom, p is the number of variable parameters (six acceptor concentrations), and P is the probability for a range of 1 standard deviation (P = 0.32). For our conditions [F (p, υ, P) = 1.17 and n = 200] one finds Fx = 1.03. Hence, the values of rmin are within the range of 11–15 Å. This value is consistent with the closest PI binding site being 3 bp from the center of Ho.
Figure 7.
The χ2/(minimal χ2) recovered from the 1-dimensional model, depending on the variable values of the minimal donor–acceptor distance (rmin). (⋯) The confidence interval for rmin was calculated using an F statistic (1.028). In the analysis we used eq. (10) and a Förster distance of 35.7 Å.
SUMMARY
We examined time-resolved energy transfer between donors and acceptors bound to double-helical DNA. Least squares analysis of the data demonstrated that the data contained information about the minimum donor–acceptor distance. However, the data were not adequate to unequivocally select between a continuous and discrete distribution of acceptors in the DNA helix. Because binding of the Ho donor to DNA is specific for A-T base pairs, these results suggest that the time-resolved RET data should provide information on the random or nonrandom distribution of donors and acceptors along DNA with defined sequences.
Acknowledgments
Contract grant sponsor: NIH; contract grant numbers: GM-35154, RR-08119.
REFERENCES
- 1.Stryer L Annu Rev Biochem 1978, 47, 819–846. [DOI] [PubMed] [Google Scholar]
- 2.Stryer L; Haugland RP Proc Natl Acad Sci 1967, 58, 719–726. [DOI] [PMC free article] [PubMed] [Google Scholar]
- 3.Cheung HC In Topics in Fluorescence Spectroscopy; Lakowicz JR, Ed.; Plenum: New York, 1991; Vol. 2, pp 127–176. [Google Scholar]
- 4.Wu P; Brand L Anal Biochem 1994, 218, 1–13. [DOI] [PubMed] [Google Scholar]
- 5.Dos Reedits CG; Mens PD J. J Struct Biol 1995, 115, 175–185. [DOI] [PubMed] [Google Scholar]
- 6.Yang M; Millar DP Methods Ensemble 1997, 278, 417–444. [DOI] [PubMed] [Google Scholar]
- 7.Hochstrasser RA; Chen S-M; Millar DP Biophys Chem 1992, 45, 133–141. [DOI] [PubMed] [Google Scholar]
- 8.Eis PS; Millar DP Biochemistry 1993, 32, 13852–13860. [DOI] [PubMed] [Google Scholar]
- 9.Clegg RM; Murchie AIH; Lilley DM Biophys J 1994, 66, 99–109. [DOI] [PMC free article] [PubMed] [Google Scholar]
- 10.Yang M; Millar DP Biochemistry 1996, 35, 7959–7967. [DOI] [PubMed] [Google Scholar]
- 11.Mergny J-L; Slama-Schwok A; Montenay-Garestier T; Rougee M; Helene C Photochem Photobiol 1991, 53, 555–558. [DOI] [PubMed] [Google Scholar]
- 12.Maliwal BP; Kusba J; Lakowicz JR Biopolymers 1995, 35, 245–255. [DOI] [PubMed] [Google Scholar]
- 13.Stokke T; Steen HB J Hist Cytol 1985, 33, 333–338. [DOI] [PubMed] [Google Scholar]
- 14.Laczko G; Gryczynski I; Wiczk W; Malak H; Lakowicz JR Rev Sci Instrum 1990, 61, 2331–2337. [Google Scholar]
- 15.Lakowicz JR; Gryczynski I In Topics in Fluorescence Spectroscopy; Lakowicz JR, Ed.; Plenum: New York, 1991; Vol. 1, p 293. [Google Scholar]
- 16.Förster T Ann Phys 1948, 2, 55–75. [Google Scholar]
- 17.Van Der Meer B. Wieb Resonance Energy Transfer, Theory and Data; Wiley–VCH: New York, 1991; p 177. [Google Scholar]
- 18.Hauser M; Klein UKA; Gösele U Z Phys Chem Neue Folge 1976, 101, 255–266. [Google Scholar]
- 19.Lakowicz JR Principles of Fluorescence Spectroscopy, 2nd ed.; Kluwer Academic/Plenum: New York, 1999; p 698. [Google Scholar]
- 20.Blumen A; Manz J J Chem Phys 1979, 71, 4696–4702. [Google Scholar]
- 21.Teng MK; Usman N; Frederick CA; Wang AH Nucl Acids Res 1988, 16, 2671–2690. [DOI] [PMC free article] [PubMed] [Google Scholar]
- 22.Blumen A; Klafer J J Chem Phys 1986, 84, 1397–1401. [Google Scholar]
- 23.Butler PR; Pilling M J Chem Phys 1979, 41, 239–243. [Google Scholar]
- 24.Pjura PE; Grzeskowiak K; Dickerson RE J Mol Biol 1987, 197, 257–271. [DOI] [PubMed] [Google Scholar]
- 25.Stokke T; Steen HB J Histochem Cytochem 1985, 33, 333–338. [DOI] [PubMed] [Google Scholar]
- 26.Loontiens FG; Regenfuss P; Zechel A; Dumortier L; Clegg RM Biochemistry 1990, 29, 9029. [DOI] [PubMed] [Google Scholar]
- 27.Prosperi E; Giangare MC; Bottiroli G Histochemistry 1994, 102, 123. [DOI] [PubMed] [Google Scholar]
- 28.Jones G; Jackson WR; Choi C-Y; Bergmark WR J Phys Chem 1985, 89, 294. [Google Scholar]
- 29.Harrington RE J Am Chem Soc 1970, 92, 6957–6964. [DOI] [PubMed] [Google Scholar]


