Abstract
Background & objectives:
The haemoglobin (Hb) cut-off is a single value for all populations. It is possible that different populations might have slightly different cut-off values; but, this needs to be evaluated in healthy populations with low possibility of inadequate dietary intakes of haematopoietic nutrients. This study was conducted to assess the existence of race-specific Hb cut-offs for mild anaemia in healthy populations and their potential implications.
Methods:
In this study the Hb distributions of healthy White, Black, Mexican and Hispanic and Asian non-pregnant women obtained from nine rounds of the National Health and Nutrition Examination Survey (NHANES) and two rounds of National Diet and Nutrition Survey (NDNS), was examined to check the existence of race-specific Hb cut-off for mild anaemia, by standard statistical methods.
Results:
The mean Hb of Blacks, Mexicans and Hispanics and Asians were lower than Whites, consistent with previous literature. The Hb cut-off for mild anaemia in Asians was lower at 11.22 g/dl.
Interpretation & conclusions:
Using the Hb cut-off derived in this study in place of the World Health Organization, cut-off of 12 g/dl would result in a 17.9 per cent decrease in the prevalence of anaemia in India. This points to the need for re-examining race-specific cut-off for mild anaemia and points to the need for alternative methods, perhaps linked to risk of unhealthy outcomes.
Keywords: Mild anaemia, National Diet and Nutrition Survey, National Health and Nutrition Examination Survey, race-specific cut-off
India, though has achieved considerable progress in health indicators, such as the infant mortality rate and the prevalence of childhood stunting in the last decade1, one malnutrition indicator which has not changed for the better over the last decade has been the prevalence of anaemia in non-pregnant women. It is well known that anaemia is a multifactorial disease with environmental, dietary and biological risk factors. However, one important consideration is whether the global cut-off for anaemia proposed by the World Health Organization (WHO) is applicable for an Indian population since this was a statistical value based on limited studies chosen by the WHO Scientific Group for Nutritional Anaemias2.
Previous secondary statistical analyses on individual rounds of National Health and Nutrition Examination Survey (NHANES) indicated that haemoglobin (Hb) concentrations among healthy Asian, Hispanic and Black populations were lower when compared to White populations3,4,5. A comparison of race-specific Hb thresholds against the risk of mortality from NHANES III reported that the threshold below which risk increased was 1 g/dl lower in non-Hispanic Blacks as compared to non-Hispanic Whites and Mexican Americans5. This variability has also been observed among similar racial populations within the same country, for example, northern and southern Italian populations have different mean Hb concentrations, attributable to its heritability6. These findings suggest that the distribution of Hb and the statistical cut-off for mild anaemia needs evaluation in specific populations. This has significant public health implications, especially for India, where the magnitude of the estimated prevalence of anaemia could significantly reduce with a lower Hb cut-off. In the present study, data were pooled from multiple cross-sectional surveys conducted over two decades, to evaluate the appropriateness of universal cut-off for Hb across races in a sufficiently large sample of healthy populations.
Material & Methods
To estimate the distribution of Hb among different races, data on healthy adult women between the ages of 15 and 49 yr were pooled from nine rounds of NHANES (1999/2000 to 2015/2016) and five rounds of National Diet and Nutrition Survey (NDNS), UK (adults aged 19 to 64 yr, 2000-20017; years 1, 2, 3 and 4 of rolling programme, 2008/2009 to 2011/20128). The NHANES and NDNS data were downloaded from Centers for Disease Control and Prevention, USA (https://www.cdc.gov/nchs/nhanes/index.htm) and UK Data Service (https://ukdataservice.ac.uk/), respectively. The participants were classified as White, Black, Mexican/Hispanic and Asian based on available information. The definition of healthy adults was based on self-reported feelings of health status, as in previous studies3. If information on any group was inconclusive in a survey (e.g., non-Hispanic Asian were reported as ‘Other’ ethnicity for NHANES surveys before 2011-20129), data were not be pooled for that ethnicity from the survey. The category ‘Asian’ included South Asians, Chinese and other Asians. Individuals belonging to mixed-racial backgrounds were not included in the analysis. One survey (NDNS adults aged 19 to 64 yr, 2000-20017) did not contain any women below the age of 19. The same survey also did not contain information pertaining to self-reported health status. Women who reported their physiological status as pregnant were excluded from the analysis. Also excluded were all women whose Hb values were not recorded/measured. Both NHANES (https://wwwn.cdc.gov/nchs/data/nhanes/2017-2018/manuals/2017_MEC_Laboratory_Procedures_Manual.pdf) and NDNS7,10 used Beckman Coulter method for the estimation of Hb.
The Hb cut-off was defined based on the method2 used by the WHO technical group which defined the present cut-off value for mild anaemia11. Thus, the WHO cut-off for anaemia is defined as the value corresponding to the 4.95th percentile of a healthy reference population. This percentile value corresponds to the mean (−1.65×standard deviation) of the distribution for Hb concentrations. This cut-off corresponds to a value in the Hb distribution among normal population which will have <5 per cent of the Hb values to be abnormal. The cut-off was estimated separately for each ethnic group.
To evaluate the impact of a changed cut-off on anaemia prevalence, the National Family Health Survey (NFHS)1,12, was used. The fourth round of the survey (NFHS-4, 2015-2016)12 measured Hb using a HemoCue photometer system (Hb 201+) which used finger prick capillary blood samples in women of reproductive age (15-49 yr) and men (15-54 yr) in a subsample of the surveyed households.
Results
Laboratory and demographic data were available for 11,869 adult women between 15 and 49 yr of age (42% White, 27% Mexican/Hispanic, 22% Black and 5% Asian). The majority of the data (95%) came from the nine rounds of NHANES surveys, and 22 per cent of individuals reported ‘Excellent’ health, while 34 per cent reported their health as ‘Very good’. For the NDNS surveys, the highest measure of self-reported health was ‘Very good’.
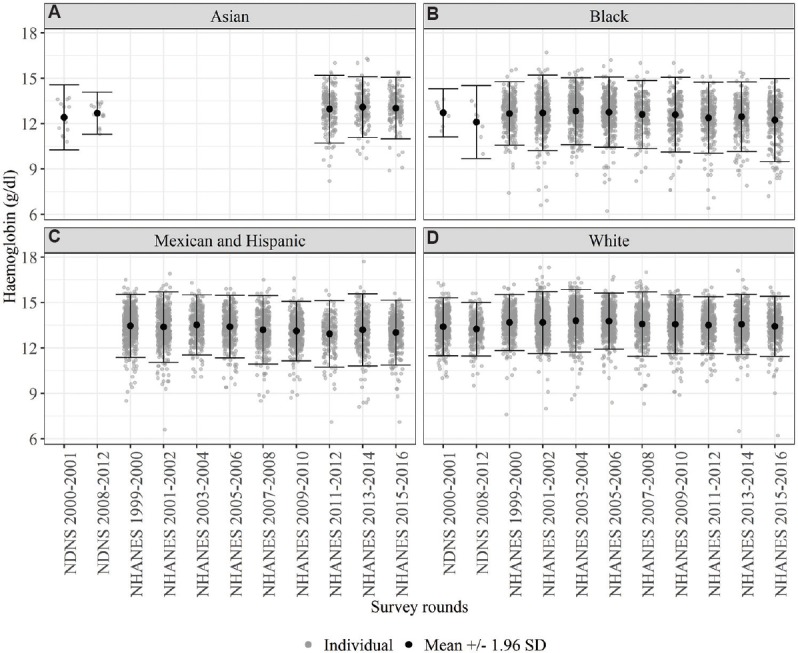
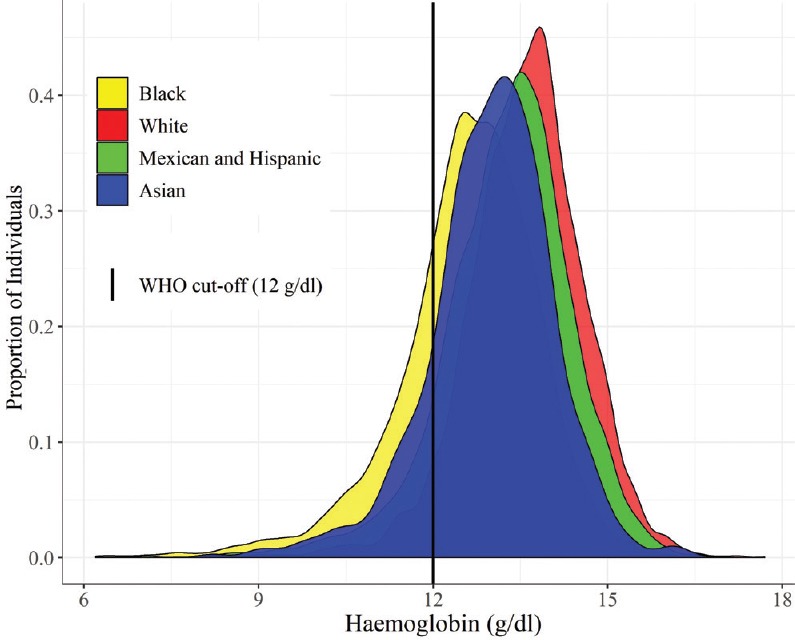
There was high consistency in Hb measurements of women (Fig. 1) who self-reported good health across surveys. Figure 2 shows the distribution of Hb (in g/dl) among non-pregnant women of different races. Based on the pooled analysis, the derived Hb cut-off for anaemia for the Whites was comparable to the WHO-recommended11 cut-point (11.9 vs. 12 g/dl, respectively) (Table I).
Fig. 1.

Distribution of haemoglobin across surveys by race legend: g/dl. NHANES, National Health and Nutrition Examination Survey; NDNS, National Diet and Nutrition Survey. Ranges of haemoglobin across different rounds of NHANES (9 rounds) and NDNS (2 rounds) for 4 ethinicities - (A) Asian, (B) Black, (C) Hispanic and Mexican and (D) White. The distribution of haemoglobin was consistent over time in a self-reported healthy population.
Fig. 2.

Distribution of haemoglobin by race (unweighted sample means for each round in black).
Table I.
Comparison of the haemoglobin cut-off for non-pregnant women in different races against WHO cut-off of 12 g/dl
| Race | n | Mean±SD (g/dl) | SE (g/dl) | Derived cut-off (g/dl) |
|---|---|---|---|---|
| White | 5231 | 13.59±1.01 | 0.014 | 11.92 |
| Black | 2707 | 12.60±1.21 | 0.023 | 10.60 |
| Mexican and hispanic | 3356 | 13.27±1.10 | 0.019 | 11.42 |
| Asian | 575 | 12.99±1.07 | 0.044 | 11.22 |
SD, standard deviation; SE, standard error; WHO, World Health Organization
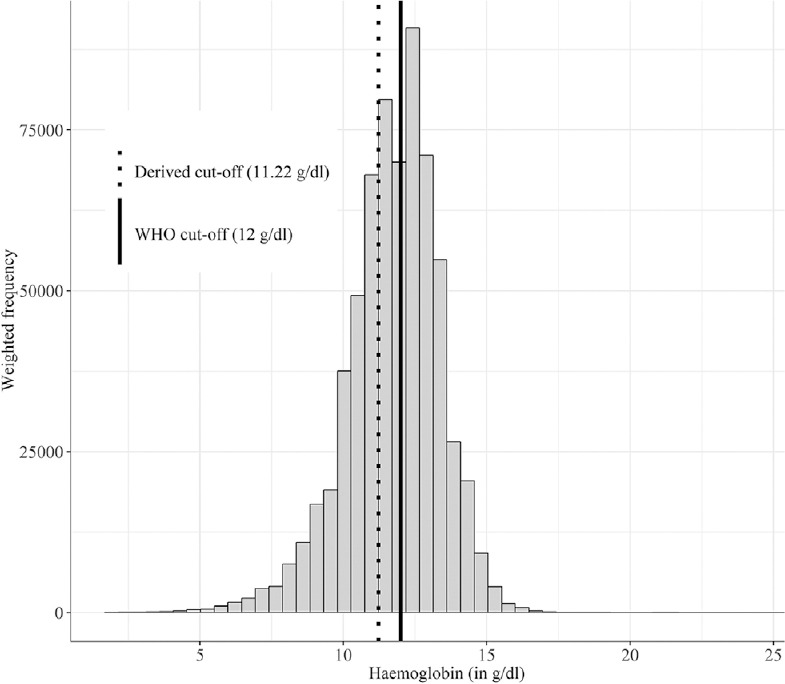
When the derived Hb cut-off value for Asian women, of 11.22 g/dl, was used to re-estimate the prevalence of anaemia from the recent NFHS-4 data, the average national prevalence decreased by 17.9 per cent (from 53.2 to 35.3%, Fig. 3). The most dramatic decrease in the prevalence was observed in Dadra and Nagar Haveli (22.9%) and West Bengal (21.2%) while regions such as Mizoram (11.4%), Nagaland (11.8%) and Manipur (12.4%) had a lower decrease in the prevalence.
Fig. 3.

Distribution of haemoglobin (g/dl) as a weighted histogram from National Family Health Survey-412 for non-pregnant women. Solid line is the present WHO cut-off, dotted line is the derived cut-off.
Discussion
This analysis pointed to the need to consider race-specific Hb cut-offs. For Mexican/Hispanic, Blacks and Asians, the derived Hb cut-off was lower than the WHO cut-off, with the Asian cut-off falling in-between that of Blacks and Mexican/Hispanic races. This was consistent with the previous studies which compared the Hb of Whites with Blacks4,13, Hispanics and Asians3. A study in an Indonesian population14 concluded that the WHO cut-offs were valid, and the estimated lower mean Hb was likely to be due to the incomplete exclusion of iron-deficient women.
Using the Hb cut-off defined for Asians in the present study to evaluate the prevalence of anaemia in the NFHS-4 data, the prevalence of anaemia was found to decline by about 17 per cent on average across the country. The decrease in prevalence was not uniform across States and districts; those regions which had a higher prevalence of mild anaemia would experience a relatively higher decrease in the prevalence. The Hb distribution in the top wealth decile of the Indian population (NFHS-4) was not comparable to that of the external data sets and suggested the probability of iron deficiency even in the affluent Indian population (Table II). Therefore, such a population cannot be used for dermining the Hb cut-off. However, this underlines the need to consider healthy populations from external datasets such as NHANES and NDNS, or specific prospective studies on the Indian diaspora residing in high-income countries, to explore possibilities of redefining the Hb cut-off.
Table II.
Summary of haemoglobin values of non-pregnant women for every decile as per wealth index
| Wealth decile | Mean±SD (g/dl) |
|---|---|
| 1 | 11.46±1.61 |
| 2 | 11.55±1.62 |
| 3 | 11.59±1.62 |
| 4 | 11.63±1.64 |
| 5 | 11.64±1.66 |
| 6 | 11.66±1.65 |
| 7 | 11.70±1.64 |
| 8 | 11.74±1.63 |
| 9 | 11.79±1.59 |
| 10 | 11.88±1.52 |
Source: www.dhsprogram.com
The present analysis had several limitations. First, self-reported status of health was used as an inclusion criterion. Additional analyses would be needed to ensure that there was no bias on racial lines when self-reporting health status since 93 per cent of Asians and 90 per cent of Whites in the eligible population reported good health in comparison to 83 per cent of Blacks and 76 per cent of Mexican/Hispanics. Second, the instruments used to measure Hb across different NHANES rounds would be different, and between-instrument variability (using cell counters) could account for difference in measurements. However, the distribution of Hb values was similar across rounds (Fig. 1); this limitation could be reasonably ignored. Third, carriers of thalassaemia were not excluded from this analysis due to unavailability of information from NHANES and NDNS rounds. Moreover, participants were not excluded based on low iron status, for example, through measurements of serum ferritin, transferrin saturation and zinc protoporphyrin concentrations.
It is evident from these analyses that additional biological characteristics and outcomes need to be evaluated when defining the Hb cut-off for anaemia and that the distribution of Hb in healthy adults may differ by race. This may be partly related to genetics since the heritability of Hb is responsible for a significant proportion of variation; one study showed that it was 0.34-0.426. It may also be due to a relatively lower skeletal muscle mass, which is common in Indians15, and has been shown to be associated with anaemia in the elderly16. It could also point to genetic stress exerted by haemoglobinopathies such as thalassaemia, which is known to be prevalent in parts of the India. This is in addition to many other potential modifiable sources of variation in Hb including dietary intake of haemetenic nutrients, bioavailability of iron from habitual diets, prevalence of hookworm infection and malaria. This points to the need to consider other methods of defining the cut-off, perhaps linked to risk and unhealthy outcomes5. While the burden of anaemia remains significant over the last decade, possibly related to inaccuracies in the method of measurement of Hb, it seems reasonable to question if the magnitude of the unchanging burden of anaemia among Indian women is due additionally to the anaemia cut-off based on the current methods.
Acknowledgment:
Authors acknowledge Dr H.P.S. Sachdev, Senior Consultant, Pediatrics and Clinical Epidemiology, Sitaram Bhartia Institute of Science and Research, New Delhi for helpful discussions.
Footnotes
Financial support & sponsorship: None.
Conflicts of Interest: None.
References
- 1.India: IIPS; 2017. International Institute for Population Sciences. National Family Health Survey (NFHS-4): Fact Sheet. [Google Scholar]
- 2.World Health Organization. Vol. 405. Geneva: World Health Organization; 1968. Nutritional anaemias. Report of a WHO group of experts. World Health Organization - Technical report series. [Google Scholar]
- 3.Lim E, Miyamura J, Chen JJ. Racial/Ethnic-specific reference intervals for common laboratory tests: A comparison among Asians, blacks, hispanics, and white. Hawaii J Med Public Health. 2015;74:302–10. [PMC free article] [PubMed] [Google Scholar]
- 4.Johnson-Spear MA, Yip R. Hemoglobin difference between black and white women with comparable iron status: Justification for race-specific anemia criteria. Am J Clin Nutr. 1994;60:117–21. doi: 10.1093/ajcn/60.1.117. [DOI] [PubMed] [Google Scholar]
- 5.Patel KV, Longo DL, Ershler WB, Yu B, Semba RD, Ferrucci L, et al. Haemoglobin concentration and the risk of death in older adults: Differences by race/ethnicity in the NHANES III follow-up. Br J Haematol. 2009;145:514–23. doi: 10.1111/j.1365-2141.2009.07659.x. [DOI] [PMC free article] [PubMed] [Google Scholar]
- 6.Sala C, Ciullo M, Lanzara C, Nutile T, Bione S, Massacane R, et al. Variation of hemoglobin levels in normal Italian populations from genetic isolates. Haematologica. 2008;93:1372–5. doi: 10.3324/haematol.12915. [DOI] [PubMed] [Google Scholar]
- 7.Office for National Statistics, Social and Vital Statistics Division, Food Standards Agency. National Diet and Nutrition Survey: Adults Aged 19 to 64 Years, 2000-2001. UK Data Service. SN: 5140. [accessed on January 15, 2018]. Available from: https://beta.ukdataservice.ac.uk/datacatalogue/studies/study?id=5140 .
- 8.NatCen Social Research, MRC Elsie Widdowson Laboratory. National Diet and Nutrition Survey Years 1-4, 2008/09-2011/12. UK Data Service. SN: 6533. 7th Ed. [accessed on October 15, 2016]. Available from: https://beta.ukdataservice.ac.uk/datacatalogue/studies/study?id=6533 .
- 9.Centers for Disease Control and Prevention. National Health and Nutition Examination Survey (NHANES) 2011-2012 overview. [accessed on January 15, 2018]. Available from: https://wwwn.cdc.gov/nchs/nhanes/ContinuousNhanes/Overview.aspx?BeginYear=2011 .
- 10.Public Health England and Food Standards Agency. Results of the National Diet and Nutrition Survey (NDNS) rolling programme for 2008 and 2009 to 2011 and 2012. [accessed on January 15, 2018]. Available from: https://www.gov.uk/government/statistics/national-dietand-nutrition-survey-results-from-years-1-to-4-combined-ofthe-rolling-programme-for-2008-and-2009-to-2011-and-2012 .
- 11.World Health Organization. Geneva: WHO; 2011. Haemoglobin concentrations for the diagnosis of anaemia and assessment of severity: Vitamin and mineral nutrition information system; WHO reference No. WHO/NMH/NHD/MNM/11.1. [Google Scholar]
- 12.Mumbai: International Institute for Population Sciences; 2014. Indian Institute for Population Sciences. National family health survey 2015-2016 (NFHS-4): Clinical anthropometric biochemical (CAB) manual. [Google Scholar]
- 13.Beutler E, West C. Hematologic differences between African-Americans and whites: The roles of iron deficiency and alpha-thalassemia on hemoglobin levels and mean corpuscular volume. Blood. 2005;106:740–5. doi: 10.1182/blood-2005-02-0713. [DOI] [PMC free article] [PubMed] [Google Scholar]
- 14.Khusun H, Yip R, Schultink W, Dillon DH. World Health Organization hemoglobin cut-off points for the detection of anemia are valid for an Indonesian population. J Nutr. 1999;129:1669–74. doi: 10.1093/jn/129.9.1669. [DOI] [PubMed] [Google Scholar]
- 15.Marwaha RK, Garg MK, Bhadra K, Mithal A, Tandon N. Assessment of lean (muscle) mass and its distribution by dual energy X-ray absorptiometry in healthy Indian females. Arch Osteoporos. 2014;9:186. doi: 10.1007/s11657-014-0186-z. [DOI] [PubMed] [Google Scholar]
- 16.Moon J, Kong M, Kim H. Relationship between low muscle mass and anemia in Korean elderly men: Using the Korea National Health and Nutrition Examination Survey (KNHANES IV–V) J Clin Gerontol Geriatr. 2015;6:115–9. [Google Scholar]


