Abstract
This paper presents a new approach for accurate extraction of tissue deformation imaged with tagged MR. Our method, based on banks of Gabor filters, adjusts (1) the aspect and (2) orientation of the filter’s envelope and adjusts (3) the radial frequency and (4) angle of the filter’s sinusoidal grating to extract information about the deformation of tissue. The method accurately extracts tag line spacing, orientation, displacement and effective contrast. Existing, non-adaptive methods often fail to recover useful displacement information in the proximity of tissue boundaries while our method works in the proximity of the boundaries. We also present an interpolation method to recover all tag information at a finer resolution than the filter bank parameters. Results are shown on simulated images of translating and contracting tissue.
Keywords: Gabor filter bank, tissue deformation extraction, tagged MRI, filter interpolation, filter adaptation
1. INTRODUCTION
Cardiovascular disease is the leading cause of death in most developed countries. However, an improved understanding of the regional heterogeneity of myocardial contractility may lead to more accurate patient diagnosis and potentially reduce its morbidity. Tagged MRI is a non-invasive technique for measuring the motion of the myocardium by magnetically tagging parallel sheets of tissue at end-diastole. The sheets appear as dark lines that deform during systole. Quantification of the deformation requires accurate extraction of tag line motion and segmentation of the epicardial and endocardial surfaces.
A highly automated method is needed to make the technique clinically viable. With this goal in mind, we present a method which holds the promise of extracting tag line motion accurately and without user supervision. Extraction of the motion near the boundaries of the myocardium is particularly important, because infarcts often appear near such boundaries as the endocardial surface. Characterizing abnormal wall motion near the boundaries may lead to early administration of intervention and improved patient recovery. Moreover when incremental motion is computed, it is desirable to quantify the motion with sub-pixel accuracy.
In this paper we test our method on simulated images containing a variety of analysis challenges that occur at the myocardial boundaries, including (1) in some cases the myocardial boundary contains tagged tissue on either side, such as at the liver-myocardium interface, (2) in other cases the myocardial boundary contains tagged tissue only on one side, such as at the interface between the air-filled lungs or blood and the myocardium, and (3) in some cases the boundary has tortuous undulations which cause the intersection angle between tag lines and myocardial boundary to vary significantly along the boundary. This later effect occurs in axial images, such of the papillary muscles.
One filter choice for analyzing the motion of the tags in MRI is the Gabor filter. This filter is a complex sinusoidal grating modulated by a 2D Gaussian in the spatial domain, or equivalently, a shifted Gaussian in the spatial frequency domain5. This filter is optimally localized in both the spatial and frequency domains. A bank of Gabor filters is well suited for analyzing the local frequency content of images composed of texture aggregates2.
The motion of objects with characteristic spatial intensity pattern appearance can be computed by first extracting the phase of the local frequency content of the pattern. The motion of the object between frames can then be determined by differencing the phase14. Since the myocardium in tagged MR images contains characteristic phase information as imposed by the pulse sequence, the images lend themselves to analysis by such filters. Our method can be considered the spatial domain complement to the HARP method10,12. However, by thinking about the image analysis task in the spatial domain rather than the spectral domain, we can tune additional filter parameters unavailable in a simple spectral domain approach, and potentially achieve improved results in the vicinity of tissue boundaries.
These additional parameters are important, because the ability to analyze local frequency content diminishes quickly at texture boundaries if the neighboring textures in the vicinity contain multiple shared or space-variant subtextures1. Along the interface between objects there is a reduction in the response of a filter as that filter begins to straddle both tissues and blends information from both and thus yields a local frequency content which may apply to neither tissue. Such conditions exist at the boundaries of the myocardial tissue in tagged MRI.
We have developed a method to automatically extract the myocardial boundary in tagged MRI8,9. Moreover, knowledge of even approximate boundaries can provide an avenue to tune available parameters of the Gabor filter and then use the information from the set of filters which best fit the orientation and location of the boundary. The Gabor filter has 4 parameters: aspect, orientation, central frequency and grating orientation. Each of these dimensions can be leveraged to accurately extract the motion of the myocardium. Several researchers have applied Gabor filters tuning the central frequency and/or grating orientation either to help identify the location of tags lines3,11,13 or to help regularize the fit of a deformable model for the LV6, but they have not made use of all available parameters, nor shown the advantages that each provides. In section 2, we review the definition of the 2D Gabor filter, and then present our methodology that adapts the filter for the known approximate location and orientation of tissue boundaries and our interpolation strategy that extracts image information at a finer level of precision than the filter bank discretization. In section 3, we present the results of our method, on a variety of simulated images that contain many of the boundary challenges described above and for which we have ground truth motion information for a detailed error evaluation. In the last section we conclude with a discussion of our results and a look towards future research.
2. METHODOLOGY
The Gabor function is a complex sinusoidal grating modulated by a 2D Gaussian in the spatial domain, or equivalently, a shifted Gaussian in the spatial frequency domain. The filter is optimally localized in both domains, making it attractive for the analysis of nonstationary signals, such as the deformation pattern of tagged contracting tissue. The filter can be expressed as: , where the center frequency is and the grating makes an angle of tan−1 (V / U) with the x axis. The term g(x’, y’) is a modulating Gausaan, i.e., , which has an aspect ratio of λ in (x, y) and coordinates rotated by θ with respect to the x axis, (x’,y’) = (xcosθ + ysinθ,−xsinθ + ycosθ).
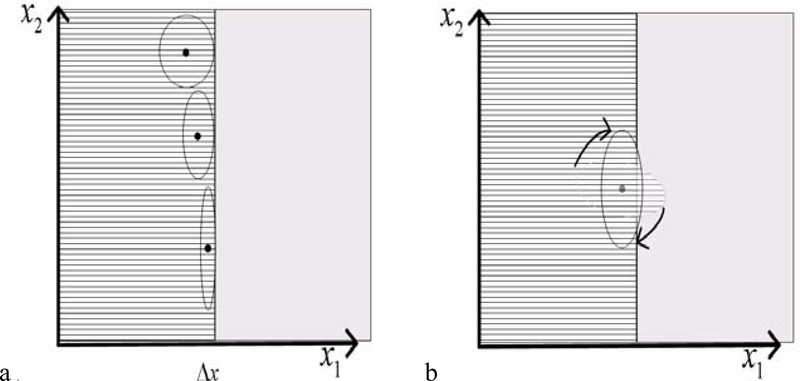
Typically, in regions near an interface between tagged and untagged tissue or between tissues with distinct tag phases, the filter blurs information from both sides of the boundary. By using knowledge of the location and orientation of the interface we can minimize the loss of information. We adjust both the aspect ratio and orientation of the Gaussian envelope of our Gabor filters. In Fig 1a and b, the ruled region on the left half plane of each plot is tagged tissue, while the right half plane is non-tagged tissue, such as the blood in mid-systole.
Fig 1:
Adaptation of parameters of the Gaussian envelop including (a) aspect and (b) orientation.
Given a rough estimate of the boundary location, we can compute the distance map to the boundary and use it to regulate the aspect ratio of a filter at any position in the image. Fig 1a illustrates how the distance to the interface from the center of the filter can be used to regulate the aspect ratio of the filter for that location in the image. The three filters depict how the aspect ratio can be changed to fit the filter to the boundary. Fig 1b illustrates how the orientation of a filter can be adapted throughout the image to better conform the filter to the boundary. In addition, for any point in the image, we compute the “orientation of the boundary” using the angle the gradient of the distance map makes with the x- axis at that point in the image.
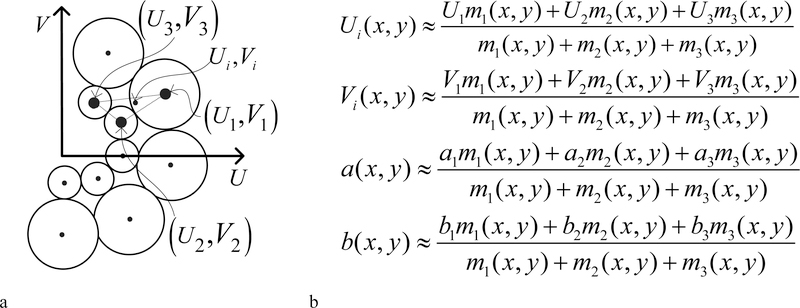
To recover deformation information for contracting tissue, we apply at each location in the image, a set of filters with various sinusoidal grating frequencies (Fig. 2a). To recover the orientation and spacing of the tags at (x, y) we interpolate the frequency parameters of the top three responding filters. The filters with largest response magnitude at the point (x, y), are the filters with spectral frequencies components: . If we let mi represent the magnitude of the response of the ith filter, i ∈{l, 2,3}, then the interpolated frequency components in the spectral domain are given by the equations for Ui and Vi (Fig. 2b). To recover the phase (related to tag displacement) and response magnitude (related to tag contrast) at ( x, y), we interpolate the complex components of the response of the three filters whose response magnitude is largest. We use the equations in Fig 2b for a( x, y) and b( x, y) to interpolate the real and imaginary components of the complex filter responses: {a1 + ib1, a2 + ib2, a3 + ib3} of the three filters with largest response magnitudes. We then combine the complex components to form the phase and magnitude responses. A tissue deformation field can be computed from the difference between the phases on successive images in a cine sequence.
Fig 2.
(a) Representation of the filter bank in the frequency domain. (b) Frequency parameter interpolation.
3. RESULTS
In order to achieve a quantitative evaluation of our method’s ability to recover local frequency and tag motion characteristics on a variety conditions that occur along the boundaries of the myocardium in tagged MRI, we have generated image sequences depicting sinusoidal tags in motion and we have computed ground truth for all recoverable tag deformation characteristics. Three image sequences were generated. The first sequence (Fig. 3a) contains tags that translate from left to right in a region bounded by a harmonic curve. The second and third contain an isovolumetric contraction of an annulus shaped region embedded in either a tagged background (Fig 3b) or untagged background (Fig. 3c). These last two sequences are, respectively, schematically representative of an axial image through the mid-ventricular region of a tagged left ventricle near an adjacent tagged structure (such as the liver) or next to an adjacent air-filled lung.
Fig 3:
(a) Test images of translating tags. (b,c) Isovolumetric contraction of a tagged annulus-shaped region in tagged background (b) and untagged background (c).
The advantage of adapting the filter envelope to fit the boundary is illustrated (in Fig. 4a and b). We have enlarged a portion of the harmonic curve and color coded the dx component of the recovered tag displacement from the first image sequence. A dark intensity (or blue) corresponds to dx=0 while a bright intensity (or yellow) corresponds to dx=0.7, which is the true displacement of the tags. Shades in between represent dx in the range (0.0, 0.7). When the filter envelope conforms to the boundary (Fig. 4b) the results are quite accurate, and, specifically, more accurate in the vicinity of the boundary. Comparatively, when the envelope is not adaptively parameterized, the recovered displacement suffers from a wide blur region (Fig. 4a).
Fig 4:
Benefit of envelope adaptation for displacement recovery (a) non-adaptive envelope. (b) adaptive envelope. (c,d) Benefit of frequency parameter interpolation: (c) non-interpolated tag spacing and tag orientation. (d) interpolated.
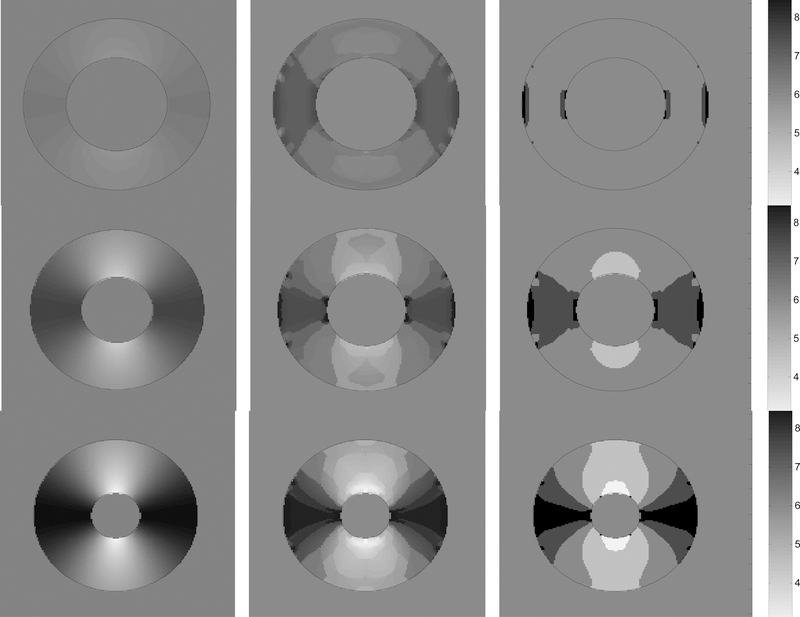
The practical advantage of interpolating the filter frequency parameters, (U,V), to recover tag spacing and orientation is illustrated (in Fig. 4c and d) for a region from the third image sequence. The shading indicates the recovered tag spacing, while the short black line segments represent the recovered normal direction to the tag lines. In Fig.4c the period of the radial frequency of the maximum responding filter is shaded, while in Fig 4d the frequencies of the top three filters are interpolated. We can see that the tag line normal direction more closely estimates the normal direction to the tags shown in the right-most image in Fig. 3c when interpolation is used. In addition, the tag line normal direction orientation varies more smoothly over the myocardium when interpolation is used. In Fig. 5 the tag period (reciprocal of frequency) is shown for three frames near the beginning, middle and end of the contraction of the third sequence. The first column is the ground truth tag period for those frames, the second column contains the extracted tag period when interpolation is used, while the third column is the extraction without interpolation amongst the highest responding filers.
Fig. 5.
Each column shows phase 2,6,9 from the 10 frame sequence represented in Fig 3c. First column shows how the true period of the tags varies from about 3 pixels to 9 pixels from peak to peak when annulus is fully contracted. Second column is the extracted period using interpolation. Third does not use interpolation.
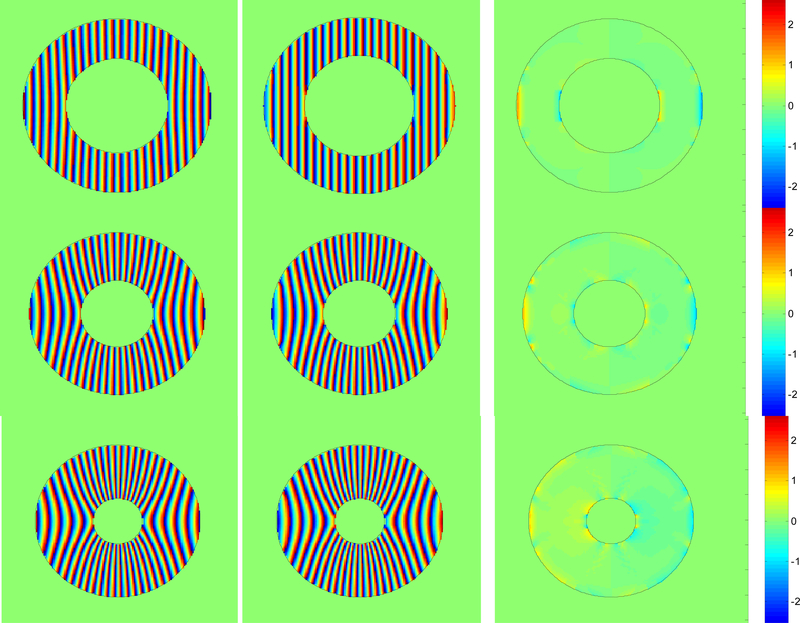
The improvement in tag phase recovery when the interpolation scheme is used is illustrated in Fig 6a–c. Each image shows the same portion of the contraction in the second sequence (Fig. 3b). In Fig 6a,b the shading indicates the phase which is while Fig 6c is the ground truth phase. Tag phase is more accurately recovered when interpolation is used (Fig 6b) than when it is not (Fig 6a). In particular the anomalies located on the extreme left of the annulus and at two locations near the top of the annulus have largely been removed through interpolation. In Fig. 7, the first column shows the true phase for 3 frames from the beginning, middle and end of the contraction of the image sequence of Fig 3c. The second column shows how the phase has been extracted quite accurately with very little error, as shown in the phase difference error images in the third column.
Fig. 6.
Benefit of phase interpolation: (a) non-interpolated phase. (b) interpolated phase. (c) ground truth phase
Fig. 7.
Each column shows phase 2,6,9 from the 10 frame sequence represented in Fig 3c. First column shows how the phase of the tags varies as the annulus is contracted and the simulated tissue contracts. Second column shows the excellent agreement of the extracted phase using interpolation. Third column shows the location of the minimal errors.
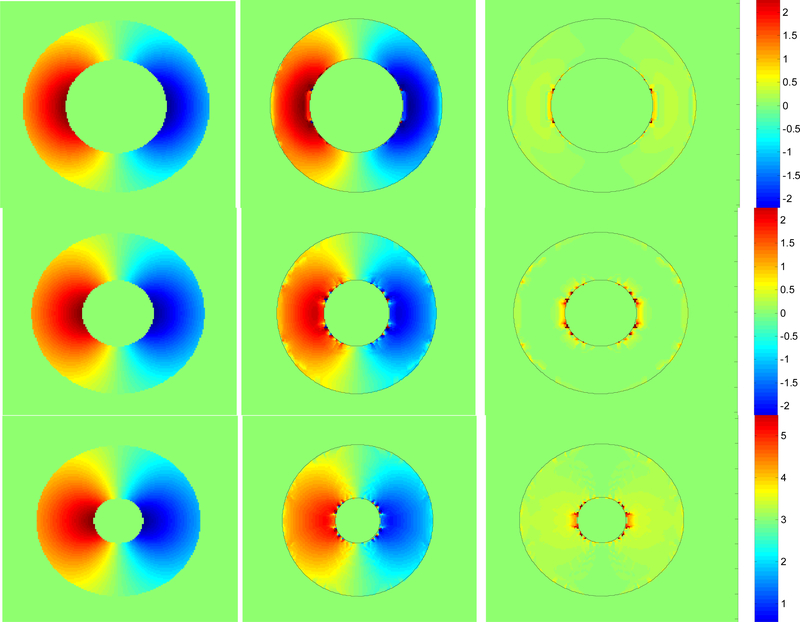
We have used the differences in the recovered phase from successive images to recover one component of the 2D tag displacement in the image plane. In Fig. 8, the first column shows the ground truth for dx displacement for 3 frames from the beginning, middle and end of the contraction of the image sequence of Fig 3c. The second column shows the dx component of the recovered displacement using the interpolated phase, while the third column shows the absolute value of the difference between the true dx displacement and recovered. Visually we can see that there is excellent qualitative agreement. The small error that does occur is confined to very small regions, mainly near the inner boundary.
Fig. 8.
Each column shows phase 2,6,9 from the 10 frame sequence represented in Fig 3c. First column shows how the true dx displacement component varies. The left side moves right, vice-versa for the left side. Second column shows the excellent agreement of the extracted displacement. Third column shows the errors are indeed small and distributed right along the edges.
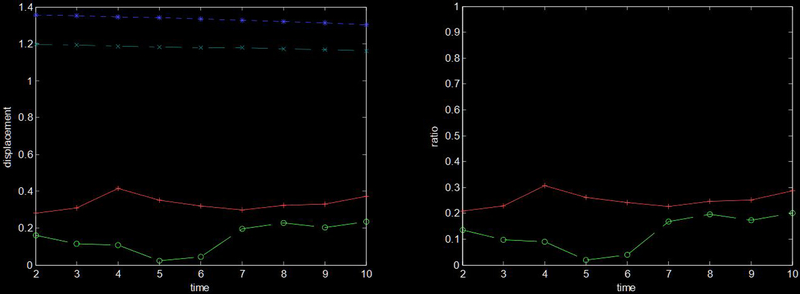
In Fig 9a, the RMS true dx displacement (dotted * line) is roughly 1.3 pixels over the frames of the image sequence while the RMS dx displacement error (solid + line) averaged 0.33 pixels over the sequence. The root-median-squared true dx displacement (dot-dashed x line) is nearly constant at 1.2 pixels while the root-median-squared dx displacement error (dashed o line) varies between 0.02 to 0.23 pixels. Fig 9b shows the ratio of the RMS error to RMS true displacement (solid + line) and the ratio of the median error to median displacement (dashed o line).
Fig. 9.
(a) This plot shows the mean (*) and median (x) true dx displacement (top two lines), and mean (+) and median (o) dx displacement error (bottom two lines). (b) This plot shows the ratio of RMS error to RMS displacement (+) and the ratio of median error to median displacement (o).
4. CONCLUSIONS
Adaptive Gabor filter banks fit the boundary and improve the recovery of tissue displacement in the vicinity of tissue boundaries. This may prove quite useful for medical diagnosis, as physiological abnormalities often appear first near the boundaries of tissue. We have also applied filters with varying sinusoidal frequencies for analyzing contracting tissue. A discrete set of filter frequencies tiling the positive U half plane of the spectral domain yields fast performance and sensitivity to wide variation in tag spacing and orientation. Our interpolation scheme enables precise recovery of tag orientation, spacing, phase and effective contrast, which may prove quite useful for the deformation analysis of tagged tissue.
There are several avenues to which this research lends itself. We recognize that this method may well be applicable to other organs imaged with tagged MR, such as the lungs or tongue. We also see that the combination of this motion analysis method with other methods8,9 that segment the boundary may enable robust motion extraction.
REFERENCES
- 1.Bovik A, “Analysis of multichannel narrow-band filters for image texture segmentation”, IEEE Transactions on Sig Proc, Vol 39(9), September 1991. [Google Scholar]
- 2.Bovik A, Clark M, Geisler W, “Multichannel texture analysis using localized spatial filters”, IEEE Transactions of PAMI, Vol 12(1), January 1990. [Google Scholar]
- 3.Chen Y, Amini AA, “A MAP framework for tag line detection in SPAMM data using markov random fields on the B-spline solid,” Mathematical Methods in Biomedical Image Analysis, pp 131–138, 2001. [DOI] [PubMed] [Google Scholar]
- 4.Deng X, Denney T, “Rapid 3D LV strain reconstruction from tagged cardiac MR images”, Proc. Of ISMRM, Vol 11, #707, 2003. [Google Scholar]
- 5.Gabor D, “Theory of communication”, JInst Elect Eng London, 93(III): pp 429–457, 1946. [Google Scholar]
- 6.Haber I, Kikinis R, Westin C, “Phase-driven finite element model for spatio-temporal tracking in tagged cardiac MRI”, In Niessen WJ, Viergever MA, eds. Proc of Medical Image Computing and Computer-Assisted Intervention. Utrecht, Netherlands: LCNS 2208, Springer; pp. 1332–1335, 2001. [Google Scholar]
- 7.Havlicek J, Bovik A, Chen D, “AM-FM image modeling and Gabor analysis”, In Chen C, Zhang Y eds. Visual information representation, communication and image processing, pp 343–387, 1999. [Google Scholar]
- 8.Montillo A, Metaxas D, Axel L, “Automated deformable model-based segmentation of the left and right ventricles in tagged cardiac MRI”, In: Ellis RE and Peters TM, eds. Proc of Medical Image Computing and Computer-Assisted Intervention. Montreal, Canada: LCNS 2878, Springer; pp. 507–515, 2003. [DOI] [PMC free article] [PubMed] [Google Scholar]
- 9.Montillo A, Metaxas D, Axel L, “Automated segmentation of the left and right ventricles in 4D cardiac SPAMM images”, In: Dohi T, Kikinis R, eds. Proc of Medical Image Computing and Computer-Assisted Intervention. Tokyo, Japan: LCNS 2488, Springer; pp. 620–633, 2002. [DOI] [PMC free article] [PubMed] [Google Scholar]
- 10.Osman NF, Prince JL, “On the design of the bandpass filters in harmonic phase MRI”, Proc. IEEE Int’l Conf Image Proc., Vancouver, Sept. 10–20, 2000. [Google Scholar]
- 11.Qian Z, Montillo A, Metaxas D, Axel L, “Segmenting cardiac MRI tagging lines using Gabor filter banks”, Proc of International Conference of the Engineering in Medicine and Biology Society, Cancun, Mexico, pp. 630–633, 2003. [Google Scholar]
- 12.Osman NF, Prince JL, “Angle images for measuring heart motion from tagged MRI”, Proc. IEEE Int’l Conf. Image Proc., Chicago IL, Oct. 4–7, 1998. [Google Scholar]
- 13.Young A, “Model tags: direct 3D tracking of heart wall motion from tagged magnetic resonance images”, In Wells WM, Colchester A and Delp S, eds. Proc Medical Image Computing and Computer-Assisted Intervention. Boston: LNCS 1496, Springer; pp 92–101, 1998. [Google Scholar]
- 14.Fleet D Jepson A, “Computation of component image velocity from local phase information”, Intern. J. of Computer Vision, 5:1, pp. 77–104, 1990. [Google Scholar]


