Abstract
In vitro differentiation of human stem cells can produce pancreatic β cells; the loss of this insulin-secreting cell type underlies type 1 diabetes. Here, as a step towards understanding this differentiation process, we report the transcriptional profiling of over 100,000 human cells undergoing in vitro β-cell differentiation, and describe the cells that emerged. We resolve populations that correspond to β cells, α-like poly-hormonal cells, non-endocrine cells that resemble pancreatic exocrine cells and a previously unreported population that resembles enterochromaffin cells. We show that endocrine cells maintain their identity in culture in the absence of exogenous growth factors, and that gene-expression changes associated with in vivo β-cell maturation are recapitulated in vitro. We implement a scalable re-aggregation technique to deplete non-endocrine cells and identify CD49a (also known as ITGA1) as a surface marker for the β-cell population, which allows magnetic sorting to a purity of 80%. Finally, we use a high-resolution sequencing time course to characterize gene-expression dynamics during human pancreatic endocrine induction, from which we develop a lineage model of in vitro β-cell differentiation. This study provides a deep perspective on human stem cell differentiation, and will guide future endeavours that focus on the differentiation of pancreatic islet cells, and applications in regenerative medicine.
Pancreatic β cells are regulators of blood glucose, the autoimmune destruction or dysfunction of which causes type 1 and type 2 diabetes. In vitro differentiation protocols have recently been developed that convert pluripotent stem cells into pancreatic β cells1–3. For instance, the ‘stem-cell-derived β (SC-β) cell’ protocol1 performs a stepwise differentiation that uses a combination of signalling cues that are derived from the cues that generate β cells in vivo. The resulting stem-cell-derived β cells secrete insulin in response to glucose challenges, and restore metabolic homeostasis in animal models of diabetes1. Consequently, in vitro differentiation protocols are leading candidates for the development of cell-based therapies for diabetes.
A challenge in producing any cell type in vitro is the heterogeneity of the cells generated by directed differentiation. At each step of the process, some cells follow the desired path, whereas others stray. To improve efficiency, it is important to identify all of the cell types that are produced during differentiation.
High-throughput single-cell RNA sequencing4 characterizes cell types by unbiased transcriptional profiling of thousands of individual cells. Single-cell RNA sequencing has previously been applied to comprehensively characterize the cell types of many organs, including several studies of the adult human5–9 and embryonic mouse10,11,12 pancreas.
Previous studies using β-cell differentiation protocols have made a number of important observations. Co-expression of insulin and other key β-cell markers, combined with glucose-stimulated insulin secretion, constituted the primary proof that β cells are produced in vitro. Studies that characterize bulk gene-expression profiles13,14 have shown that transcriptional and epigenetic landscapes change for thousands of genes. A previous study15 used single-cell quantitative PCR to propose a model for in vitro pancreatic differentiation. None of these studies has comprehensively determined the identities and states of all the cell types produced before and alongside in vitro β cells.
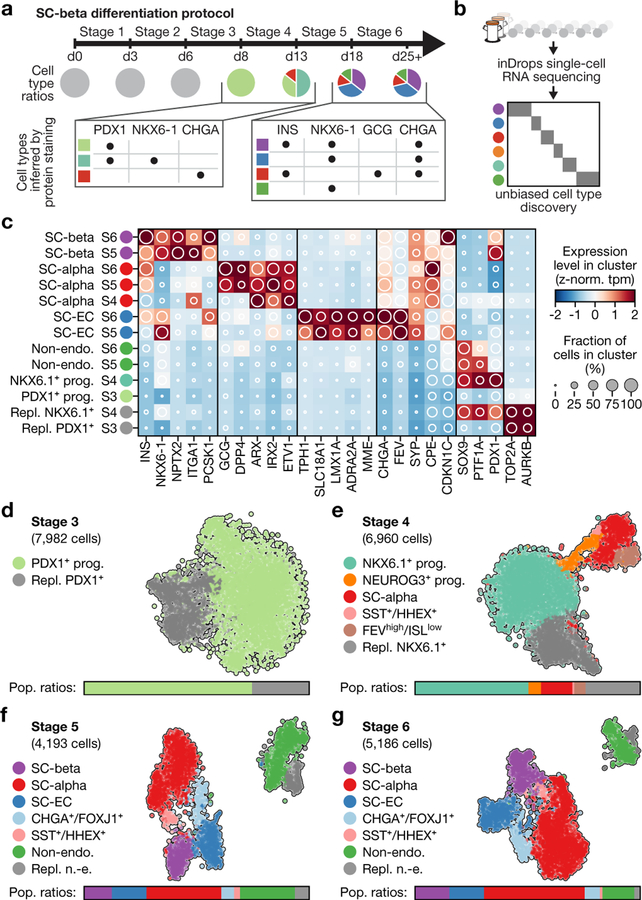
In the SC-β-cell protocol1, human pluripotent stem cells grown in 3D clusters are differentiated into six stages using specific inducing factors to produce ‘stem-cell islets’ (SC-islets) that contain stem-cell-derived β cells. Progress and efficiency are measured using immunofluorescence microscopy and flow cytometry (Fig. 1a). The first three stages of differentiation generate a nearly homogenous (about 90%) population of progenitors that express the master transcription factor PDX1. Thereafter, distinct populations are identified by staining for C-peptide (a fragment of proinsulin), the pan-endocrine marker CHGA and the β-cell transcription factor NKX6.1 (Fig. 1a, Extended Data Fig. 1a).
Fig. 1 |. Single-cell RNA sequencing of in vitro β-cell differentiation.
a, Summary of cell populations identified by flow cytometry at the end of stages 3–6 of the SC-β-cell protocol described in ref.1. b, Use of inDrops to sample cells from several time points of the same differentiation. c, Expression profiles of developmentally relevant genes and markers across cell types identified in SC-β-cell differentiation. The shading displays mean expression as z-normalized transcripts per million mapped reads (z-norm. TPM), and diameter denotes fractional expression. d–g, t-SNE projections of cells sampled from the end of stages 3 through to stage 6 of protocol x1 (see Extended Data Table 1 for definition of protocols). Cells are coloured according to their assigned cluster. Horizontal bars indicate cell-type proportions.
Here we apply single-cell RNA sequencing and computational analysis to generate a deep understanding of in vitro β-cell differentiation (Fig. 1b). We define emergent cell types at each stage of differentiation through their global gene-expression profiles, which creates a precise cell-by-cell description of in vitro β-cell differentiation. These are critical steps in advancing the directed differentiation of stem cells towards a treatment for diabetes.
SC-islets contain four major cell types
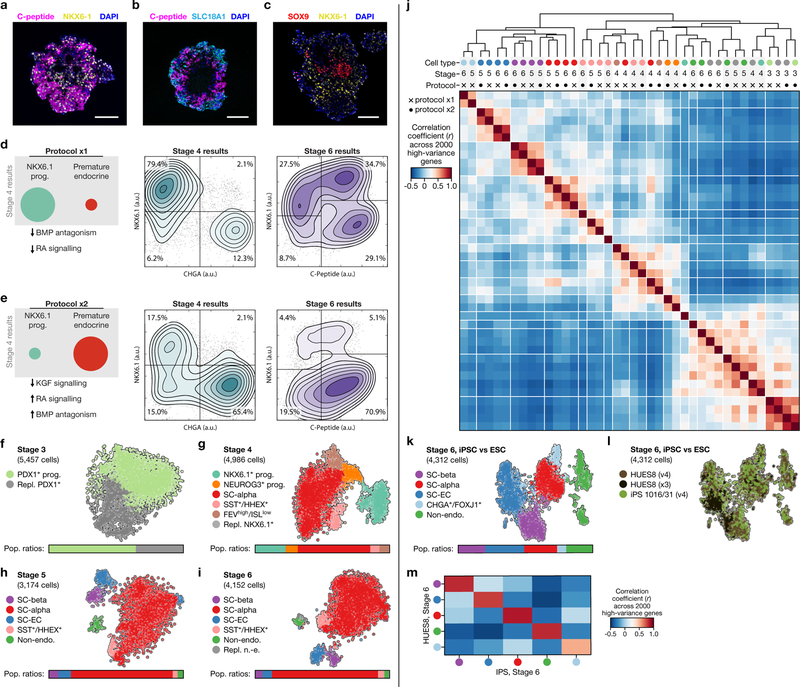
We sequenced 40,444 cells that were sampled from the end of stage 3 through to stage 6 of differentiations done with two modified SC-β-cell protocols, to define cell populations using their entire transcriptomes. These two protocols use subsets of the factors used in the original1 (hereafter referred to as v1) stages 3 and 4, and yield populations ratios at stage 4 that are different to the ratios in the original protocol (Extended Data Fig. 1d, e, Extended Data Table 1). Throughout this study, we leveraged the fact that, in the SC-β-cell protocol, differentiation is carried out in 3D suspension culture to repeatedly sample the same differentiation over time.
The major populations we identified (Fig. 1c–g, Supplementary Fig. 1) are progenitors (in stages 3 and 4), three types of endocrine cells (in stages 4, 5 and 6) and one type of non-endocrine cell (in stages 5 and 6). In both of our modified protocols, cells at stage 3 comprise a single population of replicating pancreatic progenitors (PDX1+). By the end of stage 4, we observe NKX6.1+ progenitors as well as the first α-like cells. Finally, at stages 5 and 6, we observe three classes of CHGA+ endocrine cells: (i) SC-β cells that express INS, NKX6.1, ISL1 and other β-cell markers; (ii) α-like cells that express GCG, ARX, IRX2 and also INS; and (iii) an endocrine cell type that expresses CHGA, TPH1, LMX1A and SLC18A1 that most resembles enterochromaffin cells (hereafter SC-EC cells) (Extended Data Fig. 1b). At stages 5 and 6, SOX9+ non-endocrine cells (Extended Data Fig. 1c) form a final population with considerable heterogeneity. Thus, we identified two cell populations with translational relevance that correspond to adult islet cell types (SC-β and SC-α cells), alongside two other populations (SC-EC and non-endocrine cells).
Beyond these major populations, both of the modified protocols include a small population of SST+HHEX+ISL1+ cells that emerge as early as the end of stage 4. A single population, labelled by high levels of FOXJ1+, was present in only one of the modified protocols (Extended Data Table 2). Although our protocol variants showed large differences in cell-type ratios (Fig. 1d–g, Extended Data Fig. 1f–i), as expected, every cell type that was shared across protocols showed a similar gene-expression signature (Extended Data Fig. 1j). We conclude that population ratios can be markedly affected by protocol modifications without altering the identities of the cell types.
Finally, we compared cells of stage 6 that were produced from differentiation of embryonic stem cells (line HUES8) and induced pluripotent stem cells (line 1016/31), and observed high correlations between the corresponding cell types (Extended Data Fig. 1k–m). Together, these results establish that our in vitro β-cell differentiation protocols guide a lineage progression that is robust to perturbation in differentiation factors and stem cell lines.
SC-β cells stably maintain identity
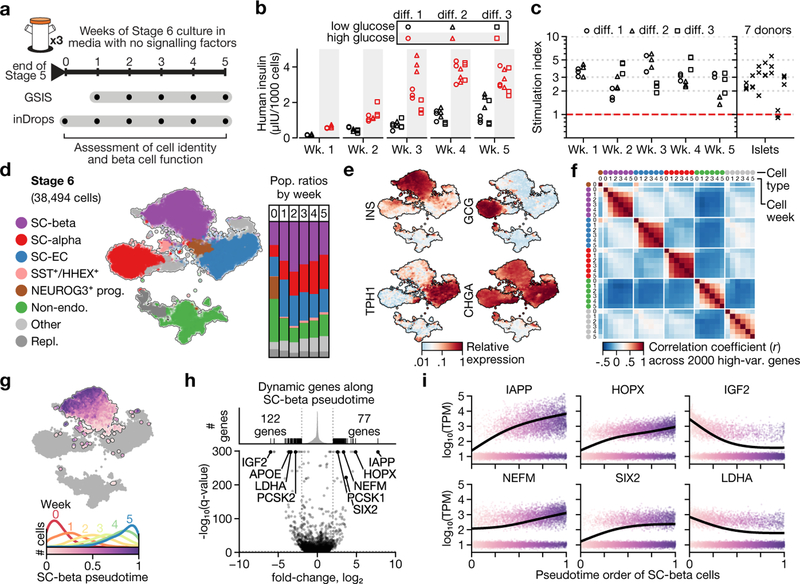
The key properties of SC-β cells are glucose responsiveness and transcriptional similarity to endogenous human β cells. We characterized these properties across several weeks of stage 6, using serum-free medium without exogenous signalling factors (hereafter referred to as protocol v8). We carried out single-cell RNA sequencing and in vitro glucose- stimulated insulin secretion (GSIS) tests across several weeks of stage 6, sampling at weekly intervals from three differentiations (Fig. 2a).
Fig. 2 |. SC-β cells maintain identity and gain maturation-marker expression during extended culture in stage 6.
a, Experimental design for studying functional and transcriptional changes during stage 6 of protocol v8 (see Extended Data Table 1). b, Glucose-stimulated insulin secretion showing consecutive low-glucose (2.8 mM) and high-glucose (20 mM) challenges for three independent differentiations (diff.) over a period of five weeks. c, Stimulation indices (insulin released at 20 mM glucose versus insulin released at 2 mM glucose) for data in b. d, t-SNE projection of 38,494 cells from 6 time points that span 5 weeks of stage 6. Cells are coloured according to their assigned type. Vertical bars show population ratios in each week. e, Expression of endocrine-marker genes. f, Correlation of expression profiles for each major cell type, broken down by week. Cell type colours match those in d. g, Top, pseudotime order for SC-β cells shown on the t-SNE plot. Bottom, distribution of SC-β-cell pseudotime order, stratified by sampling week. h, Identification of dynamic genes along SC-β-cell pseudotime. Fold change compares start and end of pseudotime trajectory. q-values are false-discovery-rate (FDR)-adjusted (α = 0.001) P values from a likelihood ratio test comparing full and reduced models (Methods). i, Expression of selected genes shown along SC-β-cell pseudotime. Each dot represents expression of a cell, sorted and shaded as in g. Line shows result of pseudotime regression.
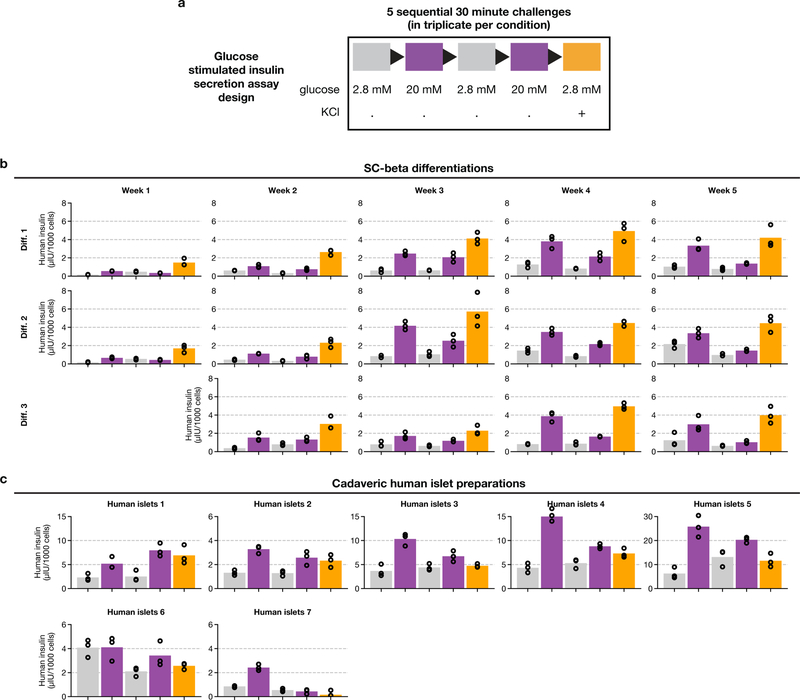
SC-islets acquire glucose-responsive insulin secretion in the first week of stage 6, and retain this ability for about another four weeks (Fig. 2b, c, Extended Data Fig. 2). The observed stimulation indices were in the same range as human islet controls, although the magnitude of secretion was higher in islets. These results show that glucose responsiveness is a stable trait that requires no exogenous factors or serum.
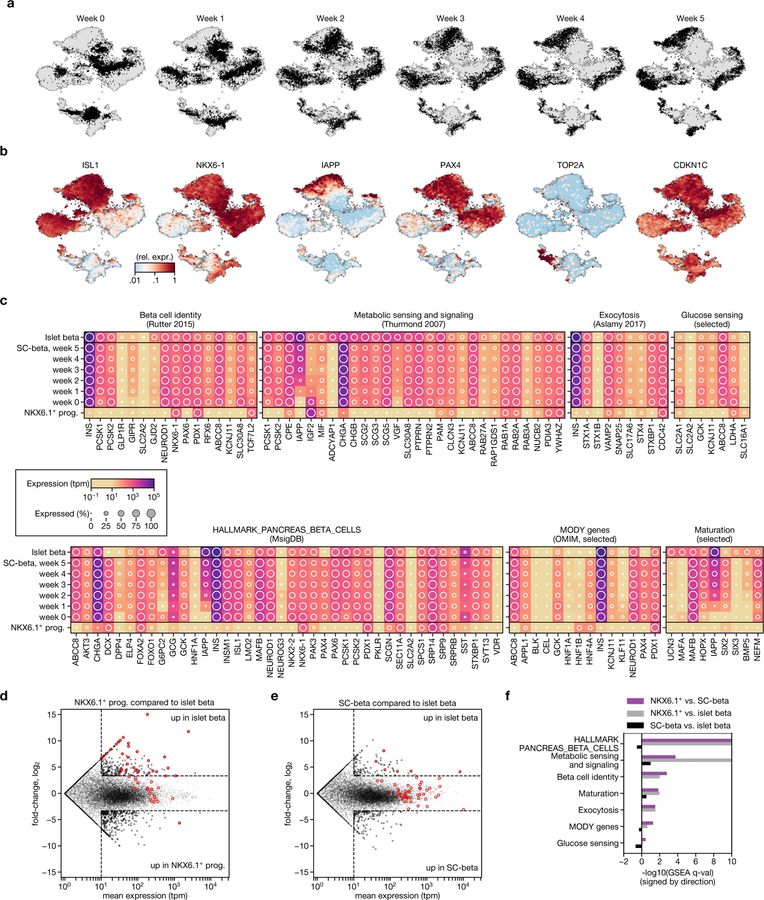
In parallel, we assessed whether the stage-6 cell populations maintain their identity during an extended time in culture. As in the previous dataset, we identify SC-β, SC-α, SC-EC cells and non-endocrine cells (Fig. 2d, e, Extended Data Fig. 3a, b). Small, rare populations (Extended Data Table 2) are present only at week 0 and then disappear (PHOX2A+), or are first detected late in stage 6 (marked by GAP43+ and ONECUT3+). SST+HHEX+ cells that resemble δ cells also constitute a small population. We observe a high correlation between the same cell type at different time points, both in absolute (r2 > 0.8) and relative terms, as compared to other cell types from any time point (Fig. 2f). Importantly, for endocrine cells we see no evidence of de-differentiation towards a progenitor state or transdifferentiation towards alternative fates during stage 6. We thus conclude that the global transcriptional profiles—which serve as measure of identity—are maintained during extended stage-6 culture.
Consistent with their glucose responsiveness, we observe that SC-β cells express key genes of β-cell identity16, metabolic sensing and signalling17, and insulin synthesis, packaging and secretion18. Broadly, these genes are expressed in both cadaveric islet β cells and SC-β cells—but not in the NKX6.1+ progenitors of the latter cells (Extended Data Fig. 3c–f, Supplementary Table 3). There appears to be minimal cell replication, as evidenced by the negligible expression of cell-cycle-associated genes (TOP2A) and high expression of the cell-cycle-inhibitor gene CDKN1C.
Finally, we sought to describe the refinements in SC-β-cell gene expression that occur over time. We applied pseudotime analysis to order the cells according to their transcriptional state, and regressed the gene expression using pseudotime to identify dynamic genes (Fig. 2g, h, Supplementary Table 4). Genes that increase along pseudotime include IAPP and other markers of β-cell maturity such as HOPX14, NEFM19 and SIX214,19 (Fig. 2i), although some markers of maturity or age (UCN320, MAFA19 and SIX319) were not expressed. Decreasing genes include LDHA—the suppression of which is necessary for proper metabolic sensing21—and IGF2, which encodes a secreted peptide downstream of the INS gene; this suggests increasingly precise transcriptional regulation of the genomic region surrounding the INS gene locus. In summary, we observe relatively subtle changes in SC-β-cell transcriptomes during stage 6, some of which correspond to known markers of maturation.
Early SC-α cells express insulin
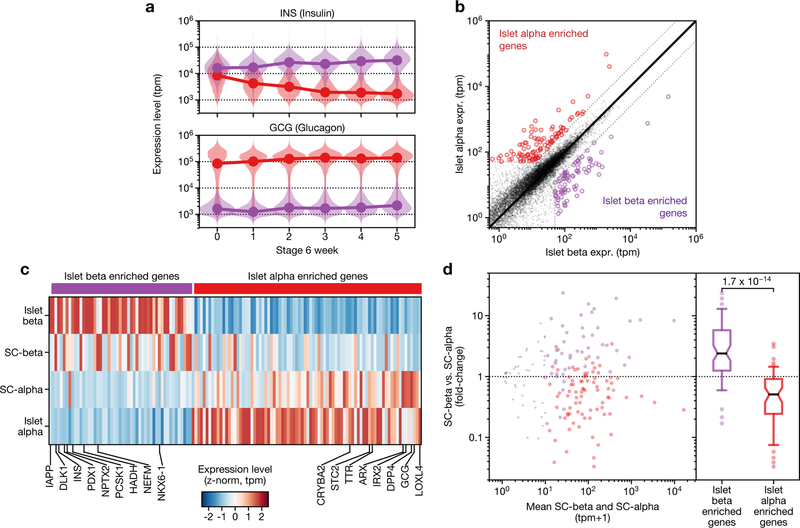
Poly-hormonal cells that express both insulin and glucagon have previously been reported in several in vitro pancreatic differentiation protocols. Beyond glucagon, these cells express many markers of islet α cells, but—uncharacteristically for islet α cells —also express insulin. On this basis, and because the expression of insulin is rectified during stage 6 (Extended Data Fig. 4a), we refer to these cells as SC-α cells. To explore the similarity of SC-α and SC-β cells to their in vivo counterparts, we first identified genes that are differentially expressed between adult cadaveric α and β cells5 (Extended Data Fig. 4b). Genes with higher expression in α cells were higher in SC-α cells, whereas β-cell-enriched genes were higher in SC-β cells (Extended Data Fig. 4c, d). This result is consistent with previous findings that in vitro-derived poly-hormonal cells resolve to mono-hormonal cells that express glucagon22. Cells that co-express insulin and glucagon have been observed in two contexts: human fetal pancreatic development, in which INS+GCG+ARX+ cells are described as α precursors23, and in type 2 diabetes, in which INS+GCG+ cells are described as de-differentiated β cells24. Given our evidence that poly-hormonal SC-α are a transient state towards mono-hormonal SC-α cells, in vitro poly-hormonal cells are more likely to match the developmental INS+GCG+ARX+ cells than de-differentiated β cells seen in type 2 diabetes.
SC-EC cells
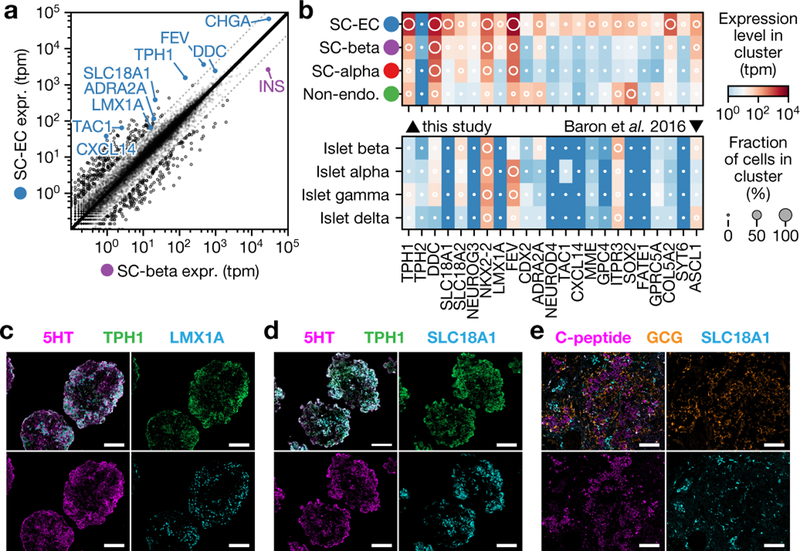
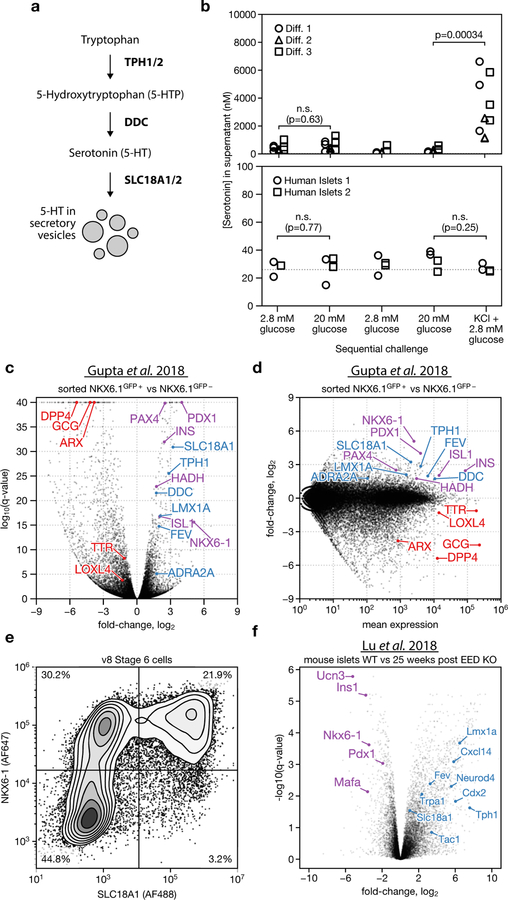
Our survey identified a population of endocrine cells that express TPH1, NKX6.1 and low levels of insulin, but which lack the β-cell markers G6PC2, NPTX2, ISL1 and PDX1. We hypothesize that these cells are SC-EC cells. Enterochromaffin cells synthesize and secrete serotonin in the gut, in which they serve as chemosensors25. The transcriptome of enterochromaffin cells has previously been characterized using single-cell sequencing of mouse intestinal epithelium26 and organoids27. Compared to SC-β cells (Fig. 3a), SC-EC cells express genes that are required for serotonin synthesis (TPH1, DDC and SLC18A1) (Extended Data Fig. 5a), and enterochromaffin markers such as LMX1A, ADRΑ2A, FEV, TAC1 and CXCL14. The expression of these serotonin synthesis and enterochromaffin marker genes is enriched in SC-EC cells relative to SC-α- and SC-β-cell in vitro populations, and in vivo pancreatic endocrine populations (Fig. 3b). By immunostaining (Fig. 3c, d), we verified that SC-EC cells co-express TPH1, LMX1A and SLC18A1 and contain serotonin. Similar to SC-β cells, SC-EC cells survive transplantation in the kidney capsule of mice (Fig. 3e). SC-islets release serotonin upon depolarization with KCl but not upon stimulation with high glucose (Extended Data Fig. 5b), which is consistent with the expected behaviours of enterochromaffin cells28. We observe SC-EC cells in all datasets of this study. We also observe expression of SC-EC genes in bulk expression data29 from differentiations of induced pluripotent stem cells, using a different protocol (Extended Data Fig. 5c–e), which suggests the presence of enterochromaffin cells across other β-cell protocols and pluripotent cell lines.
Fig. 3 |. Characterization of SC-EC cells.
a, Comparison of SC-β- and SC-EC-cell gene-expression profiles. Blue genes are enterochromaffin markers or are required for serotonin synthesis. b, Expression levels for SC-EC-cell-enriched genes across in vitro populations (top) and human pancreatic endocrine cells (bottom). Shading displays mean expression (TPM, log-scaled) and diameter denotes fractional expression. c, d, Immunofluorescence staining for SC-EC-cell markers showing co-localization with serotonin, using the v8 protocol. Scale bars, 100 μm. e, Immunofluorescence staining of graft tissue recovered eight weeks after transplantation of (protocol v4, see Extended Data Table 1) stem-cell islet clusters shows SC-EC persist after transplantation.
Although serotonin is reportedly produced in human β cells30, we do not observe expression of TPH1 in either in vivo or in vitro β populations5–9, nor do we find enterochromaffin cells in single-cell profiling of the pancreas5–11. Previous studies have shown that β cells produce serotonin in an age- or context-dependent manner, which has not explored in existing single-cell datasets30–32. However, we identified a signal of the induction of a serotonin (or enterochromaffin) program in perturbed mouse β cells from recently published data33, which suggests that there is only a small ‘distance’ between the β-cell and enterochromaffin-cell fates. Specifically, we note that this previous data shows that 25 weeks after a β-cell-specific knockout of the polycomb repressive complex 2 (PRC2) component EED, the enterochromaffin marker genes Tph1, Lmx1a, Slc18a1 and Trpa1 are upregulated (Extended Data Fig. 5f). This shows that the serotonin or enterochromaffin program is induced in a model of β-cell de-differentiation, which suggests that there is a relationship between the β-cell and enterochromaffin-cell fates.
Fates of non-endocrine cells
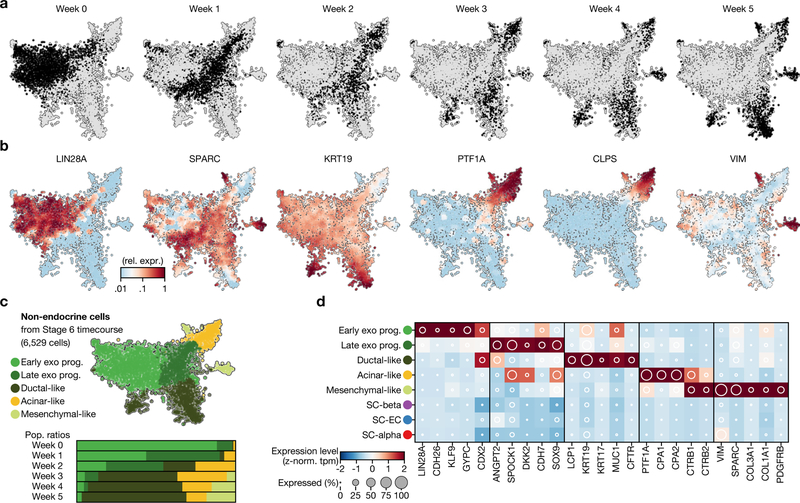
Some cells do not adopt an endocrine fate during stages 4 and 5 (Extended Data Fig. 6). These non-endocrine cells are similar to pancreatic-progenitor cell types from earlier stages, in that they express key transcription factors and lack endocrine markers. Whereas both in vivo and in vitro endocrine cells are largely post-mitotic, these non-endocrine cells retain expression of cell-cycle-associated genes (TOP2A) (Supplementary Fig. 1). These cells do not follow endocrine commitment, nor do they remain as progenitors—instead, they appear to differentiate towards exocrine pancreatic fates. During continued culture in stage 6, these non-endocrine cells split into populations that express markers of pancreatic acinar, mesenchymal and ductal cells (Extended Data Fig. 6).
Purification of endocrine and SC-β cells
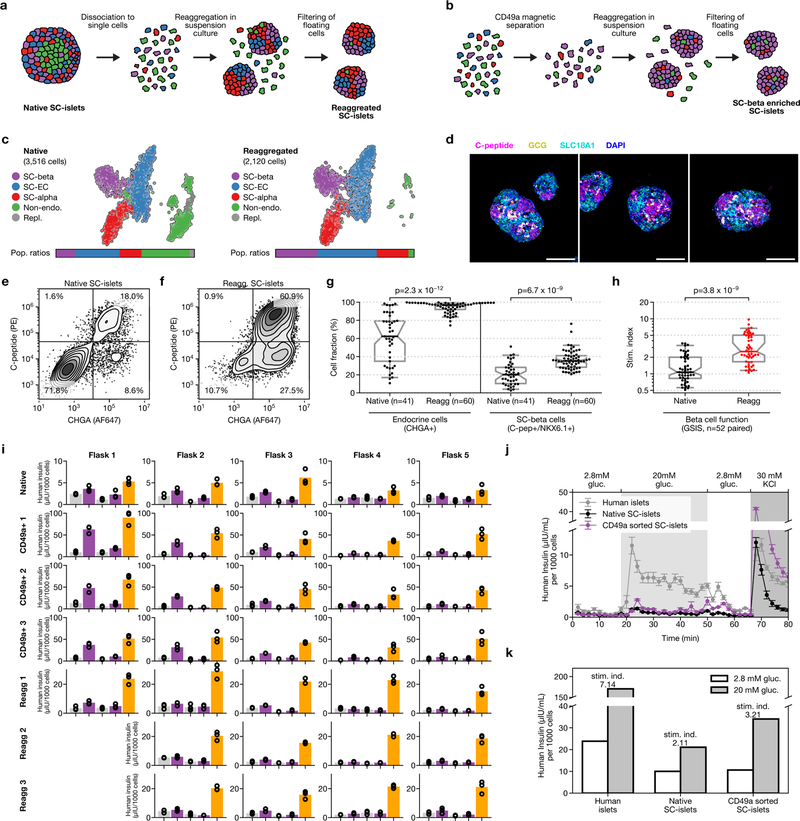
Single-cell dissociation followed by controlled re-aggregation has previously been used to purify endocrine cells from neonatal pancreas34 and in vitro β-cell preparations35. We discovered that enzymatic dissociation followed by re-aggregation can be applied after stage 5. Unlike previous methods, this approach is scalable because it does not require micro-patterned surfaces, hanging droplets or soluble extracellular matrix factors to increase efficiency. Using single-cell sequencing, flow cytometry and GSIS (Extended Data Fig. 7a–h), we show that this re-aggregation procedure depletes non-endocrine cells while maintaining cell identity and improving β-cell function. Staining of SC-islets after re-aggregation shows marked compartmentalization of endocrine-cell populations into regions of similar cells.
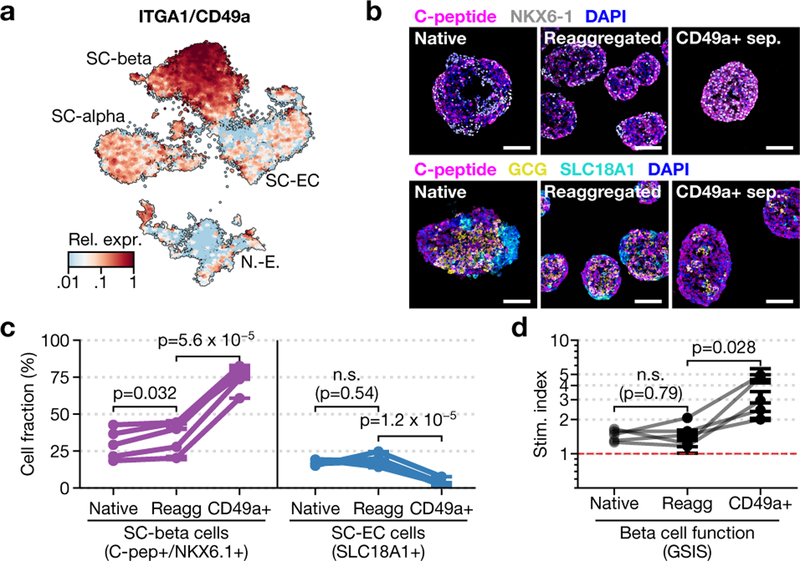
Beyond endocrine enrichment, we explored ways of specifically enriching for SC-β cells. Our analysis identifies CD49a as a SC-β-cell surface marker (Fig. 4a). Within the adult islet, CD49a expression is not specific to β cells5. We used anti-CD49a staining and magnetic microbeads to label and efficiently sort SC-β cells. This method produces clusters that contain up to 80% SC-β cells (Fig. 4b, c), with fewer than 5% SC-EC cells. We observe comparable purification from differentiations of an additional embryonic stem cell line, as well as two induced pluripotent stem cell lines (data not shown). These highly purified SC-islets are responsive to glucose in vitro (Fig. 4d, Extended Data Fig. 7i–k), and have increased stimulation indices compared to unsorted, re-aggregated SC-islets in both static and dynamic GSIS—but lower secretion magnitude compared to cadaveric islets in both of these forms of GSIS. Thus, our single-cell sequencing data have revealed an approach for enriching β cells produced in vitro.
Fig. 4 |. Purification of SC-β cells with CD49a.
a, Expression of CD49a in stage-6 time-course data. b, Immunofluorescence for SC-β-cell (top) and endocrine-cell (bottom) markers of native, unsorted re-aggregated and CD49a+ sorted re-aggregated clusters. Scale bars, 100 μm. c, Flow cytometry quantification of SC-β cells (C-peptide+NKX6.1+) and SC-EC cells (SLC18A1+) fractions in three matched conditions for five biologically independent differentiations using protocol v8. d, Stimulation index for the differentiations shown in c. In c, d, symbol shows mean, and error bars (where shown) correspond to s.e. across three independently re-aggregated (re-agg) biological replicates. P values are from (two-sided) dependent t-test.
The origin and lineage of SC-β cells
Single-cell sequencing can reconstruct complex developmental trajectories both from single snapshots or sequential samplings. SC-β and SC-EC cells are absent at the end of stage 4 and appear during the course of stage 5. Given their shared expression of key genes (such as PAX4 and NKX6–1), we sought to determine whether these cells form separately during endocrine induction or whether one is a precursor for the other. To this end, we sequenced approximately 45,000 cells at daily intervals throughout the course of stage 5 for 2 independent differentiations.
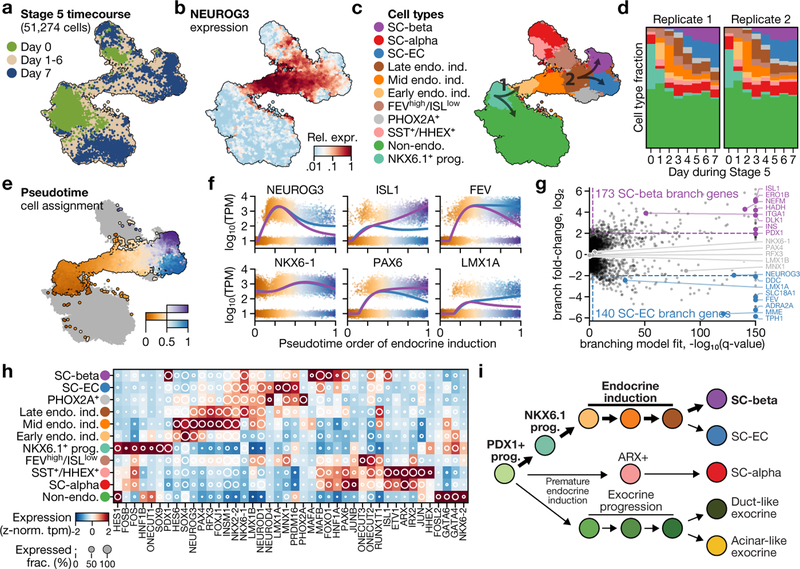
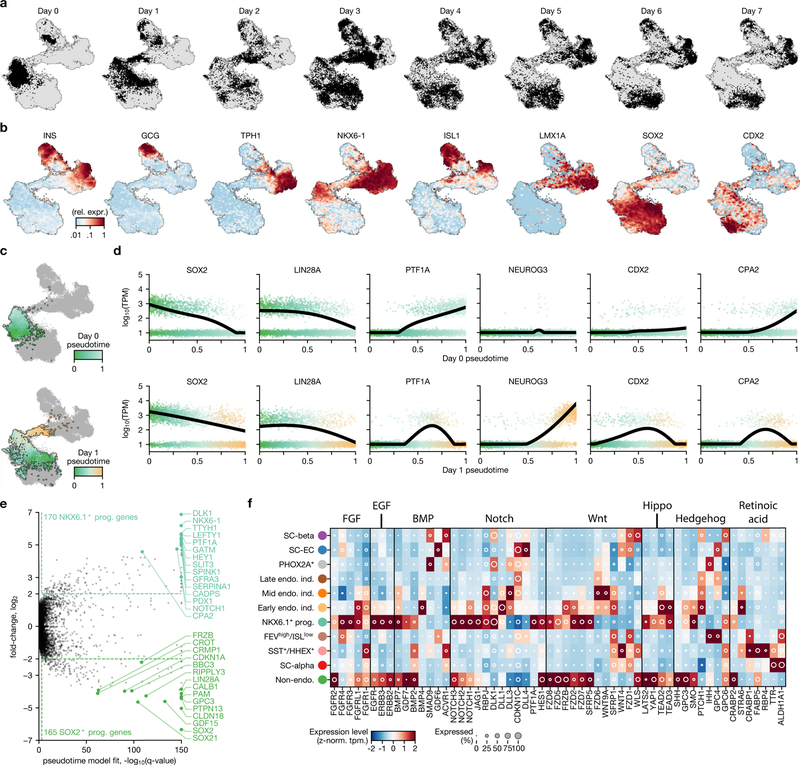
From a global perspective, individual cells in this dataset form a continuum that connects stage-5 populations at day 0 and day 7. NEUROG3, a transiently expressed master regulator of in vivo endocrine induction, is expressed by cells that bridge endocrine and non-endocrine cells within this continuum, as different cell types gradually emerge (Fig. 5a–d, h, Extended Data Fig. 8a, b). Some cells at day 0 are already endocrine, and match either SC-α cells (ARX+) or δ-like cells that show co-expression of SST and HHEX. Other cells at day 0 (marked by FEV+ISL− but NEUROG3−) resemble NEUROG3+ cells from later time points, and probably represent partial endocrine induction. The trajectory that connects progenitors to SC-β cells contains two bifurcation events, which that we explored (arrows in Fig. 5c).
Fig. 5 |. A high-resolution map of in vitro endocrine induction.
a–c, t-SNE projection of 51,274 cells, shaded according to sampling time within stage 5 (a), to expression of NEUROG3 (b) and to their assigned cell types (c). Arrows in c indicate key lineage bifurcations. Endo. ind., endocrine induction. d, Fraction of cells from each cluster in c for each day of both independent differentiations. e, t-SNE shading of branch assignment and pseudotime value of each cell on the path from NKX6.1+ progenitors to SC-β cells and SC-EC cells. f, Expression of selected marker genes along pseudotime ordering from e. Dots show expression in single cells, sorted and shaded according to pseudotime order. Lines show regression on pseudotime for each branch (blue, SC-EC cell; purple, SC-β cell). g, Genes with significant branch-specific expression pattern. q-values are FDR-adjusted (α = 0.001) P values from likelihood ratio test comparing branched and non-branched models (Methods). h, Mean expression values of transcription factors for clusters presented in c, d. Shading displays mean expression (z-normalized TPM) and diameter denotes fractional expression. i, Proposed developmental model for the key cell types produced by SC-β-cell protocol.
The initiation of endocrine induction is the first major bifurcation of cells during stage 5. On day 0, progenitors form a single heterogeneous population characterized by a gradient from SOX2+FRZB+PDX1low cells to NKX6–1+PTF1A+PDX1high cells (Extended Data Fig. 8c–e). Pseudotime ordering of these progenitors identifies 335 genes that are correlated with the gradient. On day 1, we observe NEUROG3+ expression at the NKX6–1+PTF1A+PDX1high end of the gradient, and thus infer that these genes mark the progenitors that are most poised for endocrine induction. NEUROG3 expression is accompanied by changes in many other transcription factors and cellular signalling genes (Extended Data Fig. 8f). We also observe—starting on day 1—that there is an upregulation of CDX2 (Extended Data Fig. 8b, d) among a subset of the NKX6–1+ cells that have yet to, or fail to, undergo endocrine induction. Our analysis reveals an axis of stage-4 progenitor variation—marked by NKX6–1+, PTF1A+ and PDX1high cells that predicts endocrine induction potential.
Stage 5 endocrine induction primarily yields SC-β and SC-EC cells, with the earliest cells of these types emerging on day 3. Global clustering and manifold embedding suggest a late branching of the SC-β and SC-EC cell fates. To validate this branching observation, we computed diffusion pseudotimes for all SC-β, SC-EC and NEUROG3+ cells (Fig. 5e–g). We fit to each gene a model that incorporated both pseudotime and branch assignment as covariates, and compared these models to models that were fit without branch labels. Although some genes (such as NEUROG3 and NKX6–1) are dynamically expressed but show little or no branch dependence (Fig. 5f), we identify 313 branch-associated genes (q value < 0.001 and fold change > 4)—including many transcription factors, and key SC-β- and SC-EC-cell fate genes. Our analysis suggests that SC-β and SC-EC cells emerge from a common NEUROG3+ induction intermediate, rather than one serving as a progenitor for the other. Thus, this constitutes a second fate bifurcation on the trajectory of SC-β-cell formation. From this analysis, we propose a model for the lineage of cell types produced by SC-β-cell differentiation (Fig. 5i).
Discussion
Beta cells are front-runners in the field of regenerative medicine. Nonetheless, directed differentiation protocols for β cells produce other cells alongside them. In this study, we use single-cell RNA sequencing experiments to comprehensively characterize the cells that are formed during SC-β-cell differentiation.
The stepwise synchronous differentiation of millions of cells provides an opportunity to study human developmental processes. We show that SC-β cells respond to glucose in vitro, and maintain their identity under extended culture without signalling modulators. Dynamic genes include several markers of β-cell maturation. Furthermore, the identity of poly-hormonal cells has previously been controversial: we conclude that they represent α-like (that is, SC-α) cells that only transiently mis-express insulin. In the context of transplantation, these cells may improve β-cell function through local interactions or autocrine signalling within SC-islets. We show that progenitors that fail endocrine induction progress towards pancreatic exocrine cell types. These seem undesirable, as they may replicate or occupy precious space within transplantation devices. We describe a scalable re-aggregation method that enriches endocrine cells, which allows the elimination of these exocrine cell types. Additionally, we identify CD49a as a surface marker of SC-β cells, and generate very pure SC-β-cell clusters via magnetic sorting.
An unexpected finding of our analysis is the existence of SC-EC cells in vitro. We show that SC-EC cells are closely related to, but fundamentally distinct from, SC-β cells and that they arise from a late bifurcation of differentiation. Given this close similarity and their expression profile for key genes (NKX6–1, CHGA and not expressing GCG), these cells may be misclassified as either progenitors or bona fide β cells when analysed using methods that are based on preselected groups of genes15. In vivo, enterochromaffin cells have not previously been observed in studies of mouse and human islets5–9. Nonetheless, extremely rare reports of primary pancreatic carcinoid tumours that produce serotonin provide support for the existence of resident pancreatic enterochromaffin cells36. We show that CD49a purification depletes SC-EC cells.
This study provides a resource for future development of β-cell differentiation protocols. For instance, hypotheses regarding the control of cell fate by modulating signalling pathways may be guided by receptor expression patterns or inferred signalling activities. Although SC-β cells are highly similar to cadaveric β cells, differences remain—including the lack of expression of UCN3, MAFA and SIX3. While these genes are probably expressed after transplantation in vivo, they represent the next milestone in the pursuit of ever-more-mature SC-β cells in vitro. In parallel, further milestones in characterizing SC-β-cell differentiation will come from single-cell measurements of proteins, epigenetics and lineage.
Overall, we provide a comprehensive and detailed analysis of a stem-cell product destined for human therapeutic strategies. This type of high-resolution, single-cell profiling represents a necessary step on the road towards successful and safe therapies.
METHODS
No statistical methods were used to predetermine sample size. The experiments were not randomized and investigators were not blinded to allocation during experiments and outcome assessment.
Cell culture
Human pluripotent stem cell maintenance and differentiation was carried out as previously described1. Pluripotent stem cell lines were obtained from stocks maintained by the Melton laboratory or Semma Therapeutics. Lines were identified by DNA fingerprinting (Cell Line Genetics) and all lines tested negative on routine mycoplasma contamination verifications. Pluripotent stem cell lines were maintained in cluster suspension culture format using mTeSR1 (Stem Cell Technologies, 85850) in 500-ml spinner flasks (Corning, VWR) spinning at 70 rpm in an incubator at 37 °C, 5% CO2 and 100% humidity. Cells were passaged every 72 h: human pluripotent stem cell clusters were dissociated to single cells using Accutase (Innovative Cell Technologies; AT104–500) and light mechanical disruption, counted and seeded at 0.5 M cells/ml in mTeSR1 + 10 μM Y27632 (DNSK International, DNSK-KI-15–02). Cell lines were authenticated by DNA fingerprinting (Cell Line Genetics). The HUES8 lines used throughout the study matched HUES8. The iPS line used as a comparison matched as a mixed population of iPS 1016 and iPS 1031 and is reported as such in the manuscript. All cells lines tested negative for mycoplasma contamination which was carried out routinely.
Differentiation flasks were started 72 h after passage, by removing mTeSR1 medium and replacing with the protocol-appropriate medium and growth factor or small molecule supplements (Extended Data Table 1, Supplementary Table 1). Small molecules and signalling factors weprepared and stored as single-use aliquots. During feeds, the differentiating clusters were allowed to gravity-settle for 5–10 min, medium was aspirated and 300 ml of pre-warmed medium was added. All experiments involving human cells were approved by the Harvard University IRB and ESCRO committees.
Flow cytometry
Differentiated clusters, sampled from the suspension culture (1–2 ml), were dissociated using TrypLE Express (Gibco; 12604013) at 37 °C, mechanically disrupted to form single cells, fixed using 4% PFA for 30 min at room temperature and stored in PBS at 4 °C. For staining, fixed single cells were incubated in blocking buffer for 1 h at room temperature, then incubated in blocking buffer with primary antibodies (1 h at room temperature or overnight at 4 °C), washed three times with blocking buffer, incubated with secondary antibodies in blocking solution (1 h at room temperature), washed three times and resuspended in PBS + 0.5% BSA (Proliant; 68700). The blocking buffer was PBS + 0.1% saponin (Sigma; 47036) + 5% donkey serum (Jackson Labs; 100181–234). Stained cells were analysed using the LSR-II, Accuri C6 (BD Biosciences) or Attune NxT (Invitrogen) flow cytometers. An example gating strategy is shown in Supplementary Fig. 3. Results presented in this study are representative of more than a hundred independent v8 differentiations.
Immunofluorescence microscopy
Differentiated clusters were fixed in 4% PFA for 1 h at room temperature, washed and frozen in OCT and sectioned. Before staining, paraffin-embedded samples were treated with Histo-Clear to remove the paraffin. All slides were rehydrated via an ethanol gradient and incubated in boiling antigen retrieval reagent (10 mM sodium citrate, pH 6.0) for 30 min. For staining, slides were incubated in CAS block (ThermoFisher; 008120) with primary antibody overnight at 4 °C, washed three times, incubated in secondary antibody for 2 h at room temperature, washed, mounted in Vectashield with DAPI (Vector Laboratories; H-1200) or ProLong Diamond Antifade Mountant with DAPI, covered with coverslips and sealed with clear nail polish. Representative regions were imaged using Zeiss.Z2 with Apotome or Zeiss CellDiscoverer 7 microscopes. Images shown are representative of similar results in at least three biologically separate differentiations from matched or similar stages.
Antibodies
Primary antibodies (supplier; catalogue number, effective dilution).
Rat anti-C-peptide (DHSB; GN-ID4; 1:100), mouse anti-NKX6.1 (DHSB; F55A12; 1:50), rabbit anti-CHGA (Abcam; ab15160; 1:500), rabbit anti-SLC18A1 (Sigma; HPA063797; 1:300), rabbit anti-LMX1A (Sigma; HPA030088; 1:300), sheep anti-TPH1 (EMD Millipore; AB1541; 1:100), goat anti-5-HT (Immunostar; 20079; 1:1000), rabbit anti-SOX9 (Cell Marque; AC-0284RUO; 1:500), mouse anti-glucagon (Santa Cruz Biotech.; SC-514592; 1:300).
Secondary antibodies (supplier; catalogue number, all used at 1:300 dilution).
Anti-rat 594 (Life Tech.; A21209), anti-mouse 594 (Life Tech.; A21203), anti-mouse 647 (Life Tech.; A31571), anti-rabbit 488 (Life Tech.; A21206), anti-rabbit 594 (Life Tech.; A21209), anti-rabbit 647 (Life Tech.; A31573), anti-goat 647 (Life Tech.; A21447), anti-sheep 488 (Life Tech.; A11015), anti-rat 488 (Jackson labs.; 712–546-153), Anti-rat 405 (Abcam; ab175670).
Transplantation studies
Transplantation of differentiated clusters was carried out as previously described1. In brief, about 500 islet-equivalent (IEQ) human islets or ~5 × 10⁶ stage-6 native (day 10, non-reaggregated) SC-islet clusters were transplanted under the kidney capsule of male SCID beige mice (Jackson Laboratories) aged between 8 and 12 weeks. At the specified time after transplantation, kidneys containing grafts were dissected and fixed in 4% PFA overnight at 4 °C. The fixed kidneys were embedded in paraffin and sectioned for immunofluorescence staining, which was performed as described above. All animal studies were approved by the Harvard University IACUC.
Glucose stimulated insulin (GSIS) and serotonin secretion
Human islets (∼400 IEQ, Prodo Laboratories) or SC-islet clusters (equivalent to ∼4 × 10⁶ cells between 28 and 60 days of differentiation) were divided into four parts to collect technical triplicates of secreted products (assayed for insulin or serotonin) and total insulin content samples. Krebs buffer (KRB) was prepared: 128 mM NaCl, 5 mM KCl, 2.7 mM CaCl2, 1.2 mM MgSO4, 1 mM Na2HPO4, 1.2 mM KH2PO4, 5 mM NaHCO3, 10 mM HEPES (Life Technologies; 15630080), 0.1% BSA in deionized water. Clusters were washed twice with low-glucose (2.8 mM) KRB and were then loaded into the 24-well plate inserts (Millicell Cell Culture Insert; PIXP01250) and fasted in low-glucose KRB for 1 h to remove residual insulin in 37-°C incubators. Clusters were washed once in low-glucose KRB, incubated in low-glucose KRB for 1 h, and the supernatant was collected. Then, clusters were transferred to high-glucose (20 mM) KRB for 1 h, and the supernatant was collected. This sequence was repeated one additional time, and clusters were washed once between the high-glucose and second low-glucose incubation to remove residual glucose. Finally, clusters were incubated in KRB containing 2.8 mM glucose and 30 mM KCl (depolarization challenge) for 1 h, and then the supernatant was collected. Clusters were then dispersed into single cells using TrypLE Express, and cell number was counted automatically by a Vi-Cell (Beckman Coulter) to normalize insulin level by the cell number. Supernatant samples containing secreted insulin were processed using the human ultrasensitive insulin enzyme-linked immunosorbent assay (ELISA) (ALPCO, 80-INSHUU-E01.1) and the serotonin ELISA (ALPCO; 17-SERHU-E01-FST).
Dynamic perifusion assay for GSIS
Dynamic GSIS was performed as previously described20. Non-diabetic human islets from Prodolabs (100–250-μm-diameter-sized 25 IEQ islets were handpicked per sample, n = 3) and native or purified SC-β-cell clusters (100–250-μm-diameter-sized 25 clusters were handpicked per sample, n = 3), were assayed on a fully automated Perifusion System (BioRep). Chambers were sequentially perifused with 2.8 mM or 20 mM glucose, or 2.8 mM glucose with 30mM KCL in KRB buffer at a flow rate of 100 μl/min. Chambers were first perifused with low glucose (2.8 mM) for 1 h for fasting, and then 15 min for low-glucose incubation followed by high-glucose (20 mM) challenge for 30 min. Samples were then perifused with low glucose for 15 min, followed by low glucose and 30mM KCl for 15 min. Insulin concentrations in the supernatant were determined using an ultrasensitive insulin ELISA kit (Alpco; 80-INSHUU). The insulin secretion levels were normalized by total cell number (μIU per ml per 1,000 cells).
Re-aggregation procedure to remove non-endocrine cells
We optimized the re-aggregation procedure for scalability to ensure that our method—unlike previous, related techniques35,37–40—may be deployed at scales of several billion cells. SC-islets were dissociated into single cells at the end of stage-5 differentiation. Three hundred millilitres of SC-islet culture was washed in PBS and incubated in 25 ml of TrypLE Express for 20 min at 37 °C. Cells were then quenched with DMEM + 10% FBS and spun down, before resuspending in 10 ml of stage-6 culture medium. Remaining undissociated cell clusters were mechanically dissociated using a P1000 pipette. The single-cell suspension was further diluted to a volume of 50 ml with stage-6 medium, before being passed through a 40-μm mesh filter (pluriSelect) to remove any residual undissociated clusters. The dissociated single cells were counted and seeded into a spinner flask at a density of 1 million cells per millilitre in stage-6 medium, and cultured in an incubator at 37 °C with 70 rpm agitation. The endocrine cells self-aggregate into clusters within 24 h, whereas progenitor cells remain in the supernatant. After 48 h of culture, cells were fed by spinning down all the cells and resuspending in fresh stage-6 medium. Subsequent medium changes were done every 48 h using a 20-μm mesh filter (pluriSelect). The re-aggregated clusters enriched with endocrine cells were collected on the 20-μm mesh filter and reseeded back in the spinner flask with stage-6 medium at the original volume. Supernatant that contained single cells that passed through the 20-μm mesh filter was discarded.
Magnetic enrichment using CD49a
Stage-6 clusters (taken at stage 6, week 2) were dissociated as described in ‘Re-aggregation procedure to remove non-endocrine cells’, starting with 75 ml of stage-6 culture. The dissociated single cells were resuspended in sorting buffer (PBS + 1% BSA + 2 mM EDTA) and filtered through a 35-μm mesh filter. Cells were counted and resuspended at a density of 10 million cells per 300 μl in 15-ml conical tubes. Cells were stained at room temperature for 20 min using a 1:100 dilution of anti-human CD49a PE-conjugated (BD#559596) antibody, covered from light and agitated every 3 min. Stained cells were washed twice with 15 ml of sorting buffer by spinning down (5 min, 300g) and resuspending to their initial density of 10 million cells per 300 μl. To label with microbeads, 40 μl of anti-PE UltraPure MACS microbreads (Miltenyi 130–105-639) were added for each 10 million cells, and the cell solution was incubated for 15 min at 4 °C, agitated every 5 min. The stained cells were washed twice as above, and resuspended to a target density of 25–30 million cells per 500 μl. Volumes of 500 μl (containing no more than 30 million cells) were then magnetically separated on LS columns (Miltenyi 130–042-401) in a QuadroMACS separator (Miltenyi 130–090-976) using the recommend protocol. In brief, 500 μl of cells was added to a pre-washed column, washed with 3 ml of sorting buffer three times, removed from the separator and washed with a final volume of 5 ml. The final cell fractions from different columns were pooled. Successful PE enrichment was verified by live-cell flow cytometry on a Attune NxT (Invitrogen) flow cytometer, showing enrichment of 70% or more in a typical experiment. An example purification result is shown in Supplementary Fig. 3d. Although we did not use this method in the results presented in the paper, a second pass on an LS column will yield enrichment up to 90% CD49a+ cells (which gives downstream resulting SC-β-cell fractions of >90%), but will decrease the number of recovered cells. The enriched cells were diluted in stage-6 medium at a concentration of 500,000 cells per ml, and seeded on ultra-low-attachment 6-well plates (Corning #3471) with 2 ml of culture per well, placed on a rocker at 27 rpm, to carry out re-aggregation. Clusters were then fed every 48 h according to the stage 6 feeding schedule of the v8 protocol. We carried out re-aggregation controls in rockers for reasons of scale, although we note that endocrine enrichment is less efficient than in spinner flasks. Typical yields were approximately 10–15 million purified cells when starting with ~150 million total cells. Cells were assessed for function 7–9 days after purification.
Preparation of differentiated cells for sequencing
Differentiated clusters were prepared for single-cell RNA sequencing as follows: 1–2 ml suspension culture was sampled from the spinner flask, dissociated with TrypLE Express (5–15 min at 37 °C), quenched with cold PBS + 1% BSA, and gently dispersed with a P1000 pipette. Cells were then centrifuged (300 rpm, 3 min), resuspended in cold PBS+1% BSA and filtered through a 70-μm mesh filter. Centrifugation, resuspension and filtering was repeated a total of three times. Cells were then counted and resuspended to the working dilution for inDrops (100,000 cells per ml) in 1× PBS with 13% Optiprep (Sigma; D1556).
inDrops single-cell RNA sequencing
Single-cell RNA sequencing was carried out using the inDrops platform, as previously described4,41. Most samples were run using inDrops v2 barcoded hydrogel beads (1 Cell Bio, Harvard Single Cell Core), and one experiment used inDrops v3 beads (Harvard Single Cell Core). Following the inDrops protocol, each biological sample was split into several aliquots of 1,000–3,000 cells after encapsulation. At least two library aliquots were prepared separately from each sample, indexed using recommended index sequences, pooled and sequenced on a NextSeq 500 (Illumina). The first set of experiments (stages 3–6 time course) involved sequencing several thousand cells per time point, and provided us with an estimate of the expected cell-type diversity. For the following stage-5 and −6 time courses, we used separate flasks as technical replicates and measured thousands of cells from each individual time point, which increased our capacity for identifying rare populations or subtle changes in our major cell types.
inDrops raw data processing
Sequencing reads were processed according to the previously published inDrops pipeline (https://github.com/indrops/indrops/). To run the pipeline, a reference index was built from the Ensembl GRCh38 human genome assembly and the GRCh38.88 transcriptome annotation. In brief, the pipeline trims reads using Trimmomatic, uses Bowtie 1.1.1 to map reads to the human transcriptome and quantifies transcript expression counts using the unique molecular identifiers, (referred to as UMIFMs). For each library, the UMIFM count matrix was filtered as follows: genes with less than 3 counts were removed; mitochondrially encoded and under-annotated genes were removed; cells with less than 750 (stage-5 and −6 time courses) or 1,000 (all other data sets) UMIFM counts were removed. Variation in the total counts of each individual cell was removed by normalizing the sum of counts of each cell to 10,000. These normalized counts were used as input below and were converted to TPM values for data presentation.
Dimensionality reduction and clustering
Dimensionality reduction and clustering for each dataset was performed by broadly following a modified version of a previously published approach42. Using the unnormalized counts, highly variable genes were identified as previously described42, by finding outliers with high coefficients of variations as a function of mean expression. Then, within each dataset, depth-normalized counts values were further z-normalized per gene, to yield z-normalized values. The z-normalized values of variable genes per dataset were used as input for principal component analysis. When computing principal components for the stage-5 datasets, we identified genes correlated with cell-cycle marker TOP2A (Pearson correlation greater 0.15), and excluded them. Clustering was carried out using Leiden community detection43, a recently published improvement on Louvain community detection. For community detection, we created a mutual k-nearest neighbour graph by keeping only the mutual edges of the 250 (stage-5 and −6 time course) or 100 (other datasets) nearest neighbours of cells in the space of the first 50 principal components. When necessary, we repeated community detection on a subset of the cells to improve the cell annotations. We noted that keeping only mutual edges improved our ability to resolve SST+HHEX+ cells, which correspond to the cluster that is the most difficult to correctly distinguish in the data. For each dataset, this dimensionality reduction procedure followed by clustering was carried out twice per dataset. A first pass was used to identify clusters with lower average library sizes, lack of expression markers (as defined using the previously published42 score) or clear doublet expression patterns. For the stage 5 and stage 6 time courses, this first pass of filtering was carried out once per time point, and once again for the complete datasets (and the full datasets were used thereafter). The filtered cells were ignored in the second pass of clustering. After this second pass of clustering, individual clusters were assigned an identity (and, where appropriate, merged with others) by correlating their expression profiles to a set of predefined marker genes for each population. After clusters were interpreted, we trained a scikit-learn random forest classifier of the clusters and used out-of-bootstrap predictions to assign final labels to the cells. We also used this classifier to recover cells removed in the first-pass filter, by retaining cells with a predicted label that had a 66% majority across random trees, recovering approximately 5% of the cells across datasets. These retained cells were incorporated in downstream analyses but ignored when finding principal components. t-SNE projections were computed with the Python wrapper of the C. Barnes-Hut t-SNE implementation (https://github.com/lvdmaaten/bhtsne), using the first 25 principal components. To compute mean gene-expression levels within a label, we summed UMIFM counts for all cells assigned to that label and computed TPM normalization on these summed counts. We also computed the fraction of cells that express a given gene within a cluster, using 1% of the maximal expression of that gene (in any cell of the same dataset) as a threshold for qualifying the gene as expressed. The correlation of groups of cells (as in Fig. 2f, Extended Data Fig. 1j, m) was computed by first selecting 2,000 highly variable genes across the whole dataset, computing the mean expression within each group of cells (as above), z-normalizing each gene across the different classes, and then computing Pearson r correlation coefficients between the samples for these 2,000 genes.
Diffusion pseudotime analysis
Diffusion pseudotime analysis44 was performed using the Scanpy package45, using 100 nearest-neighbours in 10 unscaled principal components, to find 10 diffusion components. We then computed the diffusion pseudotime from a manually specified root cell, and ordered cells by their rank along diffusion pseudotime branches (if any). In the stage-5 branching analysis, cells assigned to the SC-β or SC-EC cell clusters were assigned to that branch, whereas progenitor cells were randomly assigned to a branch. Pseudotime along each branch scales from 0 to 1, corresponding to the ranked ordering of the cells but adjusting the rank of the progenitors such that both branches diverge from the common progenitors at a value of 0.5. To identify genes with an expression that is a function of pseudotime, we implemented a version of the BEAM46 model. For unbranched pseudotime trajectories, two negative binomial generalized linear models were fit using the VGAM R package. The first was a complete model that incorporated a natural spline function of pseudotime. The second was a reduced model that does not include the pseudotime spline term. For branched trajectories, a second complete model incorporated the branch term for each cell as a regression variable. Fold changes between branches, or across the pseudotime trajectories, were then computed using the regressed values. Each regression was run on all the cells being analysed in that specific analysis, the resulting sample sizes for the regressions were: 10,034 (number of SC-β cells) for the analysis in Figs. 2g–i, 5; 131 (number of progenitors at stage 5, day 0) and 5,109 (number of progenitors at stage 5, day 1) for the analyses in Extended Data Fig. 8c–e; and 18,099 (number of progenitors, endocrine induction, SC-EC or SC-β cells) for the analysis in Fig. 5e–g. As done in the BEAM publication46, the likelihood of the data under the complete and reduced models was compared using a likelihood ratio test (with three degrees of freedom) and reported as an FDR (α = 0.001)-corrected q-value. We note that, although this provides a useful relative measure of significance, the significance level is probably inflated because this analysis does not account for the fact that the pseudotime values of cells were derived from some of the genes tested in the first place47. When reporting fold changes derived from the pseudotime analysis, a floor on predicted expression (TPM = 10) is enforced to prevent artificially high fold changes. Then, fold changes between the start and end of the trajectories are calculated by comparing the mean predicted expression in the first and last 5% of the trajectory.
Analysis of human pancreatic islet inDrops data
Raw sequencing reads from a previous publication5 were reprocessed as described in the ‘inDrops raw data processing’ and ‘dimensionality reduction and clustering’ sections, to align them the same reference as our in vitro sequencing data. UMIFM counts were converted to TPM for expression analyses as above. Finally, clustering was carried out as described above to identify the same classes of cells as in the original publication5.
Re-analysis of β-cell EED2 knockout data
Processed RNA sequencing data were downloaded from GEO (accession number GSE110648). The read-count values were used as input to create linear models using Voom48 and Limma49. The original data contain three different genotypes (wild-type, heterozygous and homozygous EED2-floxed alleles) analysed at two time points (8 and 25 weeks after induction of knockout). All conditions have triplicate samples except for the heterozygous and homozygous samples at 25 weeks (which have duplicates), for a total of 15 samples. We used a design–contrast parameterization to first define replicate groups across all 6 conditions in the dataset, and to subsequently identify genes that are differentially expressed between the 25 weeks post-EED2 knockout condition for wild-type, heterozygous and homozygous EED2-floxed alleles. We corrected for multiple hypothesis testing using the Benjamini–Hochberg FDR procedure with α = 0.05.
Re-analysis of sorted NKX6.1–GFP+ or NKX6.1–GFP− populations
Complete statistical analyses from a previous publication29. were downloaded from the supplementary materials of that publication. The reported mean expression, fold change and significance values were used directly to generate the relevant figures.
Gene set enrichment analysis
Gene set enrichment analysis (GSEA) was performed using GSEA 3.0 to carry out ‘pre-ranked’ analyses, using as input the fold change between NKX6.1+ progenitors, SC-β cells and islet β cells, or the fold change that tracks SC-β-cell pseudotime expression. The analysis was run including the Hallmark (h.all.v6.2) and Canonical Pathway categories (c2.cp.v6.2) from MSigDB, as well as the custom gene sets defined in Extended Data Fig. 3 in one single analysis, to ensure the appropriate correction for multiple hypothesis testing. We included set sizes as small as five genes, but otherwise run using the default settings. The results from GSEA are included in Supplementary Tables 3, 4.
Extended Data
Extended Data Fig. 1 |. Comparison of two SC-β-cell protocol variants and resulting cell types.
a–c, Immunofluorescence imaging of differentiated (v8, stage 6, day 13) SC-islets showing staining of relevant markers. a, SC-β cells, which are typically positioned in the periphery, are positive for both NKX6.1 and C-peptide (fragment of proinsulin). b, SC-EC cells are positive for SLC18A1, an enterochromaffin cell marker. These cells are also present in the periphery. c, Non-endocrine cells, which are marked by SOX9, are most commonly found near the centre of SC-islets. Scale bars, 100 μm. d, e, Summary of changes in stages 3 and 4 in protocols x1 (a) and x2 (b) (see Extended Data Table 1 for protocol summaries), and representative flow cytometry results at the end of stages 4 and 6. f–i, t-SNE projection of cells sampled from the ends of stages 3–6 of protocol x2. Cells in f–i are coloured according to their assigned cluster. Horizontal bars indicate cell-type proportions. Related to Fig. 1d–g. j, Comparison of cell populations from protocols x1 and x2. Correlation is computed using the z-scores of mean TPM values (for each cluster) of 2,000 high-variance genes. Rows and columns are ordered using hierarchical clustering. Cells are labelled as in f–i and Fig. 1d–g. k, l, t-SNE projection of stage 6 from three differentiations, coloured by cell type (k) and by differentiation (l). m, Correlation of cell populations derived from HUES8 (embryonic stem cells, v4 and x3) and iPS1016/31 (induced pluripotent stem cells, v4). Colours are the same as in k. Correlation is computed as in j.
Extended Data Fig. 2 |. Functional assay of GSIS during stage-6 time course.
a, Design for sequential GSIS assay. b, Complete data for three independent flasks, assayed across several weeks. Circles are individual technical triplicates and bars show mean of those triplicates. c, Complete data for cadaveric human islets (seven donors), run alongside samples from b.
Extended Data Fig. 3 |. Stage-6 SC-β cells express characteristic β-cell markers.
a, b, t-SNE projection of stage-6 time-course data shaded by sampling time (a) and by representative marker genes (b). Expression is normalized relative to maximum value and smoothed over neighbouring cells. c, Expression profiles for key genes necessary for β-cell function. Shading displays mean expression (TPM, log-scaled) and diameter denotes fractional expression. d, e, Comparison of global expression between human islet β cells and in vitro progenitors (d) and SC-β cells (e). Note the shift in gene expression from progenitors to SC-β cells. All genes shown in all panels from c are circled in red. f, Results from GSEA show that gene sets from c are significantly upregulated during differentiation. Value plotted is -log10 of the GSEA-reported FDR q-value (capped at 10), with sign (positive or negative) showing the direction of the effect (that is, purple positive values are upregulated in SC-β cells compared to NKX6.1 progenitors).
Extended Data Fig. 4 |. Comparison of SC-β and SC-α cells to each other, and their islet counterparts.
a, Insulin and glucagon expression in SC-β (purple distributions) and SC-α cells (red distributions) during several weeks of stage 6, shown as violin plots of SC-β or SC-α cells from that particular time point. The connected lines connect the medians of each population at each time point. b, Identification of genes enriched in cadaveric-islet α cells and islet β cells, from previously published data5. c, Heat map of expression level of genes from b, shown for islet α, SC-α, SC-β and islet β cells. d, Genes enriched in islet β cells are upregulated in SC-β cells, and genes enriched in α cells are upregulated in SC-α cells. The displayed P value is computed using a two-sided Wilcoxon rank-sum test. In the box plot, boxes extend from first to third quartiles, whiskers extend from 5th to 95th percentiles, central line indicates median and box notching indicates 95th percentile confidence interval for median.
Extended Data Fig. 5 |. SC-EC cells secrete serotonin and exist in other protocols.
a, Schematic of serotonin synthesis from tryptophan. Enterochromaffin cells use TPH1, whereas serotoninergic neurons use TPH2 for the first and rate-limiting synthesis step. b, Serotonin release during sequential challenges of low and high glucose, followed by KCl depolarization. Top, clusters from three independent SC-β-cell protocol differentiations. Bottom, human cadaveric islets from two donors. Symbols show values of individual replicates for each sample (different clusters from the same sample are split and measured separately). P values computed using two-sided Wilcoxon rank-sum test. NS, non-significant with P > 0.05. c, d, Expression of enterochromaffin marker genes (shown in blue) is detectable in bulk RNA-sequencing data (from a previous publication29 ), and enriched via sorting of NKX6.1–GFP + cells, shown as fold change, mean expression and differential expression q-values. Positive fold change indicates higher expression in NKX6.1–GFP + cells. Enrichment of SC-EC-cell markers is comparable to β-cell markers (shown in purple) and opposite of α-cell markers (shown in red). All values shown are directly reproduced from results that were previously computed and deposited29. e, Flow cytometry shows that SLC18A1 is co-expressed with NKX6.1+ in SC-EC cells of v8 SC-β-cell protocol differentiations. This example is representative across more than 100 independent differentiations. f, Comparison of gene expression between wild-type mouse islets and mouse islets 25 weeks after β-cell-specific Polycomb Repressive Complete 2 ablation via Eed knockout. Purple genes are examples of downregulated β-cell-identity genes, blue genes represent serotonin–enterochromaffin signature. q-values are FDR-corrected (α = 0.05) P values from Limma differential expression analysis.
Extended Data Fig. 6 |. Characterization of non-endocrine cells from stage-6 time course.
a, b, t-SNE projection of non-endocrine cells from stage-6 time course, shaded by collection day (a) or by genes relevant to cell identity (b). Expression is normalized relative to maximum value, and smoothed over neighbouring cells. c, t-SNE projection shaded by assigned cluster and bar charts of cellular fraction in each cluster by week of differentiation. d, Gene expression of population-specific markers for each subpopulation of non-endocrine cells. Shading displays mean expression (z-normalized TPM) and diameter denotes fractional expression.
Extended Data Fig. 7 |. Re-aggregation is a scalable, function-preserving method to enrich for endocrine cells.
a, Schematic of re-aggregation procedure to remove non-endocrine cells. Cells are enzymatically dissociated and re-aggregated during continued suspension culture. Non-endocrine cells fail to adhere and are removed by filtration. b, Schematic of CD49a enrichment procedure to produce SC-β cell enriched clusters. Dissociated cells are stained with anti-CD49a PE-conjugated antibody, incubated with anti-PE magnetic microbeads and magnetically separated. The enriched cells are re-aggregated in six-well plates on a rocker. c, t-SNE projection of cells sequenced from native and re-aggregated clusters from a single differentiation show a strong depletion of the non-endocrine population. Cells in both panels were differentiated using protocol v8. d, Immunofluorescence staining for C-peptide, GCG and SLC18A1 shows distinct neighbourhoods in re-aggregated clusters (protocol v8). Images shown are maximum intensity projections from z-stacks. Each panel shows separate representative clusters stained for all markers. Scale bars, 100 μm. e, f, Representative flow cytometry analysis of endocrine cell abundance (from protocol v8), before and after re-aggregation. Endocrine cells express CHGA. g, Summary of population composition (as assayed by flow cytometry) in 60 re-aggregated and 41 native independent differentiations, carried out using protocol v8. Re-aggregations were carried out in spinner flasks. P value computed using two-sided Wilcoxon rank-sum test. In g, h box plots, boxes extend from first to third quartiles, whiskers extend from 5th to 95th percentiles, central line indicates median and box notching indicates 95th percentile confidence interval for median. h, Stimulation index (insulin released at 20 mM glucose versus insulin released at 2 mM) of 52 independent protocol v8 differentiations, with paired native versus re-aggregated comparisons. P value computed using two-sided Wilcoxon signed-rank test. i, Complete data for static GSIS assays, performed as in Extended Data Fig. 2, corresponding to stimulation indices shown in Fig. 4d. Circles are individual technical triplicates and bars show mean of those triplicates. j, Dynamic perifusion assay of glucose-responsive insulin secretion of human islets, native SC-β-cell clusters (stage 6, day 22, v8) and matched SC-β islets produced via magnetic sorting for CD49a. Each point is the mean of three technical replicates, and the vertical bar indicates the s.e. across those triplicates. k, Area under the curve comparing the first low-glucose stimulation and the high-glucose stimulation, normalized to equal effective time in each treatment.
Extended Data Fig. 8 |. Stage-5 time-course markers and progenitor population heterogeneity.
a, b, t-SNE projection of stage-5 time-course data shaded by collection day (a) and by population-marker genes (b). Expression is normalized relative to maximum value, and smoothed over neighbouring cells. c, Pseudotime analysis of day 0 (top) and day 1 (bottom) progenitor cells. Shading on each t-SNE shows assigned pseudotime value of each cell. d, Pseudotime ordering of progenitor cells from stage 5 day 0 (top row) and day 1 (bottom row), showing population heterogeneity among early progenitors. Individual cells are shown as dots, shaded as in c. Gene expression predicted from pseudotime regression shown as overlaid line. e, Summary of stage-5 (day 0) heterogeneity captured by pseudotime analysis. Fold change between start and end of pseudotime ordering. q-value from likelihood ratio test of model with and without pseudotime. f, Heat map of receptors, ligands and signalling effectors that are dynamically expressed across stage-5 populations. Shading displays mean expression (z-normalized TPM) and diameter denotes fractional expression.
Extended Data Table 1 |. Specification of differentiation protocols used in the study.
Summary of the different versions of the SC- -cell protocol used throughout this study.
| Production protocols | Experimental protocols | ||||||
|---|---|---|---|---|---|---|---|
| Protocol version | v1 | v4 | v8 | x1 | x2 | x3 | |
| Previous publications | Pagliuca et al. (2014) | Millman et al. (2016) | |||||
| Stage 1 | duration base media | 3 days S1 |
3 days S1 |
3 days S1 |
3 days S1 |
3 days S1 |
3 days S1 |
| factors | Activin A CHIR99021 |
Activin A CHIR99021 |
Activin A CHIR99021 |
Activin A CHIR99021 |
Activin A CHIR99021 |
Activin A CHIR99021 |
|
| Stage 2 | duration base media |
3 days S2 |
3 days S2 |
3 days S2 |
2 days S2 |
2 days S2 |
2 days S2 |
| factors | KGF | KGF | KGF | KGF | KGF | KGF | |
| Stage 3 | duration base media |
2 days S3 |
2 days S3 |
2 days S3 |
2 days S3 |
2 days S3 |
2 days S3 |
| factors | RA KGF SANT1 LDN193189 PdBU |
RA KGF SANT1 LDN193189 PdBU Y27632 |
RA KGF SANT1 LDN193189 PdBU Y27632 |
RA KGF |
RA LDN193189 |
RA KGF |
|
| Stage 4 | duration base media |
5 days S3 |
5 days S3 |
5 days S3 |
5 days S3 |
5 days S3 |
5 days S3 |
| factors | KGF SANT1 RA |
KGF SANT1 RA Y27632 Activin A |
KGF SANT1 RA Y27632 Activin A |
KGF | RA LDN193189 |
KGF | |
| Stage 5 | duration base media | 7 days BE5 |
7 days BE5 |
7 days BE5 |
7 days BE5 |
7 days BE5 |
7 days BE5 |
| factors | XXI Alk5i T3 RA SANT1 Betacellulin |
XXI Alk5i T3 RA SANT1 Betacellulin |
XXI Alk5i T3 RA SANT1 Betacellulin |
XXI Alk5i T3 RA SANT1 Betacellulin |
XXI Alk5i T3 RA SANT1 Betacellulin |
XXI Alk5i T3 RA SANT1 Betacellulin LDN193189 |
|
| Stage 6 | duration base media | … CMRLS (+10% FBS) |
… CMRLS (+ 10% FBS) |
… S3 |
… CMRLS (+10% FBS) |
… CMRLS (+10% FBS) |
… MCDB131 (+2% BSA) |
| factors | Alk5i T3 |
Alk5i T3 |
none | Alk5i T3 |
Alk5i T3 |
none | |
Extended Data Table 2 |. Summary of all cell populations identified in the study.
We list key markers for the identification of each population, the datasets in which these populations were identified and—for rare populations—a description of their relation to other populations.
| Key markers | Description | Datasets identified in | |
|---|---|---|---|
| Core populations | |||
| SC-beta cells | INS+, NKX6.1+, ISL1+, PAX4+, PDX1+ | See main text. | All (stages 5 and later) |
| SC-alpha cells (Poly-hormonal cells) | GCG+, ARX+, IRX2+, CD36+, ISL1+ | See main text. Insulin expression is reduced during Stage 6. | All (stages 4 or later) |
| SC-EC cells | TPH1+, LMX1A+, SLC18A1+, FEV+ (ISL1-, PDX1-) | See main text. | All (stages 5 and later) |
| Non-endocrine cells | CHGA- | See main text. | All (stages 5 and later) |
| Endocrine induction (transient) | NEUROG3+ | See main text. | • Stage 5 time course |
| NKX6.1+ progenitors | NKX6.1+, PDX1+, PTF1A+ (CHGA-) | See main text. | • Stages 3–6 time course (Stage 4) • Stage 5 time course (day 0) |
| PDX1+ progenitors | PDX1+ (PTF1A-, NKX6.1-) | See main text. | • Stages 3–6 time course (Stage 3) |
| Rare populations | |||
| SST+/HHEX+ | CHGA+, ISL1+ | See main text. | • All (stages 4 and later) |
| FOXJ1+ | CHGA+, ENKUR+ | Seen only from protocol x1. Endocrine population with primary cilia signature resembling endocrine induction. | • Stages 3–6 time course (protocol x1, Stages 5 & 6) |
| FEV+/PAX4+ | CHGA+, FEV+, ISL1-PAX4 | Similar to cells in ‘late’ endocrine induction. Likely represents cells that prematurely (during Stage 4) begin endocrine induction towards SC-beta and SC-EC lineages. | • Stages 3–6 time course (Stage 4) • Stage 5 time course (days 0–4) |
| PHOX2A+ | PHOX2A+, TPH1+, FEV+, KLK+, ENC+, | A transient population (observed only near end of Stage 5, early in Stage 6) sharing similarity with SC-EC cells. | • Stage 6 time course (week 0) • Stage 5 time course (days 4+) |
| GAP43+ | GAP43+, DPYSL3+, MAP1B+, MAPT+, SOX11+ | Late Stage 6 population (week 1+) uniquely expressing axonal projection genes. | • Stage 6 time course (weeks 1+) |
| ONECUT3+ | ONECUT3+, TM4SF+, ID1+, GChigh | Late Stage 6 population (week 1+).. | • Stage 6 time course (weeks 1+) |
Supplementary Material
Acknowledgements
We thank A. Ratner, R. Zilionis, S. Wolock, J. Guo and L. Ye for technical support; A. Klein, D. Kotliar, E. Hodis, Y. Reshef, M.A. Nagy, the CGTA discussion group, R. Pop, C. Kayatekin and L.Schissler for useful discussions and feedback on the manuscript; and the Bauer Core Facility at Harvard University and the BPF Next-Gen Sequencing Core Facility at Harvard Medical School for their sequencing support. D.A.M. is an Investigator of the Howard Hughes Medical Institute. A.V. is funded by the Harvard University Presidential Scholar fund, Harvard Stem Cell Institute Medical Scientist MD/PhD Training Fellowship and Harvard/MIT MD/PhD program. A.L.F. is supported by NIH T32GM007226. This work was supported by grants from the Harvard Stem Cell Institute, Helmsley Charitable Trust, JDRF and the JPB Foundation. This research was performed using resources and/or funding provided by the NIDDK-supported Human Islet Research Network (HIRN, RRID:SCR_014393; https://hirnetwork.org; UC4 DK104165–04 and UC4 DK104159–03).
Footnotes
Reviewer information Nature thanks Peter Butler, Heiko Lickert and the other anonymous reviewer(s) for their contribution to the peer review of this work.
Competing interests: D.A.M. is a founder and advisor of Semma Therapeutics. G.H., Y.-C.P., F.W.P. and M.G. are employees of Semma Therapeutics. D.A.M., F.W.P., Q.P.P., M.G. and A.V. are inventors on patents and patent applications related to β-cell-directed differentiation and purification strategies. All other authors declare no conflicts of interests.
Additional information
Extended data is available for this paper at
Supplementary information is available for this paper at
Publisher’s note: Springer Nature remains neutral with regard to jurisdictional claims in published maps and institutional affiliations.
Data availability
Raw and processed single-cell RNA sequencing data have been deposited in the Gene Expression Omnibus under accession number GSE114412. Any other relevant data are available from the corresponding author upon reasonable request.
Code availability
The analysis code is available at https://github.com/meltonlab/scbeta_indrops.
Reporting summary
Further information on research design is available in the Nature Research Reporting Summary linked to this paper.
Online content Any methods, additional references, Nature Research reporting summaries, source data, statements of data availability and associated accession codes are available at
References
- 1.Pagliuca FW. et al. Generation of functional human pancreatic β cells in vitro. Cell 159, 428–439 (2014). [DOI] [PMC free article] [PubMed] [Google Scholar]
- 2.Rezania A. et al. Reversal of diabetes with insulin-producing cells derived in vitro from human pluripotent stem cells. Nat. Biotechnol 32, 1121–1133 (2014). [DOI] [PubMed] [Google Scholar]
- 3.Russ HA. et al. Controlled induction of human pancreatic progenitors produces functional beta-like cells in vitro. EMBO J. 34, 1759–1772(2015). [DOI] [PMC free article] [PubMed] [Google Scholar]
- 4.Klein AM. et al. Droplet barcoding for single-cell transcriptomics applied to embryonic stem cells. Cell 161, 1187–1201 (2015). [DOI] [PMC free article] [PubMed] [Google Scholar]
- 5.Baron M. et al. A single-cell transcriptomic map of the human and mouse pancreas reveals inter- and intra-cell population structure. Cell Syst. 3, 346–360.e4 (2016). [DOI] [PMC free article] [PubMed] [Google Scholar]
- 6.Segerstolpe Å. et al. Single-cell transcriptome profiling of human pancreatic islets in health and type 2 diabetes. Cell Metab. 24, 593–607 (2016). [DOI] [PMC free article] [PubMed] [Google Scholar]
- 7.Xin Y. et al. RNA sequencing of single human islet cells reveals type 2 diabetes genes. Cell Metab. 24, 608–615 (2016). [DOI] [PubMed] [Google Scholar]
- 8.Muraro MJ. et al. A single-cell transcriptome atlas of the human pancreas. Cell Syst. 3, 385–394.e3 (2016). [DOI] [PMC free article] [PubMed] [Google Scholar]
- 9.Enge M. et al. Single-cell analysis of human pancreas reveals transcriptional signatures of aging and somatic mutation patterns. Cell 171, 321–330.e14 (2017). [DOI] [PMC free article] [PubMed] [Google Scholar]
- 10.Byrnes LE. et al. Lineage dynamics of murine pancreatic development at single-cell resolution. Nat. Commun 9, 3922 (2018). [DOI] [PMC free article] [PubMed] [Google Scholar]
- 11.Scavuzzo MA. et al. Endocrine lineage biases arise in temporally distinct endocrine progenitors during pancreatic morphogenesis. Nat. Commun 9, 3356 (2018). [DOI] [PMC free article] [PubMed] [Google Scholar]
- 12.Sharon N. et al. A peninsular structure coordinates asynchronous differentiation with morphogenesis to generate pancreatic islets. Cell 176, 790–804 (2019). [DOI] [PMC free article] [PubMed] [Google Scholar]
- 13.Xie R. et al. Dynamic chromatin remodeling mediated by polycomb proteins orchestrates pancreatic differentiation of human embryonic stem cells. Cell Stem Cell 12, 224–237 (2013). [DOI] [PMC free article] [PubMed] [Google Scholar]
- 14.Hrvatin S. et al. Differentiated human stem cells resemble fetal, not adult, β cells. Proc. Natl Acad. Sci. USA 111, 3038–3043 (2014 [DOI] [PMC free article] [PubMed] [Google Scholar]
- 15.Petersen MBK. et al. Single-cell gene expression analysis of a human ESC model of pancreatic endocrine development reveals different paths to β-cell differentiation. Stem Cell Reports 9, 1246–1261 (2017). [DOI] [PMC free article] [PubMed] [Google Scholar]
- 16.Rutter GA, Pullen TJ, Hodson DJ & Martinez-Sanchez A. Pancreatic beta-cell identity, glucose sensing and the control of insulin secretion. Biochem. J 466, 203–218 (2015). [DOI] [PubMed] [Google Scholar]
- 17.Thurmond DC. in Mechanisms of Insulin Action (eds Pessin JE & Saltiel AR) 52–70 (Springer, New York: 2007). [Google Scholar]
- 18.Aslamy A & Thurmond DC. Exocytosis proteins as novel targets for diabetes prevention and/or remediation? Am. J. Physiol 312, R739–R752 (2017). [DOI] [PMC free article] [PubMed] [Google Scholar]
- 19.Arda HE. et al. Age-dependent pancreatic gene regulation reveals mechanisms governing human β cell function. Cell Metab. 23, 909–920 (2016). [DOI] [PMC free article] [PubMed] [Google Scholar]
- 20.Blum B. et al. Functional beta-cell maturation is marked by an increased glucose threshold and by expression of urocortin 3. Nat. Biotechnol 30, 261–264 (2012). [DOI] [PMC free article] [PubMed] [Google Scholar]
- 21.Thorrez L. et al. Tissue-specific disallowance of housekeeping genes: the other face of cell differentiation. Genome Res. 21, 95–105 (2011). [DOI] [PMC free article] [PubMed] [Google Scholar]
- 22.Kelly OG. et al. Cell-surface markers for the isolation of pancreatic cell types derived from human embryonic stem cells. Nat. Biotechnol 29, 750–756 (2011). [DOI] [PubMed] [Google Scholar]
- 23.Riedel MJ. et al. Immunohistochemical characterisation of cells co-producing insulin and glucagon in the developing human pancreas. Diabetologia 55, 372–381 (2012). [DOI] [PubMed] [Google Scholar]
- 24.Spijker HS. et al. Loss of β-cell identity occurs in type 2 diabetes and is associated with islet amyloid deposits. Diabetes 64, 2928–2938 (2015). [DOI] [PubMed] [Google Scholar]
- 25.Bellono NW. et al. Enterochromaffin cells are gut chemosensors that couple to sensory neural pathways. Cell 170, 185–198.e16 (2017). [DOI] [PMC free article] [PubMed] [Google Scholar]
- 26.Haber AL. et al. A single-cell survey of the small intestinal epithelium. Nature 551, 333–339 (2017). [DOI] [PMC free article] [PubMed] [Google Scholar]
- 27.Grün D. et al. Single-cell messenger RNA sequencing reveals rare intestinal cell types. Nature 525, 251–255 (2015). [DOI] [PubMed] [Google Scholar]
- 28.Martin AM. et al. The nutrient-sensing repertoires of mouse enterochromaffin cells differ between duodenum and colon. Neurogastroenterol. Motil 29, e13046 (2017). [DOI] [PubMed] [Google Scholar]
- 29.Gupta SK. et al. NKX6.1 induced pluripotent stem cell reporter lines for isolation and analysis of functionally relevant neuronal and pancreas populations. Stem Cell Res. 29, 220–231 (2018). [DOI] [PubMed] [Google Scholar]
- 30.Almaça J. et al. Human beta cells produce and release serotonin to inhibit glucagon secretion from alpha cells. Cell Reports 17, 3281–3291 (2016). [DOI] [PMC free article] [PubMed] [Google Scholar]
- 31.Goyvaerts L, Schraenen A & Schuit F. Serotonin competence of mouse beta cells during pregnancy. Diabetologia 59, 1356–1363 (2016). [DOI] [PubMed] [Google Scholar]
- 32.Ohta Y. et al. Convergence of the insulin and serotonin programs in the pancreatic β-cell. Diabetes 60, 3208–3216 (2011). [DOI] [PMC free article] [PubMed] [Google Scholar]
- 33.Lu TT-H. et al. The polycomb-dependent epigenome controls β cell dysfunction, dedifferentiation, and diabetes. Cell Metab. 27, 1294–1308.e7 (2018). [DOI] [PMC free article] [PubMed] [Google Scholar]
- 34.Britt LD, Stojeba PC, Scharp CR, Greider MH & Scharp DW. Neonatal pig pseudo-islets: a product of selective aggregation. Diabetes 30, 580–583 (1981). [DOI] [PubMed] [Google Scholar]
- 35.Agulnick AD. et al. Insulin-producing endocrine cells differentiated in vitro from human embryonic stem cells function in macroencapsulation devices in vivo. Stem Cells Transl. Med 4, 1214–1222 (2015). [DOI] [PMC free article] [PubMed] [Google Scholar]
- 36.Tsoukalas N. et al. Pancreatic carcinoids (serotonin-producing pancreatic neuroendocrine neoplasms): report of 5 cases and review of the literature. Medicine (Baltimore) 96, e6201 (2017). [DOI] [PMC free article] [PubMed] [Google Scholar]
- 37.Hilderink J. et al. Controlled aggregation of primary human pancreatic islet cells leads to glucose-responsive pseudoislets comparable to native islets. J. Cell. Mol. Med 19, 1836–1846 (2015). [DOI] [PMC free article] [PubMed] [Google Scholar]
- 38.Ramachandran K, Peng X, Bokvist K & Stehno-Bittel L. Assessment of re-aggregated human pancreatic islets for secondary drug screening. Br. J. Pharmacol 171, 3010–3022 (2014). [DOI] [PMC free article] [PubMed] [Google Scholar]
- 39.Spijker HS. et al. Conversion of mature human β-cells into glucagon-producing α-cells. Diabetes 62, 2471–2480 (2013). [DOI] [PMC free article] [PubMed] [Google Scholar]
- 40.Zuellig RA. et al. Improved physiological properties of gravity-enforced reassembled rat and human pancreatic pseudo-islets. J. Tissue Eng. Regen. Med 11, 109–120 (2017). [DOI] [PubMed] [Google Scholar]
- 41.Zilionis R. et al. Single-cell barcoding and sequencing using droplet microfluidics. Nat. Protocols 12, 44–73 (2017). [DOI] [PubMed] [Google Scholar]
- 42.Zeisel A. et al. Molecular architecture of the mouse nervous system. Cell 174, 999–1014.e22 (2018). [DOI] [PMC free article] [PubMed] [Google Scholar]
- 43.Traag V, Waltman L & van Eck NJ. From Louvain to Leiden: guaranteeing well-connected communities. Preprint at https://arxiv.org/abs/1810.08473 (2018). [DOI] [PMC free article] [PubMed]
- 44.Haghverdi L, Büttner M, Wolf FA, Buettner F & Theis FJ. Diffusion pseudotime robustly reconstructs lineage branching. Nat. Methods 13, 845–848 (2016). [DOI] [PubMed] [Google Scholar]
- 45.Wolf FA, Angerer P & Theis FJ. SCANPY: large-scale single-cell gene expression data analysis. Genome Biol. 19, 15 (2018). [DOI] [PMC free article] [PubMed] [Google Scholar]
- 46.Qiu X. et al. Single-cell mRNA quantification and differential analysis with Census. Nat. Methods 14, 309–315 (2017). [DOI] [PMC free article] [PubMed] [Google Scholar]
- 47.Zhang JM, Kamath GM & Tse DN. Towards a post-clustering test for differential expression. Preprint at https://www.biorxiv.org/content/10.1101/463265v1 (2018).
- 48.Law CW, Chen Y, Shi W & Smyth GK. voom: Precision weights unlock linear model analysis tools for RNA-seq read counts. Genome Biol. 15, R29 (2014). [DOI] [PMC free article] [PubMed] [Google Scholar]
- 49.Smyth GK. Linear models and empirical bayes methods for assessing differential expression in microarray experiments. Stat. Appl. Genet. Mol. Biol 3, article3 (2004). [DOI] [PubMed] [Google Scholar]
Associated Data
This section collects any data citations, data availability statements, or supplementary materials included in this article.


