Abstract
Macrophages comprise a major component of the human innate immune system that is involved in maintaining homeostasis and responding to infections or other insults. Besides cytokines and chemokines, macrophages presumably influence the surrounding environment by secreting various types of metabolites. Characterization of secreted metabolites under normal and pathological conditions is critical for understanding the complex innate immune system. To investigate the secreted metabolome, we developed a novel workflow consisting of one Reverse Phase (RP) C18 column linked in tandem with a Cogent cholesterol modified RP C18. This system was used to compare the secreted metabolomes of human monocyte derived macrophages (hMDM) under normal conditions to those exposed to methamphetamine (Meth). This new experimental approach allowed us to measure 92 metabolites, identify 11 of them as differentially expressed, separate and identify three hydroxymethamphetamine (OHMA) isomers, and identify a new, yet unknown metabolite with m/z of 192. This study is the first of its kind to address the secreted metabolomic response of hMDM to an insult by Meth. Besides the discovery of novel metabolites secreted by macrophages, we provide a novel methodology to investigate metabolomic profiling.
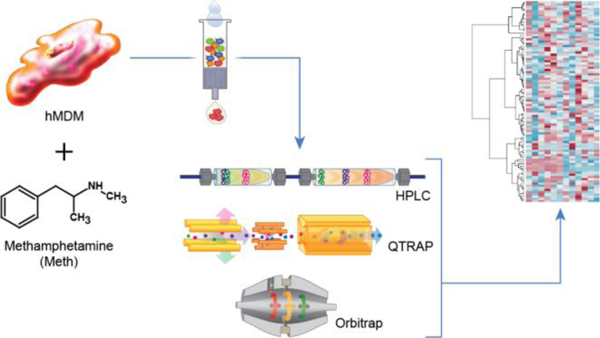
Graphical Abstract
As part of the innate immune system, macrophages defend the host. However, they can also provoke disease (pathological) states while exposed to an insult from infectious or toxic agents, e.g. methamphetamine (Meth, Supporting Information Figure S1). In response to such insults, the activated macrophage has at its disposal many means of communication with other cells, such as the secretion of cytokines and chemokines, via direct contact utilizing receptors and presumably utilizing various metabolites 1. Macrophage responses can be acute or chronic; for example, it has been postulated that in human immunodeficiency virus 1 (HIV-1) infected brains, low levels of persistent inflammation of macrophages contribute to the development of HIV-1 associated neurocognitive disorders (HAND) 2–4. Though previous studies investigated cytokine and chemokine effects, the communicative and/or regulatory role of metabolites secreted by human macrophages remains understudied.
Thus, in this study, we were interested in how this secreted metabolome is affected when macrophages are exposed to the unfavorable environment caused by Meth 5–6. Numerous publications provide evidence that functions of macrophages are susceptible to adverse effects of Meth 5, 7–11. For example, Meth enhances HIV replication in macrophages, leading to alkalization of the phagosome, and consequently, decreased phagocytosis and killing of yeast 12–13. Simultaneous HIV infection and Meth exposure also alters macrophage signaling in response to Toll-like receptor 9 (TLR9) stimulation 5 and coupled with gp120 effects on matrix metalloproteins (MMPs), modulates the remodeling of the extracellular environment 14. This latter effect is also associated with the increased migration of monocytes/macrophages to the brain.
Many studies have focused on the extraction of metabolites as the first and most crucial step of metabolic profiling. Extraction of metabolites is driven by two factors: 1) the source, i.e. intracellular or extracellular and 2) physico-chemical properties of the investigated molecules 15. Although extraction methods do not need to cover a wide range of metabolites in the case of targeted metabolic profiling, pre-fractionation of complex samples is beneficial during the discovery phase of global, unbiased profiling. In this study, solid phase extraction (SPE) was designed to pre-fractionate metabolites based on their general physico-chemical properties into two groups: acidic/neutral and basic compounds.
The novel workflow proposed in this study incorporates sample preparation, extensive fractionation, and analysis by liquid chromatography (LC) in which two columns with different characteristics were connected in tandem. We diminished the very high dynamic range of the synthetic media’s concentration of components (from a few to 1000 mM of glucose, amino acids, phenol red, sodium bicarbonate, and sodium pyruvate, from a few to 200 µM of vitamins and antibiotics) and the much lower levels of macrophages’ secreted metabolites (from a few to hundreds of nM typical levels of biomarkers in blood 26). This allowed us to perform a comprehensive investigation of macrophages’ secreted metabolome upon exposure to Meth. Although not shown here, our data also suggests that Meth exposure to human monocyte derived macrophages (hMDM) may lead to alterations in metabolic pathways in the hMDM such as propionylation of certain substrates.
EXPERIMENTAL
Materials.
Optima 0.1% formic acid in water (LC/MS grade), Optima 0.1% formic acid in acetonitrile (LC/MS grade), and Optima acetonitrile (LC/MS grade) were purchased from Fisher Chemical (Fair Lawn, NJ, USA). A detailed list of reagents is in Supporting Information.
Cells and growth conditions.
Human Monocyte Derived Macrophages (hMDM) were obtained as described previously 16. Detailed description of growth conditions is presented in Supporting Information.
Secreted metabolome sample collection, processing, solid phase extraction (SPE), and liquid-liquid extraction (LLE).
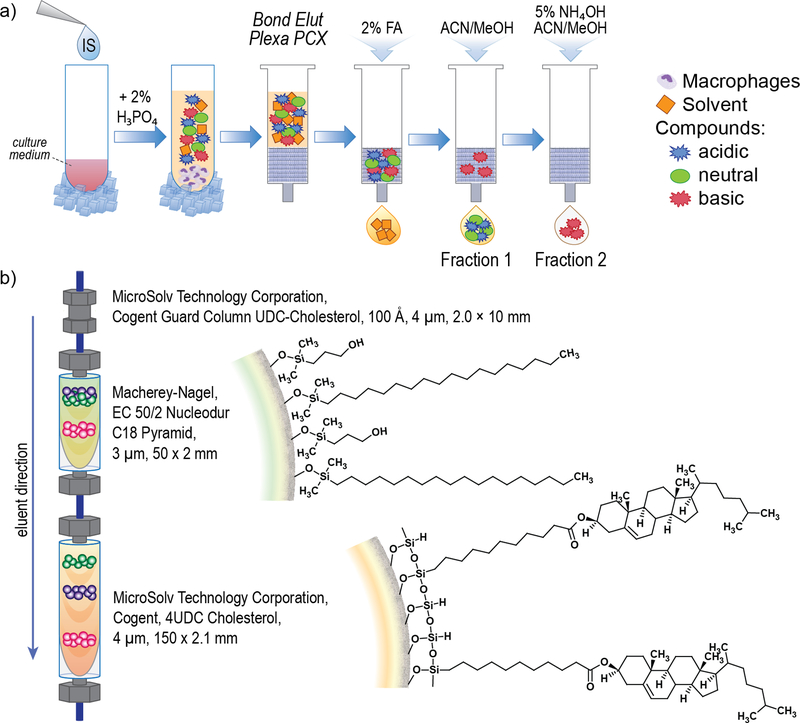
We used monocytes from six donors, to give six biological replicates. Five separate one milliliter aliquots of culture supernatants were processed at one time, thus generating five technical replicates for each sample. Collected culture supernatants were centrifuged for 10 min at 14,000 × g to clear cellular debris. Prepared supernatants were further processed by using either a SPE (Figure 1a) or a LLE (Supporting Information Figure S2) method. Despite the fact that the medium used for cultures was fully synthetic, the wide range of concentrations between secreted metabolites and amounts of medium components remained a challenge. Thus, the purpose of this extended fractionation was to extract metabolites from cell culture supernatants along with the simplification of the samples’ composition. Of note, some compounds showing amphoteric properties were split between elution of acidic and basic conditions. Each fraction can be analyzed by mass spectrometry in positive and negative modes. In this study, however, we present analyses of compounds eluted in Fraction 2 (Figure 1a) in positive mode. Other fractions are being subsequently analyzed.
Figure 1.
a) Solid phase extraction (SPE) sample processing; FA formic acid, ACN acetonitrile, MeOH methanol; b) Characteristics of LC column used for separation of metabolites.
As depicted in Figure 1a, 25 µL of each internal standard were added to 3 mL of sample in a Falcon tube and vortexed. Samples were diluted 3 times with 2% H3PO4 solution yielding a total final volume of 9 mL. Plexa PCX sorbent contains a negatively charged resin that will retain the compounds of interest, which are contained in an acidic environment after being conditioned with 3 mL of 100% MeOH dropwise until the meniscus reaches the top of the sorbent. Next, the sample was equilibrated with 3 mL of 100% H2O dropwise. Then, sample was loaded and passed through the cartridge dropwise until all sample was applied. Flow-through fraction was discarded. Sorbent with applied sample was washed with 3 mL of a washing solution of 2% formic acid in water, which was discarded. Elutions of acidic and neutral compounds were achieved using a mixture of acetonitrile and methanol (Fraction 1). Elutions of basic compounds were achieved using 5% NH4OH in ACN/MeOH (Fraction 2). This triggered a pH change that washed away the hydrophobic compounds along with the amine group-rich compounds attached to the resin. Each elution procedure was repeated 3 times using 2 mL of elution solvent each time. All replicates of all samples (control and Meth) were immediately dried in a Savant SPD1010 SpeedVac concentrator (ThermoFisher Scientific, Asheville, NC, USA). Before injection, samples were reconstituted by first adding 400 µL of acetonitrile-water mixture (1:1, v/v), then vortexed for 10 s. Next, 200 µL of water with 0.1% formic acid was added to these solutions and vortexed again for 10 s.
Mass Spectrometry.
The primary readout system used in this study was mass spectrometry with a variety of techniques and instrumentation depending on analytical needs. It included QTrap MS in three modes (Multiple Reaction Monitoring (MRM), Q3 MS scan, and Enhanced Product Ion (EPI)), as well as High-resolution Orbitrap MS in two modes (scan and MS/MS).
LC-MS.
Chromatographic and mass spectrometric analyses were performed using Nexera X2 UHPLC System (Shimadzu Corporation, Kyoto, Japan) interfaced with a QTRAP 6500 MS/MS System with a Turbo Spray ion source (SCIEX, Framingham, MA, USA). The majority of the experiments were analyzed using MRM mode (detailed settings for these experiments are provided in Supporting Information).
LC-MS conditions (column, eluent, gradient, source parameters) used for Q3 MS scan or EPI analyses were the same as for MRM described in Supporting Information, while the detection method was different. The full scan chromatograms and spectra were acquired in Q3 MS scan (mass to charge ratio (m/z) 100–1000). The EPI mode was implemented using 30 V of collision energy (CE) and 15 V of collision energy spread (CES) for precursor ions of all MRM transitions. Additionally, new metabolites of Meth and hydroxymethamphetamine (OHMA) isomers were fragmented using 10, 15 and 20 V of CE and 5 V of CES. The MS/MS spectra were acquired from m/z 50 to m/z-value of the parent ion + 20 to achieve an upper limit around 20 m/z above the m/z of each fragmented ion.
High-resolution MS.
High-accuracy mass spectra were acquired using a Thermo Dionex UltiMate 3000 RSLCnano System (Dionex Softron GmbH, Germering, Germany) coupled with a Thermo Orbitrap Fusion Lumos Tribrid mass spectrometer with an EASY-Spray source (Thermo Fisher Scientific, San Jose, CA, USA). Detailed settings are provided in Supporting Information.
Data Analyses.
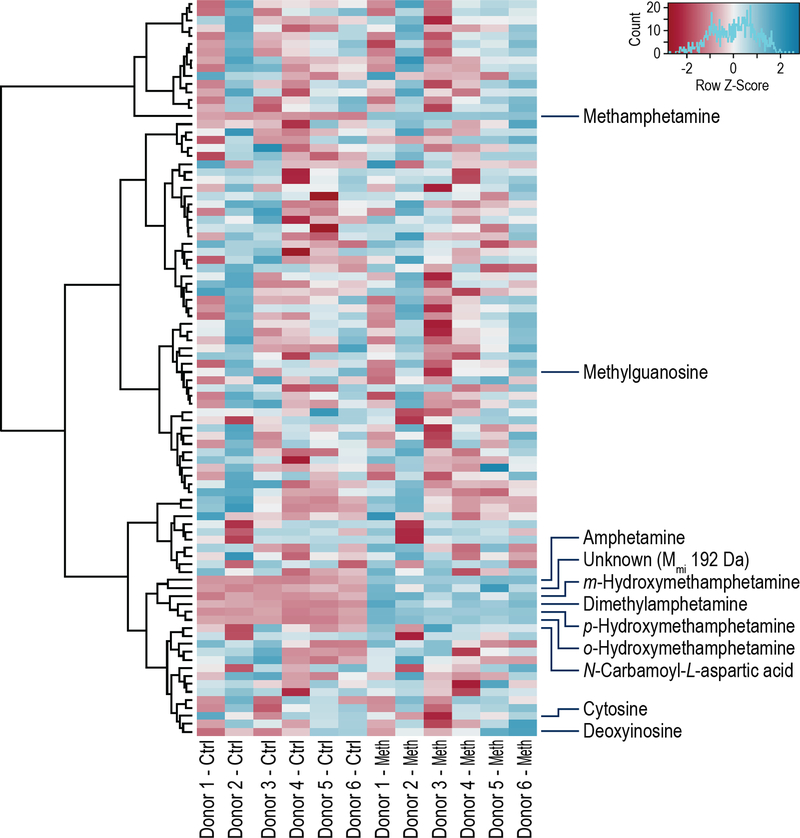
All data analyses were carried out in R version 3.4.0. Peak areas from positive ion mode, SPE Fraction 2 samples were obtained from MultiQuant (AB SCIEX, Framingham, MA, USA) software. Data for all 5 technical replicates for each condition (control and Meth) of each donor (six total) were combined to give a matrix with columns corresponding to samples and rows corresponding to metabolites. All data were log2 transformed and then normalized by subtracting the area of the internal standard abacavir in each sample. This data was visualized in a heat map presented in Figure 4 using the heatmap.2 function available in the gplots R package 17. Hierarchical clustering was performed on the matrix rows (metabolites). The peak area values were converted to z-scores to show relative downregulation (blue) and upregulation (red) of metabolites.
Figure 4.
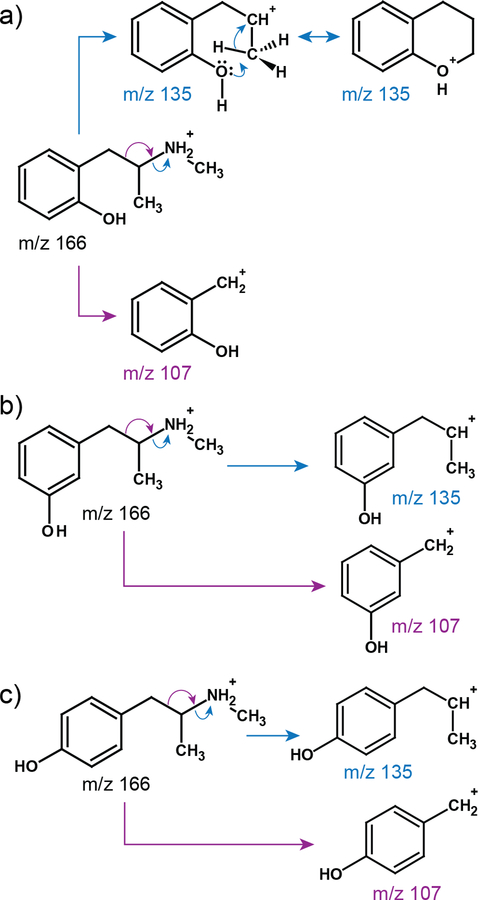
Proposed fragmentation of OHMA isoforms: a) ortho-OHMA, b) meta-OHMA and c) para-OHMA; colored arrows represent different pathways of fragmentation.
For differential expression analyses, we calculated the mean of each metabolite across the technical replicates separated by condition to obtain a matrix of mean peak abundance values. The moderated paired t test within the limma R package was used to determine the differences between control and Meth groups and to identify significantly differentially expressed metabolites 18–19. The p-values were adjusted using the Benjamini & Hochberg method, and an adjusted p-value of no more than 0.1 was considered to be significant.
RESULTS
Experimental flow.
Supporting Information Figure S3 shows a flow chart of the experimental approach to discover metabolites secreted by hMDM exposed to Meth. It consists of three parts: Electro-Spray Ionization Mass Spectrometry (ESI MS), HPLC/UPLC chromatography, and sample preparation. Our sample preparation includes all steps as outlined in literature 20.
LC.
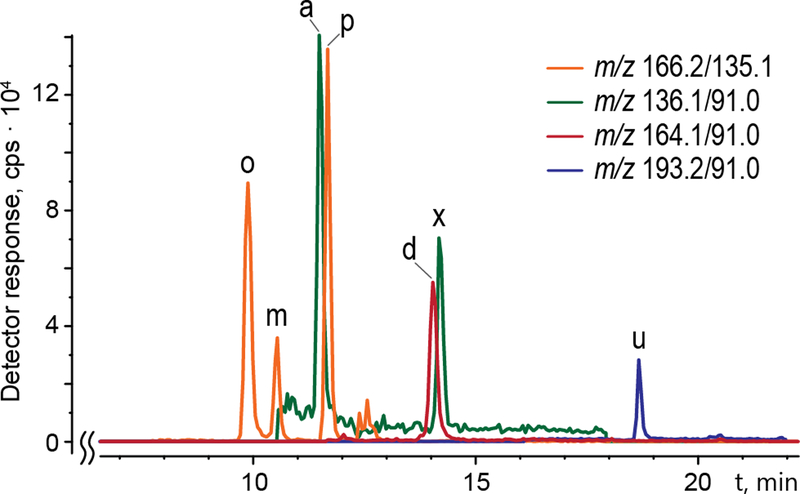
Much of the analytical success of secreted metabolome investigation depends on effective LC prior to detection of metabolites by mass spectrometry. As mentioned above, one challenge is the substantial dynamic range of concentrations of metabolites that might be present at very low concentrations compared to the components of the synthetic medium. In addition, high intensity signals for the components of the medium and Meth may suppress low intensity signals from secreted metabolites that might not be detected by mass spectrometryunless the metabolites are separated by LC beforehand. Therefore, we combined two columns in tandem RP C18 and RP 4UDC Cholesterol to achieve the best possible fractionation of the metabolite mixture, which remained a complex mixture despite the solid phase extraction. Figure 1b shows surface characteristics of these two columns. The RP 4UDC Cholesterol column’s unique characteristics support separation in an acetonitrile/water liquid phase. Cholesterol-based stationary phases have been successful in many RP applications, e.g. separation of sterols, 21 and allowed us to chromatographically separate isomers of OHMA (Figure 2). The separation effect of OHMA is due to characteristics of the cholesterol-modified surface since all other parameters were not changed from those used for RP C18 column 22. The effects of the sample matrix on retention times and intensity of internal standards, correlation coefficients (r), limits of detection (LOD) and limits of quantitation (LOQ) are presented in Table 1 (calibration curves can be found in Supporting Information Figure S4).
Figure 2.
Chromatograms of Meth metabolites acquired in MRM positive ion mode extracted for selected transitions; o ortho-hydroxymethamphetamine, m meta-hydroxymethamphetamine, a amphetamine, p para-hydroxymetahmphetamine, d a metabolite with the formula C11H17N (Mmi 163 Da), likely dimethylamphetamine, u a metabolite with formula C11H16N2O (Mmi 192 Da), × compound with unknown structure (also present in control samples).
Table 1.
Calibration equations, coefficients of determination (r), LOD, LOQ, matrix effect, and relative standard deviation of abacavir and SN-38
| Regression equation | r | LOD, ng∙mL−1 | LOQ, ng∙mL−1 | Matrix effect, % | RSD (tR), % | |
|---|---|---|---|---|---|---|
| Abacavir | y=330866x+941121 | 0.9982 | 2.17 | 6.57 | 88.2 | 20.3 |
| SN-38 | y=46484x-132150 | 0.9949 | 18.15 | 54.99 | 103.5 | 7.5 |
Differentially expressed metabolites.
Table S1 in Supporting Information lists compounds found in SPE Fraction 2, all transitions used in MRM mode, data obtained from EPI mode to verify the identity of the listed compounds, and results of statistical analyses. We have found 11 differentially expressed metabolites (bold font, adjusted p-value < 0.1) with one metabolite, represented by mass 192 Da, not yet identified.
Heat Map Visualization.
The heat map presented in Figure 3 shows the response of hMDMs to Meth exposure. Before visualization, metabolite data were transformed, normalized, and summarized by the mean of technical replicates as described in Methods. Metabolite abundance values were further scaled to highlight relative downregulation (blue) and upregulation (red) between conditions (metabolites with adjusted p-value < 0.1 are labeled). Vertical columns represent the mean of five technical replicates per donor. As expected, we observed substantial variability in responses between donors; nevertheless, hierarchical clustering analyses categorizes the Meth metabolites as a major cluster. Variability in the donors’ responses to Meth treatment is characteristic for profiling analysis of primary cells and has been noted by us in previous publications 23–24. Supporting Information Table S2 lists all compounds and their z-scores included in the heat map.
Figure 3.
Heat map comparison of abundance levels for control and Meth conditions; relative downregulation (blue) and upregulation (red). Only metabolites with adjusted p-value < 0.1 are labeled; the compounds in the heat map (top to bottom) are listed in Supporting Information Table S2.
Metabolism of Meth.
The new LC approach allowed us to separate many metabolites (Figure 2), including two new isomers of OHMA and two new metabolites of Meth.
MRM data extraction for the m/z 166.2/135.1 precursor and transition ions generated three chromatographically distinct peaks (tR 9.8, 10.4 and 11.6 min) labeled o, m, and p (orange line, Figure 2). MS/MS spectra acquired for pseudo-molecular ions at m/z 166.1 of the peaks using EPI mode generated almost identical spectra (Supporting Information Figure S5a) different only in intensity of the ions. They show the same fragmentation pathway as for Meth (Supporting Information Figure S5b). Since the m/z values of both main signals observed in the spectra (m/z 135.0 and 106.9) are exactly 16 Da higher than the ones in Meth spectra, the only difference in the structure is a benzene ring that has a hydroxyl group attached. The presence of three peaks with the same MS/MS spectra indicates ortho-, meta-, and para- isomers of OHMA. The elution order is a result of differences in their overall polarity because the dipole moments of these isomers changes while the number of carbons remains the same. Taking this together, we conclude that each peak represents structurally different forms of three isomers of OHMA: ortho-, meta-, and para-.
Protonation of the nitrogen atom of OHMA isomers leads, on the one hand, to β-cleavage with formation of a stable hydroxybenzyl cation (C7H7O+ at m/z 106.9), and on the other to simple inductive cleavage with formation of a C9H11O+ cation (m/z 135.0). For meta- and para-OHMA, the ion of m/z 106.9 is more stable than the m/z 135.0 ion; but in the case of ortho-OHMA, the latter ion (m/z 135.0) undergoes a 1,2-hydride shift and a nucleophilic attack of a primary carbocation by the ortho-hydroxyl-substituent, leading to cyclization. The six-membered ring additionally stabilizes the cation, and according to Stevenson’s rule 25, the more stable the product cation, the more abundant the corresponding decomposition process. Hence, in the case of o-OHMA in the same MS/MS conditions, the m/z 135.0 ion is more intense than the m/z 106.9 ion. Increased collision energy can lead to further elimination of ethylene from the C9H11O+ ion, which involves only a proton transfer and two facile hydride transfers leading to C-C bond cleavage and creation of the C7H7O+ ion 26. Figure 4 shows the proposed fragmentation pathways for each isomer of OHMA: a) ortho-, b) meta-, and c) para-.
Mass spectrometric investigation of new molecular species.
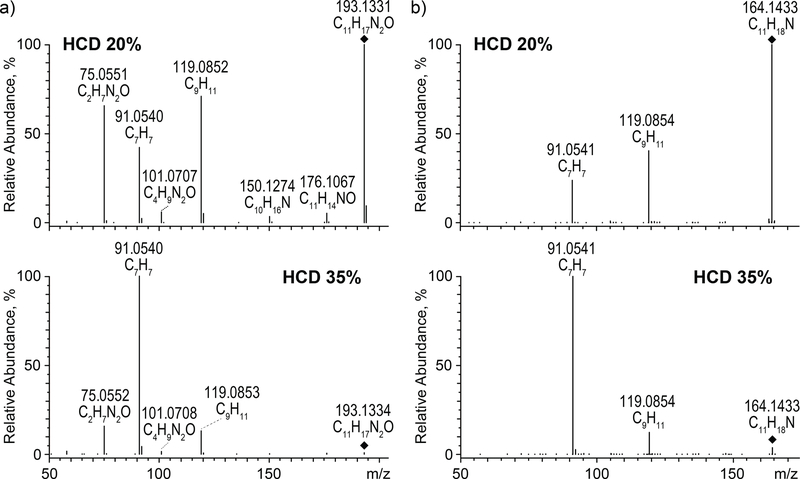
In addition to MRM analyses, we performed Q3 MS m/z 100 to 1000 scan analyses to investigate whether there are differentially expressed molecular species not included in the list of compounds used for targeted MRM experiments. Indeed, Q3 MS scan mode showed at least two such compounds. These additional molecular species found in Q3 MS scan were m/z 193.1 and m/z 164.1. Next, we examined these species using high-resolution Orbitrap Lumos MS; hence, their accurate m/z-values (and formulas) were determined to be 193.1331 (C11H17N2O) and 164.1433 (C11H17N). Further, MS/MS investigation of these two molecular species indicates that they might be novel, so far unreported metabolites of Meth. The structure of the compound with m/z 193.1331 remains unconfirmed. High-resolution and high-accuracy product ion spectra are presented in Figure 5.
Figure 5.
High accuracy MS/MS spectra in positive ion mode for: a) precursor ion at m/z 193.1331 and b) precursor ion 164.1433 with two high-energy collisional dissociations (HCD): 20% and 35%.
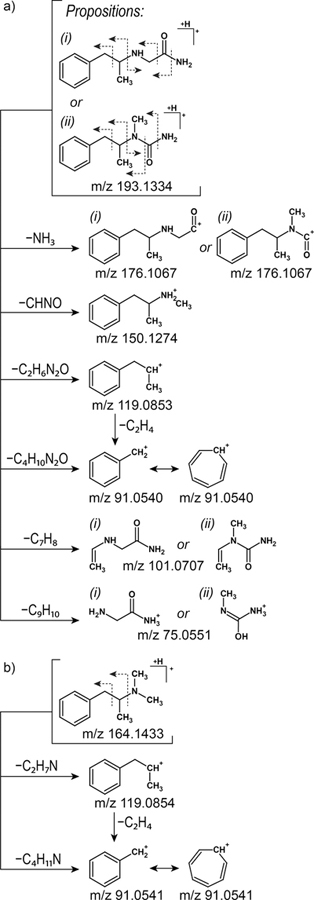
MS/MS spectra of the m/z 193.1334 ion ([M+H]+) acquired with higher-energy collisional energy dissociation (HCD) at the level of 20% showed three main signals at m/z 119.0852, 91.0540, and 75.0551 (Figure 5a). Since the most possible site for a charge location was a nitrogen atom in a secondary amine group, the m/z 119.0852 ion was created via simple inductive cleavage of the C−N bond between a secondary carbon atom and secondary amine group. As a result, a C2H6N2O molecule was lost that was, depending on the proposed structure, either 2-aminoacetamide or 1-methylurea (Figure 6). Similarly, a β-cleavage initiated by the charge led to the formation of the ion at m/z 91.0541 corresponding to a benzyl cation (C6H5CH2+), which rearranges to the highly stable tropylium cation (C7H7+). When the charge was located at the terminal amine group, inductive and β-cleavages resulted in the production of the m/z 176.1067 and 150.1274 ions, respectively.
Figure 6.
Proposed structures and fragmentation paths of two metabolites with the following formulas: a) C11H16N2O (Mmi 192 Da), and b) C11H17N (Mmi 163 Da).
Formation of the ion at m/z 101.0707 occurred through remote hydrogen rearrangement (Figure 6). A similar mechanism was involved in the creation of the m/z 75.0551 product ion of the variant (i) structure, while in the case of variant (ii), it occurred through a McLafferty-type rearrangement, which was driven by the formation of the extremely strong O–H bond 27. Since this ion was very intense in the MS/MS spectrum acquired at HCD 20 and since McLafferty-type rearrangement is an energetically privileged reaction compared to remote hydrogen rearrangement, it may indicate that variant (ii) of the structure is more likely to be the correct one.
Fragmentation of the m/z 164.1433 ion ([M+H]+) generated fewer product ions than fragmentation of m/z 193.1334. In its MS/MS spectra, only two main signals at m/z 119.0854 and 91.0541 were observed. These ions were formed in the same way as described above; that is via inductive and β-cleavage, respectively.
DISCUSSION
The macrophage is one of many key players in the complex system of innate immunity protecting humans and other animals by regulating its responses. 28 Our first goal was to use human primary macrophages in contrast to the majority of studies using macrophage-like cell lines 29–30.
Our second goal was to use the novel LC method that would allow us to maximize separation of low abundance metabolites. Metabolites constitute a group of much more diverse molecules than others, such as peptides. They may differ greatly in polarity, basic and acidic properties, and many of them are amphoteric. The separation of a complex mixture of expected and unknown metabolites required new methods not only in multistep solid phase separations but also in LC separations before mass spectrometric analyses. Thus, here we developed a new LC method for fractionation of secreted metabolites that are subsequently quantified by MRM using a Sciex QTRAP 6500 mass spectrometer. This new LC method employed two tandemly linked RP columns with slightly different characteristics allowing separation of molecular species previously eluted as one peak. One such example is the resulting separation of three OHMA isomers. Since the levels of secreted metabolites was low, especially relative to the high levels of synthetic medium components, our primary focus was to separate and detect metabolites present at such low levels. In addition to achieving this goal, the application of a Q3 MS scan allowed us to identify and measure new metabolites. Thus, we expect that further development of this method will lead to the separation and/or quantification of metabolites that have not been reported or measured.
Our third goal was to discover metabolites secreted by macrophages upon Meth treatment. We focused on metabolites that could show overall macrophage metabolism is affected by Meth and on metabolites that were not identified/reported to date. In this respect, we succeeded in discovering new metabolites of Meth. The underlying mechanisms of such expression are being investigated in the subsequent studies.
Our novel approach led to the separation of three hydroxylated isomers of Meth (OHMA), two of which were previously unknown. This opens the question of what the mechanism(s) leading to Meth hydroxylation at the three distinct positions would be. Hydroxylation of aromatic ring at para- position by cytochrome P450 (CYP2D6) has been reported previously 31; however, the mechanism of hydroxylation at the other two positions, ortho- and meta-, of such aromatic ring is unknown. At this point, we can only speculate based on similar studies of how the aromatic ring is hydroxylated in amino acids. Fitzpatrick has reviewed possible mechanisms in his paper published in 2003 32. As Fitzpatrick stated, tyrosine, phenylalanine, and tryptophan comprise a group of three tetrahydroproteins dependent on modification by aromatic amino acid hydroxylases. Nevertheless, the author did not reach a conclusion about the exact mechanism. It is also not known if a similar mechanism of the hydroxylation of Meth occurs. The most favored mechanism proposed by Fitzpatrick is based on the activation of an oxygen atom, as he presented in Scheme 2 in his paper. Thus, in our case, Fitzpatrick’s proposed hydroxylation mechanism is unlikely due to the lack of any oxygen atom in Meth (Supporting Information Figure S1). Alternatively, one of the hydroxylases involved in the hydroxylation of aromatic rings in those three amino acids may use Meth as a substrate in a yet unknown mechanism.
According to the principles of electrophilic substitution, some substituents of an aromatic ring, such as the 2-(methylamino)-1-propyl group of Meth, direct new substituents into ortho- and para- positions. If such a mechanism is operative in our case, it would explain the observed differences in peak areas of OHMA isomers where the m-OHMA peak is the smallest. This, however, does not apply to hydroxylation of aromatic rings in chemical synthesis. Nevertheless, similar mechanisms may be operative in metabolic reactions of a living cell.
CONCLUSIONS
Results presented in this paper introduce three novel aspects of metabolomic research. First, we present analyses of the metabolic secretome of hMDM exposed to Meth in comparison to non-exposed control cells. We measured 92 metabolites and two internal standards, and identified 11 metabolites that were significantly different between control and Meth-exposed macrophages. Second, the newly proposed and developed LC methodology using combined C18 and Cogent columns allowed us to overcome low concentrations of secreted metabolites and the simultaneously high concentrations of culture medium components. This new analytical approach also allowed us to separate and identify OHMA isomers. Lastly, we found two presumably unknown metabolites pending structural determination and confirmation. This new methodology paves the way for future metabolomics studies, while the experimental results shed light on how the human macrophage, a key component of the innate immune system, responds to Meth exposure.
Supplementary Material
ACKNOWLEDGMENTS
The authors would like to thank Dr. Michael Belshan (Creighton University; Omaha, NE) for his critical review of this manuscript and Robin Taylor for editorial assistance. Financial support was provided by National Institutes of Health grants: R01 DA043258 and P30 MH062261.
Footnotes
The authors declare no competing financial interest.
SUPPORTING INFORMATION
List of reagents and their sources, detailed description of standard protocol for hMDM growth conditions, calibration curve preparation details, detailed mass spectrometry settings, structure of Methamphetamine, depiction of liquid-liquid extraction (LLE) method, flow chart of experimental approach, MS/MS spectra of OHMA isoforms and Meth, detailed list of analyzed compounds in SPE Fraction 2, table of heat map compounds.
REFERENCES
- 1.Takemura R; Werb Z, Secretory products of macrophages and their physiological functions. Am J Physiol 1984, 246 (1 Pt 1), C1–9. [DOI] [PubMed] [Google Scholar]
- 2.Sillman B; Woldstad C; McMillan J; Gendelman HE, Neuropathogenesis of human immunodeficiency virus infection. Handb Clin Neurol 2018, 152, 21–40. [DOI] [PubMed] [Google Scholar]
- 3.Surdo M; Cortese MF; Perno CF; Aquaro S, NeuroAIDS: virological aspects of HIV infection. J Biol Regul Homeost Agents 2013, 27 (2 Suppl), 115–28. [PubMed] [Google Scholar]
- 4.Chen MF; Gill AJ; Kolson DL, Neuropathogenesis of HIV-associated neurocognitive disorders: roles for immune activation, HIV blipping and viral tropism. Curr Opin HIV AIDS 2014, 9 (6), 559–64. [DOI] [PMC free article] [PubMed] [Google Scholar]
- 5.Burns A; Ciborowski P, Acute exposure to methamphetamine alters TLR9-mediated cytokine expression in human macrophage. Immunobiology 2016, 221 (2), 199–207. [DOI] [PMC free article] [PubMed] [Google Scholar]
- 6.Harms R; Morsey B; Boyer CW; Fox HS; Sarvetnick N, Methamphetamine administration targets multiple immune subsets and induces phenotypic alterations suggestive of immunosuppression. PLoS One 2012, 7 (12), e49897. [DOI] [PMC free article] [PubMed] [Google Scholar]
- 7.Talloczy Z; Martinez J; Joset D; Ray Y; Gacser A; Toussi S; Mizushima N; Nosanchuk JD; Goldstein H; Loike J; Sulzer D; Santambrogio L, Methamphetamine inhibits antigen processing, presentation, and phagocytosis. PLoS Pathog 2008, 4 (2), e28. [DOI] [PMC free article] [PubMed] [Google Scholar]
- 8.Potula R; Persidsky Y, Adding fuel to the fire: methamphetamine enhances HIV infection. Am J Pathol 2008, 172 (6), 1467–70. [DOI] [PMC free article] [PubMed] [Google Scholar]
- 9.Gaskill PJ; Calderon TM; Luers AJ; Eugenin EA; Javitch JA; Berman JW, Human immunodeficiency virus (HIV) infection of human macrophages is increased by dopamine: a bridge between HIV-associated neurologic disorders and drug abuse. Am J Pathol 2009, 175 (3), 1148–59. [DOI] [PMC free article] [PubMed] [Google Scholar]
- 10.Reynolds JL; Mahajan SD; Aalinkeel R; Nair B; Sykes DE; Schwartz SA, Methamphetamine and HIV-1 gp120 effects on lipopolysaccharide stimulated matrix metalloproteinase-9 production by human monocyte-derived macrophages. Immunol Invest 2011, 40 (5), 481–97. [DOI] [PMC free article] [PubMed] [Google Scholar]
- 11.Liu X; Silverstein PS; Singh V; Shah A; Qureshi N; Kumar A, Methamphetamine increases LPS-mediated expression of IL-8, TNF-alpha and IL-1beta in human macrophages through common signaling pathways. PLoS One 2012, 7 (3), e33822. [DOI] [PMC free article] [PubMed] [Google Scholar]
- 12.Wang X; Wang Y; Ye L; Li J; Zhou Y; Sakarcan S; Ho W, Modulation of intracellular restriction factors contributes to methamphetamine-mediated enhancement of acquired immune deficiency syndrome virus infection of macrophages. Curr HIV Res 2012, 10 (5), 407–14. [DOI] [PMC free article] [PubMed] [Google Scholar]
- 13.Aslanyan L; Ekhar VV; DeLeon-Rodriguez CM; Martinez LR, Capsular specific IgM enhances complement-mediated phagocytosis and killing of Cryptococcus neoformans by methamphetamine-treated J774.16 macrophage-like cells. Int Immunopharmacol 2017, 49, 77–84. [DOI] [PMC free article] [PubMed] [Google Scholar]
- 14.Martinelli E; Cicala C; Van Ryk D; Goode DJ; Macleod K; Arthos J; Fauci AS, HIV-1 gp120 inhibits TLR9-mediated activation and IFN-{alpha} secretion in plasmacytoid dendritic cells. Proc Natl Acad Sci U S A 2007, 104 (9), 3396–401. [DOI] [PMC free article] [PubMed] [Google Scholar]
- 15.Bruno C; Patin F; Bocca C; Nadal-Desbarats L; Bonnier F; Reynier P; Emond P; Vourc’h P; Joseph-Delafont K; Corcia P; Andres CR; Blasco H, The combination of four analytical methods to explore skeletal muscle metabolomics: Better coverage of metabolic pathways or a marketing argument? J Pharm Biomed Anal 2018, 148, 273–279. [DOI] [PubMed] [Google Scholar]
- 16.Gendelman HE; Orenstein JM; Martin MA; Ferrua C; Mitra R; Phipps T; Wahl LA; Lane HC; Fauci AS; Burke DS; Skillman D; Meltzer MS, Efficient isolation and propagation of human immunodeficiency virus on recombinant colony-stimulating factor 1-treated monocytes. J Exp Med 1988, 167 (4), 1428–41. [DOI] [PMC free article] [PubMed] [Google Scholar]
- 17.Warnes GR; Bolker B; Bonebakker L; Gentleman R; Huber W; Liaw A; Lumley T; Maechler M; Magnusson A; Moeller S; Schwartz M; Venables B gplots: Various R Programming Tools for Plotting Data. R package version 3.0.1, 2016.
- 18.Ritchie ME; Phipson B; Wu D; Hu Y; Law CW; Shi W; Smyth GK, limma powers differential expression analyses for RNA-sequencing and microarray studies. Nucleic Acids Res 2015, 43 (7), e47. [DOI] [PMC free article] [PubMed] [Google Scholar]
- 19.Smyth GK, Linear models and empirical bayes methods for assessing differential expression in microarray experiments. Stat Appl Genet Mol Biol 2004, 3, Article3. [DOI] [PubMed] [Google Scholar]
- 20.van der Werf MJ; Takors R; Smedsgaard J; Nielsen J; Ferenci T; Portais JC; Wittmann C; Hooks M; Tomassini A; Oldiges M; Fostel J; Sauer U, Standard reporting requirements for biological samples in metabolomics experiments: microbial and in vitro biology experiments. Metabolomics 2007, 3, 189–194. [DOI] [PMC free article] [PubMed] [Google Scholar]
- 21.Soukup J; Bocian S; Jandera P; Buszewski B, Comparison of four cholesterol-based stationary phases for the separation of steroid hormones. J Sep Sci 2014, 37 (4), 345–51. [DOI] [PubMed] [Google Scholar]
- 22.Moldoveanu SC; David V, Common RP columns in “Selection of the HPLC method in chemical analysis Elsevier, Inc; Amsterdam, Boston, Heidelberg, London, New York, Oxford, Paris, San Diego, San Francisco, Singapore, Sydney, Tokyo, 2017; p 310–322. [Google Scholar]
- 23.Ciborowski P; Fox HS, Proteomics and HIV. Proteomics Clin Appl 2016, 10 (2), 109. [DOI] [PubMed] [Google Scholar]
- 24.Haverland NA; Fox HS; Ciborowski P, Quantitative proteomics by SWATH-MS reveals altered expression of nucleic acid binding and regulatory proteins in HIV-1-infected macrophages. J Proteome Res 2014, 13 (4), 2109–19. [DOI] [PMC free article] [PubMed] [Google Scholar]
- 25.Stevenson DP, Ionization and dissociation by electronic impact. The ionization potentials and energies of formation of sec.-propyl and tert.-butyl radicals. Some limitations on the method. Discussions of the Faraday Society 1951, 10, 35–40. [Google Scholar]
- 26.Russell AL; Rohrs HW; Read D; Giblin DE; Gaspar PP; Gross ML, Radical Cation/Radical Reactions: A Fourier Transform Ion Cyclotron Resonance Study of Allyl Radical Reacting with Aromatic Radical Cations. Int J Mass Spectrom 2009, 287 (1–3), 8–15. [DOI] [PMC free article] [PubMed] [Google Scholar]
- 27.Demarque DP; Crotti AE; Vessecchi R; Lopes JL; Lopes NP, Fragmentation reactions using electrospray ionization mass spectrometry: an important tool for the structural elucidation and characterization of synthetic and natural products. Nat Prod Rep 2016, 33 (3), 432–55. [DOI] [PubMed] [Google Scholar]
- 28.Kapoor S; Fitzpatrick M; Clay E; Bayley R; Wallace GR; Young SP, Metabolomics in the Analysis of Inflammatory Diseases. In Metabolomics, Roessner U, Ed. Rijeka (HR), 2012. [PubMed]
- 29.Verhoeckx KC; Bijlsma S; Jespersen S; Ramaker R; Verheij ER; Witkamp RF; van der Greef J; Rodenburg RJ, Characterization of anti-inflammatory compounds using transcriptomics, proteomics, and metabolomics in combination with multivariate data analysis. Int Immunopharmacol 2004, 4 (12), 1499–514. [DOI] [PubMed] [Google Scholar]
- 30.Mussotter F; Potratz S; Budczies J; Luch A; Haase A, A multi-omics analysis reveals metabolic reprogramming in THP-1 cells upon treatment with the contact allergen DNCB. Toxicol Appl Pharmacol 2018, 340, 21–29. [DOI] [PubMed] [Google Scholar]
- 31.Ramamoorthy Y; Tyndale RF; Sellers EM, Cytochrome P450 2D6.1 and cytochrome P450 2D6.10 differ in catalytic activity for multiple substrates. Pharmacogenetics 2001, 11 (6), 477–87. [DOI] [PubMed] [Google Scholar]
- 32.Fitzpatrick PF, Mechanism of aromatic amino acid hydroxylation. Biochemistry 2003, 42 (48), 14083–91. [DOI] [PMC free article] [PubMed] [Google Scholar]
Associated Data
This section collects any data citations, data availability statements, or supplementary materials included in this article.


