Abstract
Background
Patient-reported outcome measures such as the Patient-Reported Outcomes Measurement Information System (PROMIS) allow surgeons to evaluate the most important outcomes to patients, including function, pain, and mental well-being. However, PROMIS does not provide surgeons with insight into whether patients are able to successfully cope with their level of physical and/or mental health limitations in day-to-day life; such understanding can be garnered using the Patient-acceptable Symptom State (PASS). It remains unclear whether or not the PASS status for a given patient and his or her health, as evaluated by PROMIS scores, differs based on sociodemographic factors; if it does, that could have important implications regarding interpretation of outcomes and fair delivery of care.
Questions/purposes
In a tertiary-care foot and ankle practice, (1) Is the PASS associated with sociodemographic factors (age, gender, race, ethnicity, and income)? (2) Do PROMIS Physical Function (PF), Pain Interference (PI), and Depression scores differ based on income level? (3) Do PROMIS PF, PI, and Depression thresholds for the PASS differ based on income level?
Methods
In this retrospective analysis of longitudinally obtained data, all patients with foot and ankle conditions who had new-patient visits (n = 2860) between February 2015 and December 2017 at a single tertiary academic medical center were asked to complete the PROMIS PF, PI, and Depression survey and answer the following single, validated, yes/no PASS question: “Taking into account all the activity you have during your daily life, your level of pain, and also your functional impairment, do you consider that the current state of your foot and ankle is satisfactory?” Of the 2860 new foot and ankle patient visits, 21 patient visits (0.4%) were removed initially because all four outcome measures were not completed. An additional 225 patient visits (8%) were removed because the patient chart did not contain enough information to accurately geocode them; 15 patients visits (0.5%) were removed because the census block group median income data were not available. Lastly, two patient visits (0.1%) were removed because they were duplicates. This left a total of 2597 of 2860 possible patients (91%) in our study sample who had completed all three PROMIS domains and answered the PASS question. Patient sociodemographic factors such as age, gender, race, and ethnicity were recorded. Using census block groups as part of a geocoding method, the income bracket for each patient was recorded. A chi-square analysis was used to determine whether sociodemographic factors were associated with different PASS rates, two-way ANOVA analyses with pairwise comparisons were used to determine if PROMIS scores differed by income bracket, and a receiver operating characteristic (ROC) curve analysis was performed to determine PASS thresholds for the PROMIS score by income bracket. The minimum clinically important difference (MCID) for PROMIS PF in the literature in foot and ankle patients ranges from about 7.9 to 13.2 using anchor-based approaches and 4.5 to 4.7 using the ½ SD, distribution-based method. The MCID for PROMIS PI in the literature in foot and ankle patients ranges from about 5.5 to 12.4 using anchor-based approaches and about 4.1 to 4.3 using the ½ SD, distribution-based method. Both were considered when evaluating our findings. Such MCID cutoffs for PROMIS Depression are not as well established in the foot and ankle literature. Significance was set a priori at p < 0.05.
Results
The only sociodemographic factor associated with differences in the proportion of patients achieving PASS was age (15% [312 of 2036] of patients aged 18-64 years versus 11% [60 of 561] of patients aged ≥ 65 years; p = 0.006). PROMIS PF (45 ± 10 for the ≥ USD 100,000 bracket versus 40 ± 10 for the ≤ USD 24,999 bracket, mean difference 5 [95% CI 3 to 7]; p < 0.001), PI (57 ± 8 for ≥ USD 100,000 versus 63 ± 7 for ≤ USD 24,999, mean difference -6 [95% CI -7 to -4]; p < 0.001), and Depression (46 ± 8 for the ≥ USD 100,000 bracket versus 51 ± 11 for ≤ USD 24,999, mean difference -5 [95% CI -7 to -3]; p < 0.001) scores were better for patients in the highest income bracket compared with those in the lowest income bracket. For PROMIS PF, the difference falls within the score change range deemed clinically important when using a ½ SD, distribution-based approach but not when using an anchor-based approach; however, the score difference for PROMIS PI falls within the score change range deemed clinically important for both approaches. The PASS threshold of the PROMIS PF for the highest income bracket was near the mean for the US population (49), while the PASS threshold of the PROMIS PF for the lowest income bracket was more than one SD below the US population mean (39). Similarly, the PASS threshold of the PROMIS PI differed by 6 points when the lowest and highest income brackets were compared. PROMIS Depression was unable to discriminate the PASS.
Conclusions
Discussions about functional and pain goals may need to be a greater focus of clinic encounters in the elderly population to ensure that patients understand the risks and benefits of given treatment options at their advanced age. Further, when using PASS in clinical encounters to evaluate patient satisfaction and the ability to cope at different symptom and functionality levels, surgeons should consider income status and its relationship to PASS. This knowledge may help surgeons approach patients with a better idea of patient expectations and which level of symptoms and functionality is satisfactory; this information can assist in ensuring that each patient’s health goal is included in shared decision-making discussions. A better understanding of why patients with different income levels are satisfied and able to cope at different symptom and functionality levels is warranted and may best be accomplished using an epidemiologic survey approach.
Level of Evidence
Level III, diagnostic study.
Introduction
Use of patient-reported outcome measures (PROMs) allow surgeons to evaluate clinical outcomes that matter most to patients, and there is a growing call to expand their use in routine clinical care [3]. Several validated PROMs have been used in research and in clinical settings, including the Patient-Reported Outcomes Measurement Information System (PROMIS) [11]. PROMIS is a universal PROM developed with the support of the National Institutes of Health that provides an innovative way to measure outcomes normed to the US population [5]. PROMIS domains provide a measure of general health and can complement disease-specific PROMs such as the Foot and Ankle Ability Measure, Hip Disability and Osteoarthritis Outcome Score, and Knee Disability and Osteoarthritis Outcome Score.
However, while PROMIS has been validated for several patient factors across the population [5], there is a paucity of studies evaluating whether PROMIS scores differ based on sociodemographic factors. Examples of sociodemographic factors include age, gender, race, ethnicity, and income [21]. We are only aware of two sociodemographic factor-focused studies using the PROMIS, in patients with hand conditions, which are both limited in scope [16, 23]. Therefore, how surgeons best tailor care using PROMIS based on sociodemographic factors is unclear. While PROMIS provides insight into a patient’s symptom and functional level compared with the US population, it does not provide insight into a patient’s ability to cope with their current health status. Such understanding can be discerned using the Patient-acceptable Symptom State (PASS), a single question that determines a patient’s ability to adapt to his or her current health status by evaluating whether the patient’s current symptom and activity levels are satisfactory [1, 13, 15]. Thus, it may provide a convenient way for patients to express their feelings associated with their level of symptoms and overall health. However, the relationship between sociodemographic factors, PROMIS, and PASS scores in foot and ankle patients has not been clearly defined.
Therefore, in a tertiary-care foot and ankle practice, we asked: (1) Is the PASS associated with sociodemographic factors (age, gender, race, ethnicity, and income)? (2) Do PROMIS Physical Function (PF), Pain Interference (PI), and Depression scores differ based on income level? (3) Do PROMIS PF, PI, and Depression thresholds for the PASS differ based on income level?
Patients and Methods
Patient Sample
The appropriate institutional review board approved this study, which is a retrospective analysis of longitudinally obtained data. Between February 2015 and December 2017, all new patients (n = 2860) presenting to the orthopaedic foot and ankle clinic at an urban, tertiary care, academic medical center were asked to complete the PROMIS PF, PI, and Depression computer adaptive tests on Apple iPads (Apple, Cupertino, CA, USA) as part of routine clinical care [17]. In addition to PROMIS domains, patients were also asked a single, validated, yes/no question known as the PASS. To be included in our study, patients were required to have answered all PROMs. Of the 2860 new foot and ankle patient visits, 21 patient visits (0.4%) were removed initially because all four outcome measures were not completed. An additional 225 patient visits (8%) were removed because the patient chart did not contain enough information to accurately geocode them; 15 patient visits (0.5%) were removed because the census block group median income data were not available. Lastly, two patient visits (0.1%) were removed because they were duplicates. This led to our final sample of 2597 patients (91%) (Fig. 1).
Fig. 1.
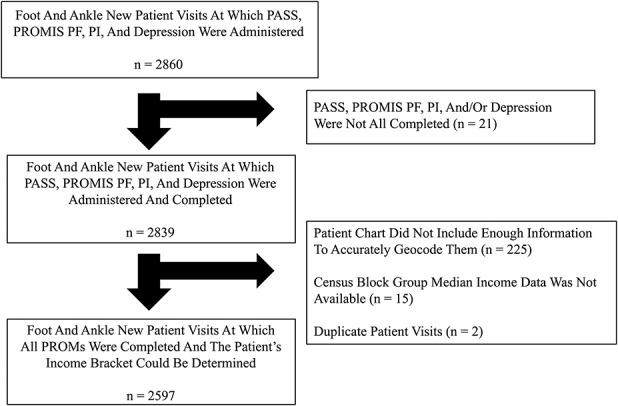
This STROBE diagram illustrates the pathway from the total possible patient sample to the final sample used for all analyses.
Patient characteristics including age (18-65 years or older than 65 years), gender (man or woman), self-reported race (white, black, other, or missing data), and ethnicity (Hispanic, non-Hispanic, or missing data) were determined from patient medical records. Census block groups were identified for each patient based on their address on the date of their new-patient visit. Patient median income was determined using block-level data from the 2017 American Community Survey 5-year Estimates (https://factfinder.census.gov).
We converted income to six brackets based on the median income, as follows: ≤ USD 24,999, USD 25,000-USD 34,999, USD 35,000-USD 49,999, USD 50,000-USD 74,999, USD 75,000-USD 99,000, and ≥ USD 100,000. Although individualized measures are preferred, a great deal of research involving income now uses validated area-based status measures because of the lack of individual data in clinical settings [12, 16, 23].
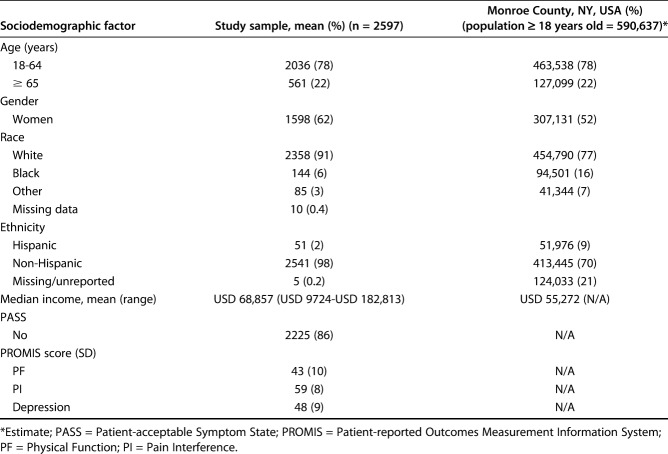
Although our sample was generally similar to the population of the surrounding county, it included slightly more women and fewer black and Hispanic patients (Table 1) [20]. The median income (USD) of our patients was higher than that of people in our county (Table 1) [20].
Table 1.
Patient characteristics
PROMs Used
The PROMIS is a reliable, general PROM normed to the population with a mean t-score of 50 and an SD of 10 [5, 8, 14]. Higher PROMIS PF scores indicate better physical function compared with lower PROMIS PF scores. Lower PROMIS PI and Depression scores indicate decreased pain interference and lower depression, respectively, compared with higher scores. The minimum clinically important difference (MCID) for PROMIS PF in the literature in foot and ankle patients ranges from about 7.9 to 13.2 using anchor-based approaches and about 4.5 to 4.7 using the ½ SD, distribution-based method; the MCID for PROMIS PI in the literature in foot and ankle patients ranges from about 5.5 to 12.4 using anchor-based approaches and about 4.1 to 4.3 using the ½ SD, distribution-based method [10]. Such MCID cutoffs for PROMIS Depression are not as well established in the foot and ankle literature. Both the distribution- and anchor-based approaches were considered when evaluating our findings. The computer-adaptive testing approach commonly employed when administering PROMIS allows for greater precision in measuring outcomes with fewer questions asked [6]. Further, collecting PROMs using Apple iPads has been shown to be more efficient than and preferable to traditional pen-and-paper collection methods [24].
In addition to PROMIS domains, patients were also asked a single, validated, yes/no question known as the PASS; as previously noted, this question determines a patient’s ability to adapt to his or her current health status by evaluating whether the patient’s current symptom and activity levels are satisfactory [1, 13, 15]. The PASS question is: “Taking into account all the activity you have during your daily life, your level of pain, and also your functional impairment, do you consider that the current state of your foot and ankle is satisfactory?”
Statistical Analysis
To answer our first question, we conducted a chi-square analysis of each dichotomous variable and the PASS. In addition, for the race and ethnicity variables, white was compared with black race and Hispanic was compared with non-Hispanic ethnicity. Further, for income, a chi-square analysis was used across income brackets to determine whether the PASS was associated with the median income level.
Our second question was answered using a two-way ANOVA with pairwise comparisons. In the two-way ANOVA, income level was the first factor and a PROMIS domain was the second; this allowed us to assess differences between income levels for each PROMIS scale. Gender and age were included as covariates in this analysis.
Lastly, the third question was answered using a receiver operating characteristic (ROC) curve analysis. The receiver operating characteristic curve analysis allowed us to determine the threshold of the PASS for each PROMIS domain in the entire sample and for each income bracket. The PASS threshold is the PROMIS score cutoff that differentiates those who reach PASS compared with those who do not. The area under the curve and its respective 95% CI was reported to understand the overall accuracy of each PROMIS domain in determining the PASS. The shortest distance to “no errors” of the ROC curve was used to objectively determine thresholds. The shortest distance to “no errors” on the ROC curve was also visually assessed to assure that the identified threshold was consistent with the overall minimum. The sensitivity and specificity were reported for each threshold to assess the ability of the selected threshold to discriminate patients in each income bracket. For all analyses, SPSS Statistics V25 (IBM Corp, Armonk, NY, USA ) was used. Significance was set a priori at p < 0.05.
Results
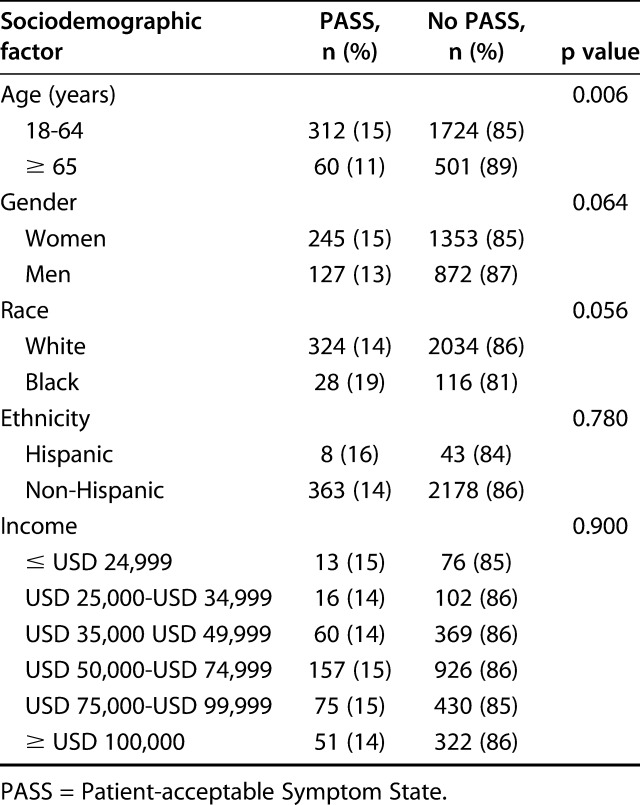
The only sociodemographic factor associated with the proportion of patients achieving PASS was age (15% [312 of 2036] of patients aged 18 to 64 years versus ≥ 11% [60 of 561] of patients aged 65 years; p = 0.006) (Table 2). However, the proportion of patients achieving PASS did not differ by gender (15% [245 of 1598] of women versus 13% [127 of 999] of men; p = 0.064), race (14% [324 of 2358] of patients who were white versus 19% [28 of 144] of patients who were black; p = 0.056), ethnicity (16% [8 of 51] of patients who were Hispanic versus 14% [371 of 2592] of patients who were non-Hispanic; p = 0.780), or income (15% [13 of 89] of patients earning ≤ USD 24,999 versus 14% [16 of 118] of patients earning USD 25,000 to USD 34,999 versus 14% [60 of 429] earning USD 35,000 to USD 49,999 versus 15% [157 of 1083] earning USD 50,000 to USD 74,999 versus 15% [75 of 505] USD 75,000 to USD 99,999 versus ≥ 14% [51 of 373] earning USD 100,000; p = 0.900).
Table 2.
Comparison of PASS based on sociodemographic status factors
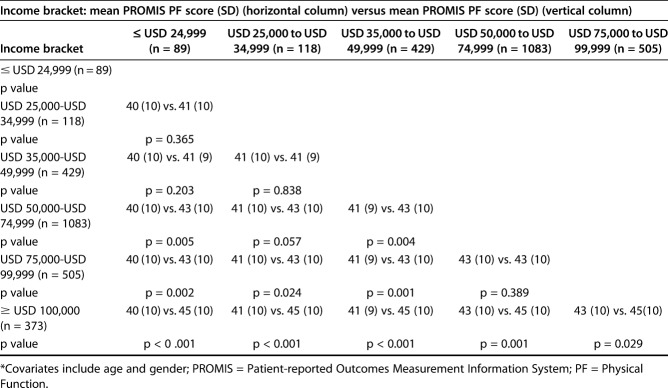
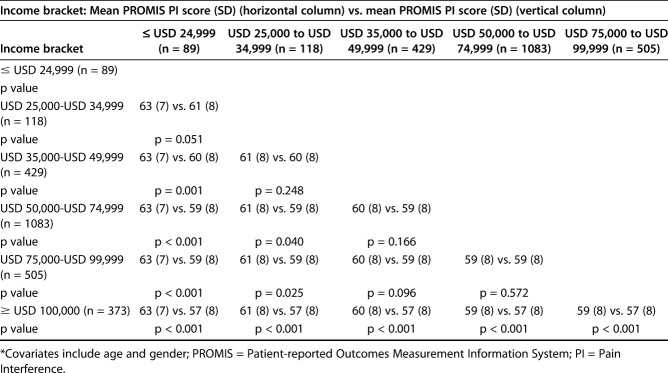
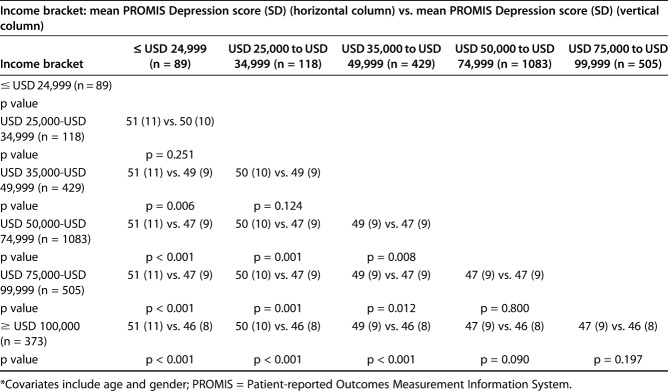
Mean PROMIS PF was 45 ± 10 for patients in the ≥ USD 100,000 income bracket versus 40 ± 10 for patients in the ≤ USD 24,999 bracket (mean difference 5 [95% CI 3 to 7]; p < 0.001) (Table 3). Mean PROMIS PI was 57 ± 8 for the ≥ USD 100,000 bracket versus 63 ± 7 for the ≤ USD 24,999 bracket (mean difference -6 [95% CI to 7 to -4]; p < 0.001) (Table 4). The mean PROMIS-Depression scores were better for patients in the highest income bracket compared with those in the lowest income bracket (46 ± 8 for the ≥ USD 100,000 income bracket versus 51 ± 11 for the ≤ USD 24,999 bracket, mean difference -5 [95% CI -7 to -3]; p < 0.001) (Table 5). For PROMIS PF, the difference falls within the score change range deemed clinically important when using a ½ SD, distribution-based approach but not when using an anchor-based approach; however, the score difference for PROMIS PI falls within the score change range deemed clinically important for both approaches. Patients in the highest income bracket demonstrated better mean PROMIS PF scores than did those in any of the other income bracket (45 ± 10 for ≥ USD 100,000 versus 40 ± 10 for ≤ USD 24,999, mean difference 5 [95% CI 3 to 7]; p < 0.001; 45 ± 10 for ≥ USD 100,000 versus 41 ± 10 for USD 25,000 to USD 34,999, mean difference 4 [95% CI 2 to 6]; p < 0.001; 45 ± 10 for ≥ USD 100,000 versus 41 ± 9 for USD 35,000 to USD 49,999, mean difference 3 [95% CI 2 to 5]; p < 0.001; 45 ± 10 ≥ USD 100,000 versus 43 ± 10 for USD 50,000 to USD 74,999, mean difference 2 [95% CI 1 to 3]; p = 0.001; 45 ± 10 for ≥ USD 100,000 versus 43 ± 10 for USD 75,000 to USD 99,999, mean difference 1 [95% CI 0 to 3]; p = 0.029) (Table 3). Only the mean difference between the lowest income bracket and the highest income bracket was clinically important when using the ½ SD, distribution-based approach for determining MCID; no PROMIS PF mean differences were clinically important when using the anchor-based approach for determining the MCID. PROMIS PI patients in the highest income bracket demonstrated better mean PROMIS PI scores than did those in any of the other income bracket (57 ± 8 for ≥ USD 100,000 versus 63 ± 7 ≤ USD 24,999, mean difference -6 [95% CI -4 to -7]; p < 0.001; 57 ± 8 for ≥ USD 100,000 versus 61 ± 8 for USD 25,000 to USD 34,999, mean difference -4 [95% CI-2 to -5]; p < 0.001; 57 ± 8 for ≥ USD 100,000 versus 60 ± 8 for USD 35,000 to USD 49,999, mean difference -3 [95% CI -2 to -4]; p < 0.001; 57 ± 8 for ≥ USD 100,000 versus 59 ± 8 for USD 50,000 to USD 74,999, mean difference -2 [95% CI -3 to -1]; p < 0.001; 57 ± 8 for ≥ USD 100,000 versus 59 ± 8 for USD 75,000 to USD 99,999, mean difference -2 [95% C, -1 to -3]; p < 0.001) (Table 4). Only the mean difference between the lowest income bracket and the highest income bracket was clinically important when using the ½ SD, distribution-based approach or anchor-based approach for determining MCID. For PROMIS Depression, the highest income bracket’s mean PROMIS scores were only lower than those in the three lowest income brackets (≥ 46 ± 8 for USD 100,000 versus 51 ± 11 for ≤ USD 24,999, mean difference -5 [95% CI -7 to -3]; p < 0.001; 46 ± 8 for ≥ USD 100,000 versus 50 ± 10 for USD 25,000 to USD 34,999, mean difference -4 [95% CI -6 to -2]; p < 0.001; 46 ± 8 for ≥ USD 100,000 versus 49 ± 9 for USD 35,000 to USD 49,999, mean difference -2 [95% CI -1 to -4]; p < 0.001) (Table 5).
Table 3.
Two-way ANOVA with pairwise comparison to evaluate differences in mean PROMIS PF scores by income bracket*
Table 4.
Two-way ANOVA with pairwise comparison to evaluate differences in mean PROMIS PI scores by income bracket*
Table 5.
Two-way ANOVA with pairwise comparison to evaluate differences in mean PROMIS Depression scores by income bracket*
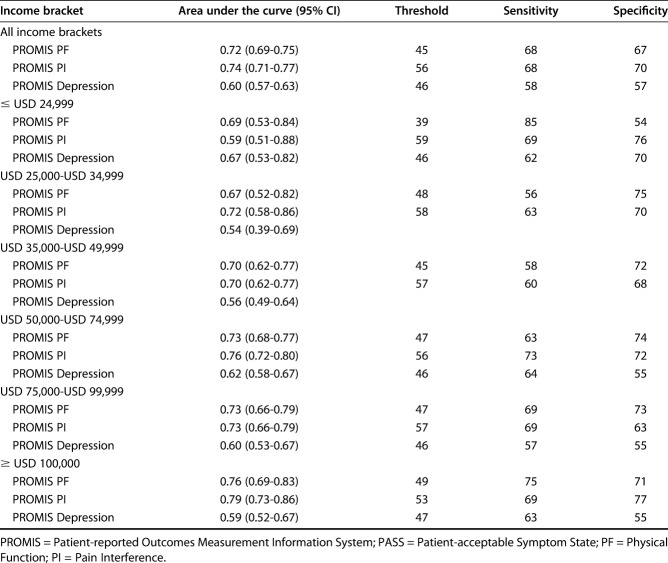
Threshold PROMIS scores for all three domains differed based on income levels, especially from the highest income bracket to the lowest income bracket. In addition, the ability of PROMIS scales to discriminate the PASS showed that the PROMIS PF and PI had higher area under the curve (AUC) values than did the PROMIS Depression. Overall, the PROMIS scores to achieve the PASS (“PASS threshold”) were worse for lower-income patients than for higher-income patients (Table 6). For the PROMIS PF and PI, the AUC values across income brackets ranged from 0.59 to 0.79 (Table 6). An AUC value of 0.5 mean the PROMIS score threshold is no better than chance at determining PASS, while an AUC value of 1 means the threshold perfectly discriminates who will or will not achieve PASS. The difference between thresholds for the PROMIS was 10 points when we compared the lowest and highest income brackets (Table 6). The PASS threshold of the PROMIS PF for the highest income bracket was near the mean of the US population (49), while the PASS threshold of the PROMIS PF for the lowest income bracket was more than one SD worse than the US population mean (39) (Table 6). Similarly, the PASS threshold of the PROMIS PI differed by 6 points when we compared the lowest and highest income brackets (Table 6). The PROMIS PI threshold for the highest income bracket was near normal for the US population (53), while that for the lowest income bracket was nearly one SD worse than normal (59) (Table 6). The PROMIS Depression showed poor ability to determine the PASS (Table 6).
Table 6.
Receiver operating characteristic curve analysis by income bracket for PROMIS thresholds to determine the PASS
Discussion
PROMs, such as PROMIS, provide surgeons a validated way to evaluate clinical outcomes that matter most to patients; however, such tools do not provide insight into the ability of patients to cope successfully with their current symptom and functional status. In contrast, PASS, a single, validated, yes/no question determines a patient’s ability to adapt to his or her current health status. While both PROMIS and PASS may add value to patient care, there is limited work evaluating the relationship between the two instruments, including when considering patient sociodemographic factors such as income. We found that only age was associated with a difference in the PASS rate, while gender, race, ethnicity, and income bracket were not. Second, patients in lower income brackets reported worse symptoms (PROMIS domain scores) than did those in higher income brackets with the difference between the highest and lowest income bracket for PROMIS PF being clinically important when evaluated using a ½ SD, distribution-based method for calculating MCID but not when using an anchor-based approach for calculating MCID. However, the difference between the highest and lowest income bracket for PROMIS PI was clinically important when evaluated using either calculation approach for MCID. Third, low-income patients had a PASS that was associated with far worse symptoms (up to approximately one SD worse in the PROMIS domains) than did high-income patients, which reported having a PASS when their symptoms were similar to the average of the US population.
Our study has some limitations. First, we used an area-based income status measure. Although evaluating individual income levels may be preferred, previous research has noted the lack of accurate data on income status in clinical settings [12]. However, area-based income status measures, including those determined using a similar geocoding approach [7], have been used and were found to be appropriate measurements in orthopaedic studies [16, 23]. Second, our findings may be specific to a tertiary care, academic institution serving patients with orthopaedic foot and ankle problems. Future work may consider factors associated with income (for example, rural versus urban settings) and other clinical populations at other care sites. Third, we included all patients with foot and ankle problems presenting for new-patient visits, regardless of diagnosis. There could be differences in pathology, and it is possible that that PROMIS and PASS may be more useful for specific diagnoses. However, this work provides an initial valuable overview that can support care discussions and guide future work. Fourth, our patient sample had a smaller number of nonwhite and non-Hispanic individuals than does the county we serve (Table 1). This finding may be due to a number of factors, including: (1) lack of health care access and equity for such individuals; (2) selection of foot and ankle providers from a competing health system; (3) lack of foot and ankle pathology in nonwhite and non-Hispanic individuals; and/or (4) a lack of interest in seeing a foot and ankle specialist. Given this bias in our sample, readers should be aware that our findings may not reflect their own patient populations; thus, surgeons should use caution in assuming that our PASS thresholds, for example, are the same for foot and ankle patients in all settings. Fifth, PROMIS and PASS may not work as well as we suspect in terms of evaluating and differentiating perception of health, respectively. However, both instruments have been previously evaluated; nonetheless, surgeons should ensure that they continue to use their clinical experience and expertise in conjunction with the information provided by these tools when providing care.
The only patient sociodemographic factor associated with differences in the proportion of patients achieving versus not achieving PASS was age. This finding differs from previous studies done by Houck et al. [9] and Wright et al. [22], which showed that there was no difference in patient age between those achieving versus not achieving PASS. However, the differences may be because we focused on only foot and ankle patients, while the previous studies analyzed data from patients presenting to a primary care provider or who were referred to an outpatient physical therapist with any musculoskeletal concern [9, 22]. Other potential reasons may be because the samples in the previous studies are smaller than ours or because we dichotomized age (18-64 years versus ≥ 65 years) to provide surgeons an easier starting point when engaging in shared decision-making discussions when using our research, while the previous studies kept age continuous [9, 22]. Further, Teunis et al. [19] found that age did not affect patient satisfaction in a sample of patients seeking hand care. Similar to Houck et al. [9], Teunis et al. [19] kept age continuous, which may explain the difference in our findings. In addition, instead of using PASS, Teunis et al. [19] used the Consumer Assessment of Healthcare Providers and Systems survey, a federally developed tool. Thus, our findings may differ because of the different instruments used. Future work can evaluate whether PASS and the Consumer Assessment of Healthcare Providers and Systems survey truly capture similar constructs, as measuring patient satisfaction can be quite challenging [18].
Between the highest and the lowest income bracket patients, PROMIS PF scores differed at a clinically important level when using a ½ SD, distribution-based approach but not when using an anchor-based approach; in contrast, PROMIS PI scores differed at a clinically important level when using either MCID calculation method. Indeed, high-income patients sought care when less impairment was present compared with low-income patients. In a study of 403 patients with adolescent idiopathic scoliosis, Zavatsky et al. [25] did not find difference in disease severity as measured by Cobb angle based on income. However, these findings may differ from ours for a few key reasons: (1) the authors dichotomized income as below or above USD 75,000, while we reported income in six groups; (2) the authors collected income data directly from patients, while we used a geocoding method; (3) the authors considered the Cobb angle as a measure of disease severity, while we measured clinical outcomes most important to patients using PROMIS. We feel that incorporating both objective disease-related measurements (such as the Cobb angle) and PROMs are needed to deliver the highest quality care, as both offer insight needed to guide treatment discussions and decisions. However, in a heterogeneous sample of foot and ankle patients, there is no similar measurement to the Cobb angle for all patients; thus, in such a population, PROMs may offer the best method of evaluating patient health, and surgeons should be aware that regardless of what imaging or other objective measurements show, foot and ankle patients of lower income status may report clinically worse symptoms at presentation. This finding is similar to that found in a study of 367 patients presenting with carpal tunnel syndrome, which showed that patients with higher levels of social deprivation had worse PROMIS scores than those with lower levels of social deprivation [23]. Overall, it is important to note that whether or not there is a true clinical difference in mean PROMIS scores between patients in different income brackets is based on the method of calculating the MCID. If surgeons ultimately agree upon a method of calculating the MCID, our results can be reevaluated in that light.
Perhaps the most interesting finding of our study is that the PASS thresholds of the PROMIS PF and PI differed based on income level. Between the highest and lowest income brackets, the PASS thresholds of the PROMIS PF and PI differed by one SD (10 points) and more than one-half of an SD (6 points) worse than those of the US population, respectively. PROMIS PF and PI showed a modest level of differentiation for different income levels, while PROMIS Depression did not provide useful clinical discrimination. Interestingly, this appears to contradict a study by Barrack et al. [2], which found that patients with lower income are less satisfied after TKA than patients with higher income. However, this may not be truly contradictory to our findings, as it is possible that the difference may be in the fact that if patients of lower income end up receiving operative care, they then have high clinical outcome expectations to be satisfied. Future work would need to determine if this is the case. Nonetheless, the finding that PASS differs based on income raises an important question: Should PASS be used to evaluate patient satisfaction with health status even though it is affected by patient income? While the simplicity of a single question is enticing, it is possible that a more robust method of evaluating a patient’s ability to cope with his or her health status is warranted to ensure consistency across patient groups. This would allow surgeons to know whether a patient is truly satisfied or dissatisfied without having to consider patient income, which may not be readily available. In its current form, we believe PASS still offers insight into patient satisfaction and ability to cope with a given symptom state uncaptured by PROMIS; however, patients should then be stratified by income to compare “apples to apples.” An updated PASS question or series of questions, if needed, that risk-adjusts for income would be beneficial. Future work should aim to accomplish this goal.
In conclusion, this study shows that: (1) the proportion of patients achieving PASS in a foot and ankle patient sample is higher in younger patients; (2) patients in a lower income bracket present for foot and ankle care when their symptoms are worse compared with patients in a higher income bracket; and (3) a patient’s income influences his or her judgement of whether symptoms and activity level are satisfactory (PASS). Despite the impact of patient income on PASS, this validated question provides information on patient satisfaction and coping ability uncaptured by PROMIS; thus, it can help guide expectation-setting and shared decision-making discussions regarding treatment options. However, future work should look to create a PASS question, or set of questions, that risk-adjust for income so that it is no longer biased based on this patient sociodemographic factor. Until then, stratifying patients by income may be the best approach. Additional research can also better determine why patients from lower income brackets present for foot and ankle care when their symptoms are worse. Furthermore, future research can determine whether similar findings are present when evaluating treatment outcomes using PROMIS and PASS when accounting for income and other patient sociodemographic factors. Despite there being no clear definition of health care quality to date [4], this study builds upon previous work by helping us to better understand the relationship between PROMIS, PASS, and patient sociodemographic factors so that we can care for patients with varied backgrounds and income levels as best as possible.
Acknowledgments
None.
Footnotes
One of the authors (DNB) certifies that he has received grants from Alpha Omega Alpha, outside the submitted work. One of the authors (JFB) certifies that she has received payments or benefits in an amount less than USD 10,000 from PROMIS Health Organization (Evanston, IL, USA), payments or benefits in an amount less than USD 10,000 from the American Orthopaedic Foot & Ankle Society (Rosemont, IL, USA), grants and personal fees in amount of USD 10,000 to USD 100,000 from Cartiva (Alpharetta, GA, USA), payments or benefits in an amount less than USD 10,000 from Clinical Orthopaedics and Related Research® (Philadelphia, PA, USA), personal fees in an amount less than USD 10,000 from DJ Orthopaedics (Dallas, TX, USA), grants and personal fees in an amount less than USD 10,000 from Ferring Pharmaceuticals (Parsippany, NJ, USA), personal fees and benefits in an amount less than USD 10,000 from Nextremity Solutions Inc (Warsaw, IN, USA), personal fees in an amount of USD 10,000 to USD 100,000 from Stryker (Kalamazoo, MI, USA), payments and benefits in an amount less than USD 10,000 from Techniques in Foot and Ankle Surgery (Philadelphia, PA, USA), grants and personal fees in an amount less than USD 10,000 from Wright Medical Technology Inc (Memphis, TN, USA), personal fees in an amount less than USD 10,000 from Zimmer (Warsaw, IN, USA), outside the submitted work. Other authors (KM, CD, KF, and JRH) certify that they have no commercial associations (consultancies, stock ownership, equity interest, patent/licensing arrangements, etc.) that might pose a conflict of interest in connection with the submitted article.
All ICMJE Conflict of Interest Forms for authors and Clinical Orthopaedics and Related Research® editors and board members are on file with the publication and can be viewed on request.
Each author certifies that his or her institution approved the human protocol for this investigation and that all investigations were conducted in conformity with ethical principles of research.
This work was performed at the Department of Orthopaedics and Rehabilitation, University of Rochester Medical Center, Rochester, NY, USA.
References
- 1.Anderson MR, Baumhauer JF, DiGiovanni BF, Flemister S, Ketz JP, Oh I, Houck JR. Determining success or failure after foot and ankle surgery using Patient Acceptable Symptom State (PASS) and Patient Reported Outcome Information System (PROMIS). Foot Ankle Int. 2018;39:894-902. [DOI] [PubMed] [Google Scholar]
- 2.Barrack RL, Ruh EL, Chen J, Lombardi AV, Jr., Berend KR, Parvizi J, Della Valle CJ, Hamilton WG, Nunley RM. Impact of socioeconomic factors on outcome of total knee arthroplasty. Clin Orthop Relat Res. 2014;472:86-97. [DOI] [PMC free article] [PubMed] [Google Scholar]
- 3.Baumhauer JF. Patient-reported outcomes - Are they living up to their potential? N Engl J Med. 2017;377:6-9. [DOI] [PubMed] [Google Scholar]
- 4.Bernstein DN, Mesfin A, Bozic KJ. Total joint arthroplasty quality ratings: How are they similar and how are they different? Am J Orthop (Belle Mead NJ). 2018;47. [DOI] [PubMed] [Google Scholar]
- 5.Cella D, Riley W, Stone A, Rothrock N, Reeve B, Yount S, Amtmann D, Bode R, Buysse D, Choi S, Cook K, Devellis R, DeWalt D, Fries JF, Gershon R, Hahn EA, Lai JS, Pilkonis P, Revicki D, Rose M, Weinfurt K, Hays R. The Patient-Reported Outcomes Measurement Information System (PROMIS) developed and tested its first wave of adult self-reported health outcome item banks: 2005-2008. J Clin Epidemiol. 2010;63:1179-1194. [DOI] [PMC free article] [PubMed] [Google Scholar]
- 6.Cook KF, O'Malley KJ, Roddey TS. Dynamic assessment of health outcomes: time to let the CAT out of the bag? Health Serv Res. 2005;40:1694-1711. [DOI] [PMC free article] [PubMed] [Google Scholar]
- 7.Goodman SM, Mandl LA, Parks ML, Zhang M, McHugh KR, Lee YY, Nguyen JT, Russell LA, Bogardus MH, Figgie MP, Bass AR. Disparities in TKA outcomes: Census tract data show interactions between race and poverty. Clin Orthop Relat Res. 2016;474:1986-1995. [DOI] [PMC free article] [PubMed] [Google Scholar]
- 8.HealthMeasures. PROMIS. 2018. Available at: http://www.healthmeasures.net/score-and-interpret/interpret-scores/promis. Accessed January 1, 2019.
- 9.Houck J, Kang D, Cuddeford T, Rahkola S. Ability of patient-reported outcomes to characterize Patient Acceptable Symptom State (PASS) after attending a primary care physical therapist and medical doctor collaborative service: a cross-sectional study. Arch Phys Med Rehabil. 2019;100:60-66. [DOI] [PubMed] [Google Scholar]
- 10.Hung M, Baumhauer JF, Licari FW, Voss MW, Bounsanga J, Saltzman CL. PROMIS and FAAM minimal clinically important differences in foot and ankle orthopedics. Foot Ankle Int. 2019;40:65-73. [DOI] [PMC free article] [PubMed] [Google Scholar]
- 11.Jones RS, Stukenborg GJ. Patient-Reported Outcomes Measurement Information System (PROMIS) use in surgical care: a scoping study. J Am Coll Surg. 2017;224:245-254.e241. [DOI] [PubMed] [Google Scholar]
- 12.Krieger N. Overcoming the absence of socioeconomic data in medical records: validation and application of a census-based methodology. Am J Public Health. 1992;82:703-710. [DOI] [PMC free article] [PubMed] [Google Scholar]
- 13.Levy DM, Kuhns BD, Chahal J, Philippon MJ, Kelly BT, Nho SJ. Hip arthroscopy outcomes with respect to Patient Acceptable Symptomatic State and minimal clinically important difference. Arthroscopy. 2016;32:1877-1886. [DOI] [PubMed] [Google Scholar]
- 14.Liu H, Cella D, Gershon R, Shen J, Morales LS, Riley W, Hays RD. Representativeness of the Patient-Reported Outcomes Measurement Information System Internet panel. J Clin Epidemiol. 2010;63:1169-1178. [DOI] [PMC free article] [PubMed] [Google Scholar]
- 15.Muller B, Yabroudi MA, Lynch A, Lai CL, van Dijk CN, Fu FH, Irrgang JJ. Defining thresholds for the Patient Acceptable Symptom State for the IKDC subjective knee form and KOOS for patients who underwent ACL reconstruction. Am J Sports Med. 2016;44:2820-2826. [DOI] [PubMed] [Google Scholar]
- 16.Okoroafor UC, Gerull W, Wright M, Guattery J, Sandvall B, Calfee RP. The impact of social deprivation on pediatric PROMIS health scores after upper extremity fracture. J Hand Surg Am. 2018;43:897-902. [DOI] [PubMed] [Google Scholar]
- 17.Papuga MO, Dasilva C, McIntyre A, Mitten D, Kates S, Baumhauer JF. Large-scale clinical implementation of PROMIS computer adaptive testing with direct incorporation into the electronic medical record. Health Systems. 2017:1-12. [DOI] [PMC free article] [PubMed] [Google Scholar]
- 18.Ring D, Leopold SS. Editorial-Measuring satisfaction: Can it be done? Clin Orthop Relat Res. 2015;473:3071-3073. [DOI] [PMC free article] [PubMed] [Google Scholar]
- 19.Teunis T, Thornton ER, Jayakumar P, Ring D. Time seeing a hand surgeon is not associated with patient satisfaction. Clin Orthop Relat Res. 2015;473:2362-2368. [DOI] [PMC free article] [PubMed] [Google Scholar]
- 20.United States Census Bureau. QuickFacts: Monroe County, New York. 2018. Available at: https://www.census.gov/quickfacts/monroecountynewyork. Accessed February 7, 2019. [Google Scholar]
- 21.Wang AY, Wong MS, Humbyrd CJ. Eligibility criteria for lower extremity joint replacement may worsen racial and socioeconomic disparities. Clin Orthop Relat Res. 2018;476:2301-2308. [DOI] [PMC free article] [PubMed] [Google Scholar]
- 22.Wright AA, Hensley CP, Gilbertson J, Leland JM, 3rd, Jackson S. Defining patient acceptable symptom state thresholds for commonly used patient reported outcomes measures in general orthopedic practice. Man Ther. 2015;20:814-819. [DOI] [PubMed] [Google Scholar]
- 23.Wright MA, Beleckas CM, Calfee RP. Mental and physical health disparities in patients with carpal tunnel syndrome living with high levels of social deprivation. J Hand Surg Am. 2018. [DOI] [PMC free article] [PubMed] [Google Scholar]
- 24.Yaffe M, Goyal N, Kokmeyer D, Merrell GA. The use of an iPad to collect patient-reported functional outcome measures in hand surgery. Hand (N Y). 2015;10:522-528. [DOI] [PMC free article] [PubMed] [Google Scholar]
- 25.Zavatsky JM, Peters AJ, Nahvi FA, Bharucha NJ, Trobisch PD, Kean KE, Richard S, Bucello Y, Valdevit A, Lonner BS. Disease severity and treatment in adolescent idiopathic scoliosis: the impact of race and economic status. Spine J. 2015;15:939-943. [DOI] [PubMed] [Google Scholar]


