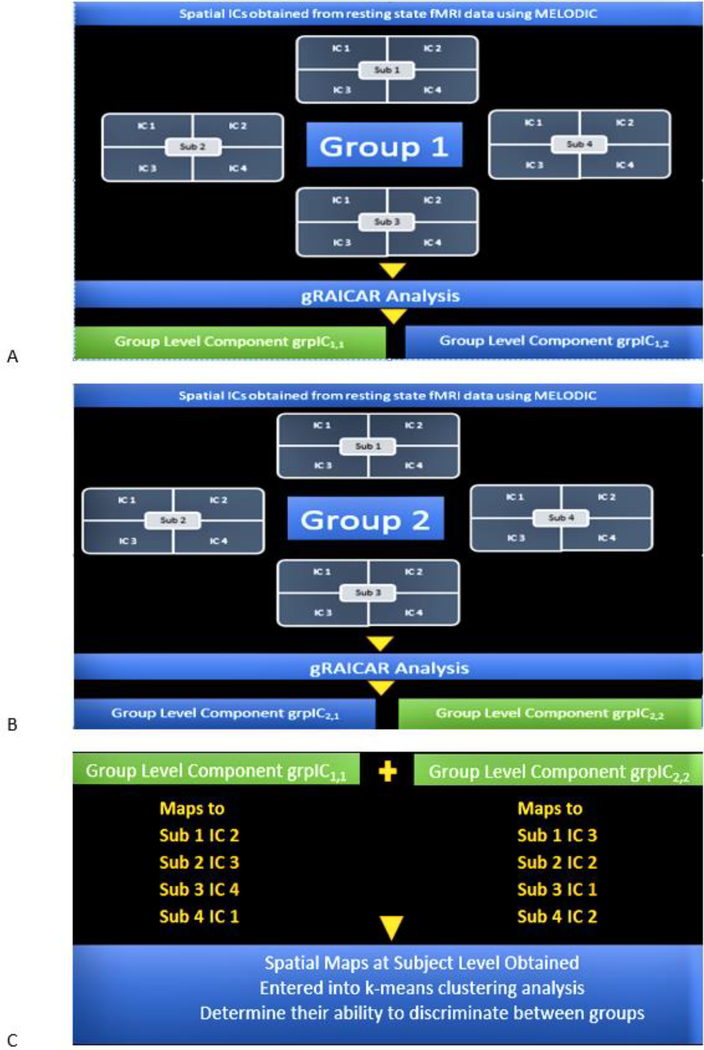
Fig. 3.
A. A toy illustration of the analysis workflow. gRAICAR analysis on ICs estimated from fMRI data corresponding to Group 1 is assumed to produce group-level components grpIC1,1 and grpIC1,2. Let us suppose that grpIC1,1 has highest inter-subject consistency in Group 1 and hence be selected for further processing. B. A toy illustration of the analysis workflow. gRAICAR Analysis on ICs estimated from fMRI data corresponding to Group 2 is assumed to produce group-level components grpIC2,1 and grpIC2,2. Let us suppose that grpIC2,2 has highest inter-subject consistency in Group 2 and hence be selected for further processing. C. The spatial maps at the individual subject level corresponding to group-level components from Fig. 3 A and Fig. 3 B, i.e. the most reproducible ICs within each group, are obtained and entered into a k-means clustering analysis in order to determine their ability to discriminate between the groups.

